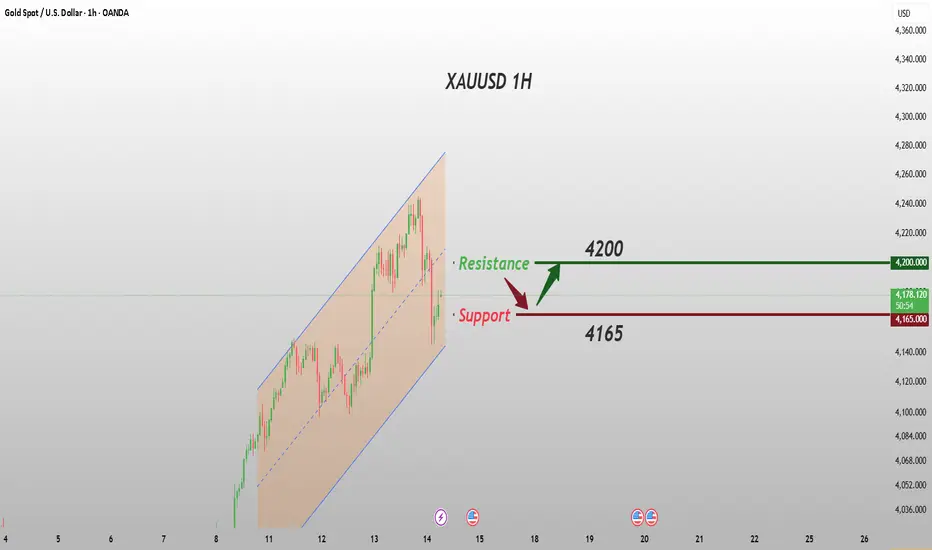
Gold Faces Rejection at Resistance Zone – Potential Bearish CorrAnalysis:
The gold price (XAU/USD) is currently testing a strong resistance zone near $4,235–$4,240, where previous bullish momentum appears to be slowing down. Sellers are showing interest in this area, suggesting a potential bearish reversal or correction phase.
A clear support zone lies around $4,140–$4,150, which serves as the target for the expected downward move. If price breaks below this support, further declines could extend toward the next demand zone.
However, if gold breaks and closes above the resistance zone with strong volume, it could invalidate this bearish setup and open the path to new highs.
Key Points:
Resistance Zone: $4,235 – $4,240
Support Zone: $4,140 – $4,150
Short-term Bias: Bearish correction expected
Target: Support zone near $4,145
Xauusdbuy

GOLD BIG BUY HIGH PROBABILITY SETUP SOON!!! 🚨 XAUUSD HIGH PROBABILITY BUY SETUP 🚨
* Here We Can See Clearly The Next Potential Moves For GOLD Coming Hours/Days.
* Keep Your Eyes Close On Your Trading Positions.
* Happy PIP Hunting Traders.
FXKILLA.

Gold Price Outlook – Trade Setup (XAU/USD)📊 Technical Structure
FOREXCOM:XAUUSD Gold (XAU/USD) has regained upward momentum, bouncing back above $4,200 after briefly pulling back from a three-week high. The metal remains within a broad bullish structure, supported by risk-off sentiment and a softer USD.
The Resistance Zone lies between $4,207–$4,214, which coincides with recent swing highs. The Support Zone is established around $4,166–$4,174, representing the demand base from earlier this week. A short-term pullback toward the support zone could offer a buy-on-dip opportunity, with price likely to retest the $4,210 resistance area if momentum holds.
🎯 Trade Setup
Idea: Buy on retracement near support, targeting a retest of $4,210 resistance.
Entry: $4,167 – $4,174
Stop Loss: $4,166
Take Profit 1: $4,207
Take Profit 2: $4,214
Risk–Reward Ratio: ≈ 1 : 4.88
If gold breaks below $4,165, the bullish bias would weaken, potentially opening room for deeper correction toward $4,150.
🌐 Macro Background
Gold climbed above $4,200 on Friday amid renewed risk aversion and a weaker U.S. Dollar, as markets digest ongoing fallout from the U.S. government shutdown and signs of slowing growth.
FXStreet’s Haresh Menghani noted that “Gold retakes $4,200 as USD weakens on economic concerns and a risk-off mood boosts demand.” 【FXStreet】
Economic Concerns: Investors remain worried that the prolonged U.S. government closure shaved 1.5–2.0% off quarterly GDP growth, reinforcing expectations of weaker economic activity ahead.
USD Under Pressure: The U.S. Dollar trades near a two-week low, as markets anticipate softer data once official reports resume.
Fed Rate-Cut Bets: While some Fed officials, including Susan Collins and Neel Kashkari, warned against hasty easing, the CME FedWatch Tool still shows a 50% chance of a 25bp rate cut in December, and 75% odds for January.
Data Delays: A senior White House official confirmed that key October data (employment and inflation) might not be released, adding uncertainty to policy projections.
Risk Sentiment: Weaker equities and global risk aversion continue to support gold as investors seek safety amid limited U.S. macro visibility.
Despite the reduced odds of an immediate December cut, the medium-term narrative remains gold-positive, with the Fed leaning toward eventual easing once data returns.
🔑 Key Technical Levels
Resistance: $4,207 – $4,214
Support: $4,167 – $4,174
Psychological Level: $4,200
📌 Trade Summary
Gold’s short-term structure favours buying dips toward $4,167–$4,174, supported by risk-off sentiment and a fragile U.S. Dollar. As long as price stays above $4,165, the bullish outlook remains valid with potential retest of the $4,207 area. However, uncertainty around delayed U.S. data may keep volatility elevated into next week.
⚠️ Disclaimer
This analysis is for reference only and does not constitute trading advice. Trading involves significant risk, and proper risk management is essential.

Fed Rate-Cut Outlook Shifts — Gold Faces New Challenges AgainGold ultimately formed a typical head and shoulders pattern, with prices falling as expected to the 4150-4140 range and currently in a rebound phase. The main resistance remains concentrated in the shoulder area at 4189/4210, followed by the 4223 level.
If the current rebound lacks strength, prices will likely fall back to the 4150-4140 / 4123-4118 range to attract new bullish funds and accumulate strength before attempting another upward move. If it reaches around 4120, the first resistance level to consider is the 4145-4158 area.
On the 1-hour chart, this pullback touched the MA60 support, and the overall bullish structure remains intact. The selling pressure around 4250 has also been largely released. As long as the rebound can stabilize above the MA20 (4202), and with supportive news, there is still a chance to test the 4300 area, and a break above the previous high of 4381 is not out of the question.
Note: If subsequent news does not support the bulls, it may trigger the scenario I mentioned earlier (a downward retracement to fill the gap below 4010).
On the daily chart, the structure remains bullish, with prices supported by the MA5. Key support is located at the MA30 (around 4086), and the bullish trend is currently undamaged.
Note: The psychological level of 4300 presents resistance. Whether approaching or breaking through, selling pressure is inevitable. Therefore, if the price successfully breaks through and rises above 4270, avoid blindly chasing the price, as this could lead to a passive position.

Threefold certainty-driven, solid multi-head foundationCentral bank gold purchases form a "price bottom": The People's Bank of China has continuously increased its gold holdings for 12 consecutive months, with the latest reserve amount approaching 2,305 tons, and the cost of gold purchases falling within the range of 3,900 - 4,000 US dollars; global central banks' net gold purchases in the first three quarters of 2025 exceeded 800 tons, and 3,950 US dollars became the "supporting bottom" for central banks. Once it falls below this level, there is a high probability of triggering an increase in buying.
Geopolitical risks are regularly supporting the demand for safe-haven assets: The prolonged conflict in Ukraine and the escalating unrest in the Middle East have formed a multi-polar conflict network, highlighting the strategic allocation value of gold as an "ultimate defense asset". Historical data shows that during periods of ongoing geopolitical conflicts, although the volatility of gold increases, the correction range is limited, often serving as a safe haven for funds.
The broad direction of the Fed's loose policy has not changed: Although the probability of a December interest rate cut has dropped to 55%, and there are cautious voices within the Fed, the long-term loose logic remains unchanged - the government shutdown in the United States may lead to a 1.5% GDP decline in the fourth quarter, and under the pressure of weak economic conditions, the interest rate cut cycle in 2026 will continue. In a low-interest-rate environment, the attractiveness of gold as a non-interest-bearing asset continues to increase.
Today's gold trading strategy
buy:4165-4175
tp:4185-4200
sl:4155
Gold Faces a New Challenge — 4300 or 4010?Currently, there are signs of a head and shoulders pattern on the 30-minute chart. We need to pay attention to the shoulder resistance and trend support. If the head and shoulders pattern forms, the downside may reach the 4150-4140 area.
If next week's data and news do not support the bulls, we should be wary of a larger head and shoulders pattern. As previously mentioned, there is still a gap below 4010. If this occurs, it's possible that the market will use this opportunity to fill the gap.

Gold: Watch Support Near 4168 and Resistance at 4252With strong rate-cut expectations combined with heightened geopolitical tensions, gold’s safe-haven appeal has been significantly reinforced, pushing prices back above the 4200 level. From a medium-to-long-term perspective, gold still has considerable upside potential, with some voices in the market even calling for a move toward 5000.
In the short term, the U.S. government is about to resume operations, and the delayed economic data will soon be released. The market widely expects these reports to confirm a slowdown in the U.S. economy. Meanwhile, the White House has cautioned that October’s employment and inflation data may not be published on time due to the disruption caused by the shutdown. This uncertainty has further intensified concerns about the economic outlook, providing continuous support for gold’s upward momentum.
However, it’s worth noting that the policies and data released after the government’s reopening remain uncertain. The market has already priced in a considerable portion of bullish expectations. If the actual results align with these expectations, the short-term upside could be limited; if they diverge, a corrective pullback would be likely. Therefore, proper risk management is essential to navigate potential volatility.
Technical Outlook:
On the daily chart, moving averages show a strong bullish alignment. The current uptrend is supported by the MA5 (around 4127), while the key support lies near the MA30 (around 4074). The MACD has formed a bullish crossover, and the price is moving between the Bollinger Bands’ middle line (4075) and upper band (4298).
This means that during the price consolidation around 4200, key supports to watch are 4150–4127 and the middle band near 4075. (Indicator levels may shift as volatility increases, so real-time monitoring is recommended.)
On the 1-hour chart, the main supports are 4168/4152/4138. As long as these levels hold, gold still has room to test 4223–4250 in the short term. With supportive news catalysts, a move toward 4300 cannot be ruled out.
Overall, next week’s market will likely see heightened volatility. Opportunity and risk coexist — those who manage position size and timing well could see their profits multiply, while those lacking discipline and risk awareness could face severe drawdowns or even liquidation.

11/13 XAUUSD: How should you trade after the surge?Fundamental Analysis:
The U.S. government has officially ended its shutdown today. The passage of the funding bill will ensure continuous appropriations, providing operational funding for most federal agencies through January 30, 2026.
Following the announcement, White House Press Secretary Levitt stated that due to the earlier government shutdown, it is unlikely that the October Non-Farm Payrolls (NFP) and CPI data will be released as scheduled.
With the market eagerly awaiting data-driven guidance, this unexpected development has instead intensified risk aversion, triggering another sharp rally in gold prices.
Technical Analysis:
On the 4-hour chart, gold prices have reached the 0.618 Fibonacci extension level of the current uptrend, where they are now encountering resistance.
At this stage, chasing the rally carries a potential pullback risk. Therefore, any further bullish positioning should ideally be considered after a corrective retracement.
Support and Resistance:
Support: $2,180 — today’s intraday low and the 0.382 Fibonacci retracement level.
Resistance: $2,240–$2,250 — today’s intraday high and the 0.618 Fibonacci extension level.
Trading Strategy:
Primary bias: Buy on dips; short at highs as a secondary approach.
Entry (Long): Consider buying near $2,180, provided the level holds and is not breached.
Entry (Short): If gold rallies into the $2,240–$2,250 zone and fails to break above, consider short positions from that area.
The core support of the bullish trendLoose expectations dominate the macro logic: The probability of the Fed cutting interest rates in December has risen to 65%. Coupled with the possible weak economic data after the US government shutdown, the New York Fed's indication of possibly restarting asset purchases, the expectation of loose market liquidity continues to rise, significantly reducing the cost of holding gold, constituting the core driving force for the bulls.
Risk aversion and capital resonance: Global central banks continue to accumulate gold (net purchases of 800 tons in the first three quarters of 2025), and the repeated geopolitical conflicts (Russia-Ukraine, Middle East situation) drive the demand for risk aversion. At the same time, the SPDR gold ETF's holdings increase and the gold-to-silver ratio narrows, reflecting the continuous inflow of institutional funds into the precious metals sector, with a strong bullish atmosphere.
Today's gold trading strategy
buy:4190-4200
tp:4210-4230
sl:4180

Gold: Bullish Trend, Watch Selling Pressure Near 4200Gold initially tested support around 4096 yesterday and held firm. After rebounding to the 4150 area today, price made a second test of that support. Selling pressure near 4150 has eased significantly after two rounds of digestion. The next key zone to watch is 4185–4221, with particular attention to the 4200 psychological level, where the probability of a short-term pullback increases. As long as the corresponding support zone remains intact, the bullish trend is expected to continue.
From a fundamental perspective, the market’s focus is now on the outcome of the U.S. Congress vote and comments from Federal Reserve officials.

GoldXAUUSD
- Completed " 123 " Impulsive Waves
- Break of Structure
- Higher High - Higher Low
- RSI - Divergence
- Fair Value Gap

Gold Bullish Continuation Setup from Ascending Channel Support✅ Analysis – XAUUSD (Gold)
1. Market Structure
Price is moving inside a clean ascending channel, showing a sustained uptrend.
The lower boundary (rejection line) is acting as strong support, where buyers have entered repeatedly.
The current price action is showing a pullback toward this support area, which is typical before a continuation move higher.
2. Current Price Action
Price has retraced back into the buy zone near the channel support.
Candlesticks show slowing bearish momentum, suggesting buyers may soon take control.
Your chart projection indicates a possible bullish bounce.
3. Trade Setup
✅ Buy Zone: Near the rejection line / lower channel
✅ SL (Stop-Loss): Below the support line — smart placement to protect against channel breakdown
✅ Target: Upper resistance of the channel (around 4230 – 4260 zone)
This gives a good risk-to-reward ratio, based on trend continuation.
4. Bullish Expectation
As long as price stays above the rejection line, the uptrend remains valid.
A bounce from this zone is likely to push price toward the target box.

Gold (XAU/USD) Testing Key ResistanceAnalysis:
Gold (XAU/USD) is currently trading around 4145, approaching a significant resistance zone between 4100 and 4120, marked as the first target region. This level previously acted as strong resistance, and price may experience a temporary pullback before resuming upward momentum.
The strong psychological support zone near 3890–3920 served as a solid foundation for the recent bullish reversal, confirmed by double-bottom formations and consistent higher highs.
If gold maintains momentum above 4120, the next upside target lies around 4210, aligning with previous structural highs and a major supply zone. However, rejection from the current resistance could trigger a short-term retracement toward 4100 before another push upward.
Summary:
Immediate Resistance: 4100–4120
Next Target: 4210
Key Support: 3890–3920
Bias: Bullish above 4100, potential retracement before continuation

Gold Holds 4200, Bulls Eye 4250Gold showed a fluctuating upward trend today, successfully standing firm above the critical 4200 level, with strong bullish momentum. Supported by multiple positive factors, there remains room for further upside, though potential volatility risks should be guarded against.
From the daily chart structure, Gold has steadily broken through the key integer level of 4200 and successfully stood above the 61.8% Fibonacci retracement level of the recent pullback range, presenting a favorable technical pattern. On the indicator front, both RSI and MACD remain in positive territory, indicating sufficient short-term upward momentum.
Key support levels below are concentrated around 4180 and 4100. If these critical levels can be held, the subsequent upward trend is expected to continue; a breakdown below them may trigger technical selling, dragging gold prices toward 4075 or even the psychological threshold of 4000.
If gold can continue to hold firmly above 4200, the next target range is expected to be 4250, with further potential to test 4300.
Trading Strategy:
Buy 4170 - 4180
SL 4160
TP 4210 - 4220 - 4230
Sell 4230 - 4240
SL 4250
TP 4210 - 4220 - 4190

ElDoradoFx – GOLD ANALYSIS (13/11/2025, LONDON SESSION)1. Market Overview
Gold enters the London session trading around $4,209–$4,211, maintaining strong bullish momentum following an impulsive rally from $4,180 demand. Price is currently compressing below the key liquidity region $4,219–$4,223, forming a bullish continuation structure. As long as $4,195–$4,188 holds, gold maintains a bullish bias with potential for a London breakout.
⸻
2. Technical Breakdown
🔹 Daily (D1)
• Price continues the recovery after the November pullback, trading strongly above the 20EMA & 50EMA.
• RSI ~64 shows strong bullish control.
• Next major daily resistance remains $4,260–$4,300.
• A daily close above $4,219 increases probability of continuation toward $4,260+.
🔹 H1
• Structural BOS at $4,205 → $4,219 confirms bullish continuation.
• Price consolidates inside a tight range under resistance $4,219–$4,223.
• Support zones: $4,204–$4,195 and $4,188.
• RSI above 50 → bullish structure stays intact.
🔹 15M–5M
• Higher lows forming at $4,198 / $4,202.
• Price coiling inside ascending structure → typical pre-breakout compression.
• If gold dips, buyers expected to defend $4,204–$4,195 (Golden Zone).
⸻
3. Fibonacci Analysis (Swing 4,180 → 4,219)
Level Price
38.2% 4,204
50.0% 4,199
61.8% 4,195
🎯 Golden Zone: 4,204 – 4,195
(The main rebuy zone if London retraces)
⸻
4. High-Probability Trade Scenarios
📈 BUY SCENARIO (Primary Bias)
Buy Zone: 4,204 – 4,195 (Golden Zone + HL structure)
🎯 Targets: 4,219 → 4,230 → 4,245
🛑 SL: Below 4,188
✔️ Confirmation: 5M–15M CHoCH or bullish engulfing from Golden Zone.
⸻
📉 SELL SCENARIO (Countertrend)
Sell Zone: 4,219 – 4,223 (weak high + liquidity sweep zone)
🎯 Targets: 4,210 → 4,202 → 4,195
🛑 SL: Above 4,230
✔️ Confirmation: Bearish rejection + RSI divergence.
⸻
💥 BUY BREAKOUT SETUP
Trigger: Break & H1 close above 4,223
Retest Zone: 4,219–4,220
🎯 Targets: 4,235 → 4,245 → 4,260
🛑 SL: Below 4,210
⸻
💥 SELL BREAKOUT SETUP
Trigger: Break & close below 4,188
Retest Zone: 4,188–4,194
🎯 Targets: 4,180 → 4,168 → 4,150
🛑 SL: Above 4,202
⸻
5. Fundamental Watch
• London quiet until US midday data.
• US PPI and job numbers may trigger volatility in the New York session.
• Dollar remains soft, supporting bullish continuation unless structure flips below 4,188.
⸻
6. Key Technical Levels
Resistance Levels
• 4,219
• 4,223
• 4,235
• 4,245
Support Levels
• 4,204
• 4,195
• 4,188
• 4,180
Golden Zone
➡️ 4,204 – 4,195
Breakout Triggers
• Bullish: > 4,223
• Bearish: < 4,188
⸻
7. Analyst Summary
Gold remains in a clear bullish structure, but price is currently hitting resistance at 4,219–4,223, where liquidity is stacked. A dip into the Golden Zone (4,204–4,195) is healthy before a continuation. If London holds above 4,195, breakout toward 4,245–4,260 is likely.
A full bearish shift only occurs with a break below 4,188.
⸻
8. Final Bias Summary
📊 Bias: Bullish above 4,195
🔻 Invalidation: Bearish shift below 4,188
🎯 Focus: Watch Golden Zone reaction or a breakout above 4,223
⸻
— ElDoradoFx PREMIUM 3.0 Team 🚀

The bullish trend remains unchanged; we remain bullish on gold.#XAUUSD OANDA:XAUUSD TVC:GOLD
The daily chart is above the MA5 moving average, indicating that the bullish trend remains unchanged. However, we do not chase the price at high levels. Our core strategy is to wait for a pullback to support before going long. From the hourly chart, gold is fluctuating within the 4220-4180 range in the short term. If gold retraces to the short-term support of 4190-4180 during the European session, it is advisable to continue to go long on gold, with key support at 4160-4150. If the price rebounds to the previous high of 4250-4260, then yesterday's strategy remains valid.
Gold Price Outlook – Trade Setup (XAU/USD)📊 Technical Structure
OANDA:XAUUSD Gold (XAU/USD) extended its bullish run, reaching a new three-week high around $4,213, before encountering selling pressure near the Resistance Zone ($4,210–$4,216). The metal is now consolidating, with intraday support forming near $4,183–$4,188, aligning with the previous breakout level.
The short-term structure suggests a potential corrective dip before another push higher, as long as support holds above $4,181. A retest of the $4,212–$4,216 zone remains the primary upside target, while failure to sustain above support could expose the $4,170 area.
🎯 Trade Setup
Idea: Buy on dip near support, targeting retest of recent highs.
Entry: $4,188 – $4,183
Stop Loss: $4,181
Take Profit 1: $4,211
Take Profit 2: $4,216
Risk–Reward Ratio: ≈ 1 : 4.23
A close below $4,180 would invalidate the bullish setup, suggesting deeper retracement toward $4,170–$4,165.
🌐 Macro Background
Gold remains well-supported amid dovish Fed expectations and lingering economic concerns, despite a stronger risk appetite following the U.S. government reopening.
FXStreet’s Haresh Menghani commented that “Gold hits a three-week top as dovish Fed bets offset U.S. government reopening optimism.” 【FXStreet】
Fed Policy Outlook: Markets are pricing in roughly a 60% chance of a 25-basis-point Fed rate cut in December, as weak job data and soft inflation expectations weigh on the U.S. Dollar.
Labor Market Signs: Revelio Labs reported 9,100 job losses in October, with government payrolls down by 22,200, while the Chicago Fed noted a slight uptick in unemployment — reinforcing the view that economic momentum is fading.
Government Reopening: The U.S. Senate’s approval of a funding bill ended the longest government shutdown in history, sparking risk-on sentiment in equities. While this reduces safe-haven demand, the weaker macro backdrop keeps gold resilient.
Fed Commentary: Atlanta Fed President Raphael Bostic acknowledged that the job market remains balanced but warned against easing too slowly, emphasizing limited inflation risk — a stance the market interprets as mildly dovish.
In short, while risk sentiment caps near-term upside, monetary easing bets and weak macro data continue to underpin gold’s medium-term strength.
🔑 Key Technical Levels
Resistance: $4,211 – $4,216
Support: $4,183 – $4,188
Psychological Level: $4,200
📌 Trade Summary
Gold remains bullish above $4,183, with the bias favouring a buy-on-dip approach. As long as support holds, the metal is likely to rebound toward $4,211–$4,216, following its breakout momentum from earlier this week. The underlying macro tone continues to favour buyers in the medium term.
⚠️ Disclaimer
This analysis is for reference only and does not constitute trading advice. Trading involves significant risk, and proper risk management is essential.

ElDoradoFx – GOLD ANALYSIS (13/11/2025, ASIA SESSION)1. Market Overview
Gold enters the Asia session trading around $4,194–$4,200, extending the strong bullish continuation from yesterday’s impulsive rally that broke multiple intraday structures. Price is now pressing into a fresh short-term supply zone at $4,198–$4,211, after an aggressive upside move from the $4,125 liquidity zone.
Momentum remains bullish but overstretched, and Asia is likely to create a pullback before continuation.
⸻
2. Technical Breakdown
🔹 Daily (D1)
• Bullish continuation with a strong daily candle closing above previous BOS.
• Price is approaching the broader descending trendline but still has room to extend to $4,250–$4,300 if momentum persists.
• RSI ~63 showing bullish strength but nearing overbought conditions.
• Higher-timeframe support sits at $4,014–$3,910.
🔹 H1
• Strong breakout from the intraday downtrend structure.
• Price is consolidating under $4,200–$4,211 which aligns with previous liquidity & RSI(70) levels.
• EMAs fully aligned for bullish continuation (10/20/50 EMA stack).
• Pullback into $4,172–$4,150 is healthy before another leg up.
🔹 15M–5M
• 15M shows repeated equal highs + weak high around $4,198–$4,211, indicating liquidity above.
• 5M shows early exhaustion and decreasing MACD momentum.
• Structure supports a pullback first, then continuation.
⸻
3. Fibonacci Analysis
Swing used: $4,125 → $4,211 (latest impulsive leg)
• 38.2% = $4,178
• 50.0% = $4,167
• 61.8% = $4,156
🎯 Golden Zone: $4,178 – $4,156
This aligns perfectly with 15M demand + EMAs — ideal bullish continuation zone.
⸻
4. High-Probability Trade Scenarios
📈 BUY SCENARIO (Primary Bias – Continuation)
Buy Zone:
• $4,178 – $4,156 (Golden Zone + EMA stack + bullish CHoCH area)
Targets:
• TP1: $4,200
• TP2: $4,211 (Weak High)
• TP3: $4,230–$4,245
• TP4: $4,260+ (Next H1 liquidity range)
Stop Loss:
• Below $4,150
Confirmation:
• Bullish engulfing on 5M–15M
• BOS / CHoCH from Golden Zone
• MACD flips green from zero line
⸻
📉 SELL SCENARIO (Countertrend Only)
Sell Zone:
• $4,198 – $4,211 (Major liquidity + supply + Weak High)
Targets:
• TP1: $4,185
• TP2: $4,178
• TP3: $4,167
Stop Loss:
• Above $4,220–$4,225
Confirmation:
• Sharp rejection w/ long upper wick
• Divergence forming at highs
• 5M BOS below $4,188
⸻
💥 Breakout BUY Setup
Trigger:
• Break & 15M close above $4,211
Retest Zone:
• $4,200–$4,205
Targets:
• $4,230 → $4,245 → $4,260+
Stop Loss:
• Below $4,190
⸻
5. Fundamental Watch
• Asia typically low volatility, expecting pullback before London drives direction.
• Market still reacting to CPI aftermath and Fed expectations of rate pause.
• DXY holding weak levels helps gold maintain bullish momentum.
• No major Asia news; focus will shift to London session liquidity.
⸻
6. Key Technical Levels
Resistance
• 4,198
• 4,211 (Weak High / Liquidity)
• 4,230
• 4,245
Support
• 4,178
• 4,167
• 4,156
• 4,125
Golden Zone
$4,178 – $4,156
Breakout Triggers
• Bullish: >4,211
• Bearish: <4,150
⸻
7. Analyst Summary
Gold remains bullish after a strong impulsive leg from $4,125. Price is now consolidating under a major liquidity level at $4,211. Asia is likely to retrace into the Golden Zone before continuing higher into $4,230–$4,260.
Only look for sells at the top of the range or on confirmed reversal signals.
⸻
8. Final Bias Summary
📊 Bias: Strongly bullish above $4,167
🔻 Invalidation: Bearish only below $4,150
🎯 Focus: Buy the pullback into Golden Zone for continuation.
⸻
🥇 ElDoradoFx PREMIUM 3.0 – PERFORMANCE 12/11/2025 🥇
📅 Consistent intraday gains + powerful swing continuation.
━━━━━━━━━━━━━━━
🪙 XAU/USD (GOLD) Results
🟢 BUY +20 PIPS
🟢 BUY +30 PIPS
🟢 BUY +40 PIPS
❌ SELL -40 PIPS (SL)
🟢 BUY +210 PIPS
🟢 SELL +15 PIPS
🟢 BUY +210 PIPS
---
📈 SWING TRADE UPDATE (From 05/11)
🟩 Floating Profit: +2,400 PIPS
Swing trend remains intact with strong momentum.
━━━━━━━━━━━━━━━
💰 TOTAL DAILY GAIN: +485 PIPS
📊 7 Trades → 6 Wins (1 SL)
🎯 Accuracy: 86%
━━━━━━━━━━━━━━━
🔥 Another profitable day with clean executions and strong directional confidence.
👏 Congratulations if you profited! ✅✅✅🚀🚀🚀
— ElDoradoFx PREMIUM 3.0 Team 💼📈

Gold: The broader bullish trend remains unchangedGold held the key 4100 level today, indicating that the current market sentiment still leans bullish. This aligns with my proposed strategy of buying on pullbacks. During the U.S. session today, gold's bullish momentum continued to break through, reaching a high around 4211.
For support below, we should focus on the 4145-4150 zone. I have consistently emphasized that the broader trend remains bullish, so it's advisable to avoid trading against the trend. Operationally, prioritize buying on pullbacks.

Gold: Intense long-short rivalry.There has been intense long-short rivalry in gold today, and in the short term, focus should be on the breakthrough of key levels and the effectiveness of support.
Continue to keep a close eye on the 4150-4160 resistance zone above. If it can be successfully broken through, there may be a new upward wave ahead, potentially even moving towards the 4190-4195 range.
For the downside, pay attention to the support around 4080. If the critical support level of 4080 USD is breached, it may trigger follow-up selling, further pushing gold prices down to around 4050.
Overall, in terms of operations, we should patiently wait for entries at key levels and avoid blindly following the trend.
Trading Strategy:
Buy 4090 - 4100
SL 4070
TP 4130 - 4140 - 4150
Sell 4160 - 4165
SL 4170
TP 4120 - 4110 - 4100
Gold
After a strong bullish move, I was expecting a correction.
Now the price has entered the correction phase, and I’m waiting at the marked level on the chart to take a long position if a proper signal appears ✅

XAU/USD: Bullish Climb to 4225?FX:XAUUSD is positioning for a bullish climb on the 1-hour chart , with price respecting an upward trendline as dynamic support, bouncing from a key support zone that could fuel an upside extension toward multiple resistance levels if buyers sustain momentum. This setup offers a strategic entry amid recent volatility, with potential for breakout if volume picks up.
Entry between 4075-4105 (entry possible at current levels with strict risk management). Targets at 4180 (first) and 4225 (second), yielding a risk-reward ratio greater than 1:3 overall .Set a stop loss on a close below 4063 to limit downside exposure. 🌟 Monitor for confirmation via a strong bullish candle above entry with increasing volume, leveraging gold's safe-haven status.
Fundamentally , today's US economic data, including MBA Mortgage Applications at 13:00 UTC and Fed's Waller speech at 16:00 UTC, could sway USD strength and thus gold prices—hawkish Fed tones might cap upside, while softer data supports bulls. Recent analysis notes gold slipping below $4140 on a double top, signaling short-term pullbacks but with rebound potential testing pivotal resistance. 💡
📝 Trade Setup:
🎯 Entry Zone: 4075 – 4105 (entry possible at current levels with strict risk management)
💰 Targets:
1️⃣ 4180 – initial resistance zone
2️⃣ 4225 – secondary target / take-profit zone
❌ Stop Loss: Close below 4063
📈 Risk-to-Reward: Greater than 1:3 overall, depending on execution and scale-out strategy
What's your take on this gold move? Comment below!💡

After hitting resistance level going to target Gold is trading around 4080, showing a strong bullish momentum after bouncing from the support trend line. The price has broken above the previous resistance level, confirming an uptrend continuation. As long as it holds above the 4039 support zone, the bullish bias remains strong. The next potential target is 4153, where price may face some resistance before further upside movement.
