Differentiated Layout under Event-driven and Capital GameThe disparity in expectations of the Federal Reserve's policies becomes prominent: The market currently focuses on the "70.6% probability of rate cut" on the surface data, but overlooks two key details - first, there is only one non-farm employment data left before the Fed's December meeting (released on November 7th), if the new employment figures are lower than 180,000 (current expectation 200,000), the probability of rate cut is expected to jump to over 80% within 3 trading days; second, the "dot plot" of the Fed implies an expectation of 3 rate cuts in 2026, and the current gold price has not priced in the medium- to long-term easing path, and is currently in the "low range before the expectation correction" at this stage.
The divergence in sentiment between retail investors and institutions provides opportunities: The bullish sentiment index of retail investors towards gold has dropped from 68 in October to the current 52 (neutral range), reflecting the fear of "integer thresholds" among retail investors; but institutions are quietly increasing their holdings - the largest global gold ETF (SPDR) added 1.8 tons on November 6th, with its holdings rising to 912 tons, a 3-month high, the "divergent pattern of retail investors' fear of heights + institutions' bottom-fishing" provides an emotional safety cushion for the current stage of long-term positioning.
The "pseudo-strength and real weakness" of the US Dollar Index supports gold: The US Dollar Index is currently maintained at around 100.2, but "the strengthening of the US dollar" is more dependent on the weakening of the euro and the pound (the inflation in the Eurozone fell unexpectedly), rather than the strong economic fundamentals of the United States; the US ISM manufacturing PMI in October is still below the critical line (49.8), the core PCE price index year-on-year 2.9% has declined but is above the target, the "safety margin" of US dollar assets has decreased, and gold as a "non-dollar safe-haven asset" has an increased attractiveness.
Today's gold trading strategy
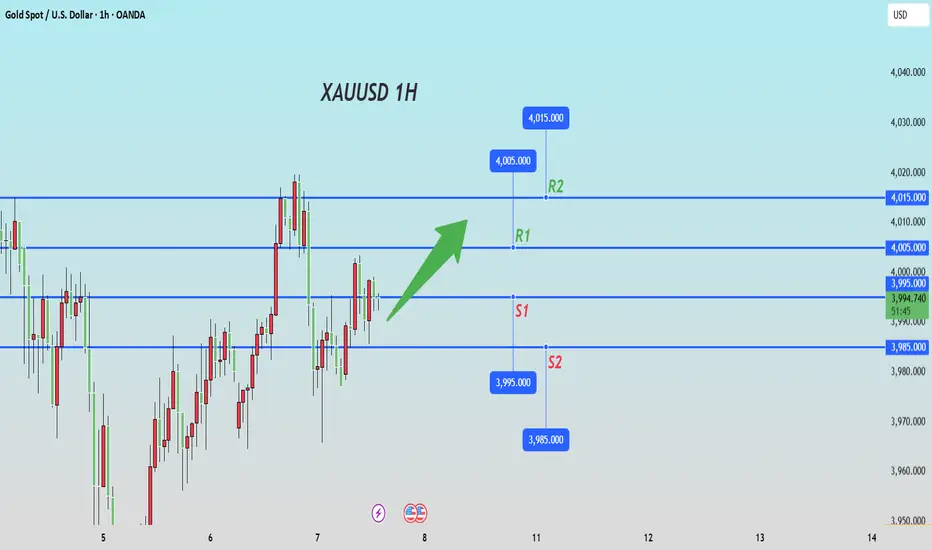
buy:3985-3995
tp:4005-4015
sl:3975
Xauusdbuy
Today's gold trading strategyCurrently, the gold price has entered a critical layout window of "confirmation of breakthrough + acceleration of trend". The technical breakthrough pattern, the expectation of interest rate cut from the policy side, and the incremental intervention from the capital side form a triple resonance. As this price level serves as a dividing line between the bulls and the bears, the downward correction space is limited, while there is a trend-based profit potential after breaking through the integer level. The core operation lies in "relying on the layered support to build positions, following the breakthrough to expand profits, and respecting false breakthroughs while strictly controlling risks": prioritize seizing the support opportunities for the pullback from 3975-3980 USD, quickly establishing trial-and-error positions and some core positions; if the price directly breaks through the integer level of 4000 USD, be cautious and follow up to avoid overtrading; when the price deeply retraces to around 3960 USD, decisively increase the core positions to expand profits.
In the short term, if it can hold above 4000 USD, the gold price is expected to rebound rapidly to 4019.36 USD or even 4050 USD; even if there is a secondary correction, the strong support in the 3960-3970 USD range provides sufficient safety margin for the long position. In the medium and long term, the major logic of global central banks' and the start of the Fed's easing cycle remains unchanged. The breakthrough near 3980 USD can be regarded as an acceleration signal for the long-term upward trend. It is recommended to follow the principle of "buy low and avoid chasing high, stop-loss without holding positions" to flexibly seize the long position opportunities after this breakthrough, while closely tracking the US non-farm payrolls, inflation data, and Fed policy signals, and dynamically adjusting positions and stop-losses.
Today's gold trading strategy
buy:3965-3975
tp:3985-3995
sl:3950

XAUUSD: The resistance level at 4020 remains strongGold has attempted to break through the 4020 resistance level several times today but failed. Coupled with the fact that the U.S. initial jobless claims data has not yet been released, it has now re-entered a correction phase.
The resistance level at 4020 remains strong.
For support, the short-term level is still at 3960-3970,and the key previous low support at 3888-3890.
The trading strategy can still refer to our analysis from this morning.

LONG ON GOLD XAU/USDGold has swept sell side liquidity and has given us a choc (change or character) to the upside.
There is tons of buyside liquidity to the upside with huge FVG's (Fair value gaps) and equal highs (double top) that need to be mitigated.
I am buying gold looking to catch over 200-300 points.
That's 2000-3000 pips.

ANFIBO | XAUUSD - Stuck in Sideway channel [11.6.2025]Hi guys, Anfibo's here!
XAUUSD Analysis – Daily Trading Plan
Overall Picture:
At present, OANDA:XAUUSD is moving sideways within a well-defined H1 channel, showing signs of short-term consolidation after recent volatility. The market is currently lacking a clear directional bias, as both buyers and sellers are testing the upper and lower bounds of this intraday structure. Such conditions often favor range-trading strategies, where precision and timing become crucial for capturing short bursts of momentum.
In this context, our plan today remains straightforward and tactical — trade directly off the trendlines of the channel. In other words, we will look to buy at the lower boundary of the range and sell near the upper boundary, while also being prepared to switch positions if a breakout occurs in either direction.
Trading Plan for Today:
>>> SELL ZONE:
(1) ENTRY: 4015 - 4025
SL: 4030
TP: 4050
(2) ENTRY: 4060 - 4080
SL: 4090
TP: 4000 - 3955
Risk Management:
- Stick to small-to-medium positions within the range; increase size only on confirmed breakouts.
- Keep stops tight, as sideways phases tend to trigger false signals.
- Maintain Risk:Reward ≥ 1:2 and avoid overtrading in choppy conditions.
- Reassess bias once the H1 channel is clearly broken.
Conclusion:
Gold is currently in a sideways consolidation phase within its H1 channel, awaiting fresh catalysts to determine direction. Until a decisive breakout occurs, the most effective approach is range trading — buying near support, selling near resistance, and reacting dynamically to any confirmed breakout.
The plan today is simple yet strategic:
Patience and discipline will be key to capitalizing on this quiet yet potentially explosive setup.
HAVE A NICE DAY, GUYS!

XAUUSD- Bullish setupGold is showing early signs of a bullish reversal after finding support around the lower green band and reclaiming the short-term trend zone. Price has broken above the descending structure with increasing momentum, suggesting potential continuation to the upside.
Bullish Confluences:
Bounce from lower volatility band support (oversold zone).
Break above local trend resistance and EMA ribbon.
Higher lows forming, showing renewed buying pressure.
🎯 Fibonacci Targets:
TP1: 38.2% – $4,049
TP2: 61.8% – $4,075
TP3: 100% – $4,117
As long as price holds above the recent breakout zone (~$3,995–$4,000), bulls remain in control. A clean move through the golden zone could confirm continuation toward higher targets.

XAUUSD LONG SETUP INTRADAY ( NOV 06, 2025 )If you have doubt on our trades you can test in demo.
OANDA:XAUUSD LONG SETUP
EP: 3993.469
TP: 4017.410
SL: 3981.518
Trade Ideas:
Idea is clearly shown on chart + we have some secret psychologies and tools behind this.
Trade Signal:
I provide trade signals here so follow my account and you can check my previous analysis. So don't miss trade opportunity so follow must.

Today's gold trading strategyKey turning point breakthrough confirmed, technical pattern opens up the main upward space
The London gold price has firmly held at the 4000 US dollar integer level today. The current price is 4009.86 US dollars, having rebounded by over 45 US dollars from the intraday low of 3964.42 US dollars, forming a strong structure of "breakthrough + retracement + further advance". Three technical signals confirm the trend
① After breaking through the upper edge of the previous oscillation platform (3990 US dollars), the trading volume has increased by 78% compared to the previous period, and the proportion of active buying orders has risen to 65%, indicating strong fund support
② The MACD indicator on the daily chart remains in a golden cross, the red bar continues to expand, and the price has stabilized above the 5-day, 10-day, and 20-day moving averages, forming a "bullish arrangement" pattern
③ From the Fibonacci extension levels, after breaking through 4000 US dollars, the next target is directly at 4050 US dollars (1.618 extension level). Historical data shows that after the gold breaks through a key integer level, the probability of continuing to rise within 24 hours is 89%
Today's gold trading strategy
buy:4000-4010
tp:4020-4030
sl:3990

GoldXAUUSD
- Symmetrical Triangle as an corrective pattern in Short Time Frame
- Break of Structure
- Order Block
- Change of Characteristics
- RSI - Divergence

Gold: Support at 4006–3994, Resistance Near 4030Yesterday, gold broke above the 30-minute MA60 resistance and then pulled back to retest the level, successfully turning it into support. After confirming the support, price continued to grind higher today, reaching around 4020. The MA60 remains the core support for this upward structure. Unless the market enters a strong one-way rally, a pullback is likely, with the MA20/MA30 serving as secondary support levels during the process.
On the 4-hour chart, price is currently testing the MA60 resistance while moving averages still maintain a bullish alignment. If price can successfully complete a resistance-to-support shift around the 4006-3994 zone on the 4H timeframe, it may open the door for a move toward the 4080-4100 resistance region. The first key resistance sits near 4030. Therefore, if price pulls back after testing 4030 but holds above the 4006-3994 support zone, it will retain potential to test 4050/4080-4100 area.

We firmly go long when the market is blindly shorting.#XAUUSD OANDA:XAUUSD TVC:GOLD
From the hourly chart, the short-term gold price has broken through the resistance of the triangle pattern boundary. The market has made its choice, and it is clear that we bulls have won. Therefore, we can continue to execute our trading strategy for the next step. Wait for a pullback to 3995-3985 to buy again, with an initial target of 4020-4030.

ElDoradoFx – GOLD ANALYSIS (06/11/2025, LONDON SESSION)
1️⃣ Market Overview
Gold extends its bullish move into the London session after breaking above $3,995–$4,000, confirming short-term momentum shift from consolidation to continuation.
The metal currently trades near $4,005, where sellers are reacting at a key H1 supply zone aligned with a descending trendline from previous highs.
Overall sentiment remains cautiously bullish, with potential pullbacks expected before continuation toward $4,026–$4,046.
⸻
2️⃣ Technical Breakdown
📆 D1 (Daily):
Price sustains above the 100EMA and remains in an ongoing bullish recovery phase.
RSI ≈ 52, showing neutral-to-bullish structure. A confirmed daily close above $4,012 would strengthen the path to $4,026–$4,046 next.
⏰ H1 (Hourly):
Strong breakout candle above $3,995 with MACD turning positive.
Current resistance seen around $4,010–$4,015. RSI near 68 signals slight overextension, hinting that a minor pullback could occur before another push upward.
🕒 15M–5M (Intraday):
Price broke through descending structure and is now forming rejections near $4,010.
Short-term support sits between $3,985–$3,975, coinciding with EMAs and structure demand.
Expect a possible retest of this area for continuation if buyers remain in control.
⸻
3️⃣ Fibonacci Analysis (Last swing $3,960 → $4,010)
• 38.2% = $3,990
• 50.0% = $3,985
• 61.8% = $3,979
🎯 Golden Zone: $3,990 – $3,979 → Potential bullish continuation area.
⸻
4️⃣ Fundamental Watch
• The US Dollar Index (DXY) is holding below 106, favoring gold’s strength.
• US Jobless Claims and Fed speeches later today may inject volatility during the NY session.
• London is likely to trade inside the $3,985–$4,010 band until new catalysts emerge.
⸻
5️⃣ Analyst Summary
Gold maintains an intraday bullish bias while trading above $3,975.
The ideal scenario is a pullback toward $3,990–$3,979 (Golden Zone) before the next impulsive move up.
A sustained break above $4,015 would confirm fresh momentum targeting $4,026 → $4,046, while failure to hold above $3,975 could shift bias back toward $3,960.
⸻
6️⃣ Final Bias Summary
📈 Primary Bias: Bullish continuation above $3,975
📉 Bearish Invalidity: Below $3,970
🎯 Upside Targets: $4,026 → $4,046 → $4,075
⚠️ Key Zone to Watch: $3,990 – $3,979 (Golden Zone retest area)
⸻
— ElDoradoFx PREMIUM 3.0 Team 🚀

XAUUSD LONG-2 HIGH ACCURACY ( NOV 05, 2025 )If you have doubt on our trades you can test in demo.
OANDA:XAUUSD LONG
TP: 3987.065
SL: 3951.327
Trade Ideas:
Idea is clearly shown on chart + we have some secret psychologies and tools behind this.
Trade Signal:
I provide trade signals here so follow my account and you can check my previous analysis. So don't miss trade opportunity so follow must.

XAUUSD - Time to buy...XAUUSD was in a short term downtrend for a few weeks but has now shown some clear bullish movements ahead. XAUUSD (Gold) has broken out of a downward trend channel that was acting as strong resistance, The price is very likely to head to the next resistance level which is market as the take profit zone (green line). Time to buy!

technical analysis of your XAU/USD (Gold) chartTimeframe: 15-Minute Chart
Current Price: $3,977
🔍 Chart Overview
The chart shows a downward channel (yellow lines) that Gold has recently broken to the upside, indicating potential bullish momentum.
There’s a support zone around $3,955 – $3,965, labeled as “SUPPORT LEVEL”.
A short-term corrective move is expected before the next upward push.
📊 Key Levels
Support Zone: $3,955 – $3,965
Immediate Resistance: $3,985 – $3,990
Major Target (Resistance): $4,031
🧭 Price Projection
After testing or retesting the support level, price is expected to bounce upward toward the $4,031 target.
The purple projection curve indicates a potential retracement followed by a bullish continuation.
💡 Trading Bias
Short-Term: Bullish above $3,960
Invalidation: Break below $3,950 could signal renewed bearish pressure.
LME:CA1! LME:MC1! LME:NI1! LME:SC1! LME:LH1! LME:AH1! LME:CO1! LME:CB1! LME:HC1! LME:AA1! LME:EA1! LME:HN1! LME:MD1!
Target: $4,031 (upside target based on resistance and breakout structure).
⚠️ Summary
Gold shows a reversal from a descending channel, now forming a support base near $3,960. If the price sustains above this zone, buyers may push it toward $4,031 in the short term.

Gold Bearish Continuation After Range BreakdownThe chart shows that gold (XAUUSD) recently broke down from a clear consolidation range highlighted by the red rectangle. This range acted as a distribution zone where price repeatedly failed to break higher. Once the lower boundary of that range broke, sellers gained momentum, pushing price downward.
Price has now pulled back toward the broken structure, forming a corrective bullish move — likely a retracement before further downside. The projection on the chart suggests a lower-high formation followed by continuation to the downside.
Key observations:
Breakdown from consolidation: The range around 3960–4000 was rejected multiple times, confirming strong resistance.
Pullback to structure: Current bullish candles appear corrective, not impulsive.
Bearish projection: The chart shows expected continuation toward levels around 3929, 3900, and potentially lower.
Stop-loss area: The SL is clearly marked at 4000.234, above the former resistance zone.

XAUUSD LONG SETUP INTRADAY ( NOV 05, 2025 )If you have doubt on our trades you can test in demo.
OANDA:XAUUSD LONG SETUP
EP: 3966.253
TP: 3990.121
SL: 3954.296
Trade Ideas:
Idea is clearly shown on chart + we have some secret psychologies and tools behind this.
Trade Signal:
I provide trade signals here so follow my account and you can check my previous analysis. So don't miss trade opportunity so follow must.

XAUUSD LONG SETUP 1:2 RR ( NOV 05, 2025 )If you have doubt on our trades you can test in demo.
OANDA:XAUUSD NEW LONG SETUP
EP: 3972.539
TP: 3996.226
SL: 3960.454
Trade Ideas:
Idea is clearly shown on chart + we have some secret psychologies and tools behind this.
Trade Signal:
I provide trade signals here so follow my account and you can check my previous analysis. So don't miss trade opportunity so follow must.

Gold Bearish Continuation After Range BreakdownThe chart shows that gold (XAUUSD) recently broke down from a clear consolidation range highlighted by the red rectangle. This range acted as a distribution zone where price repeatedly failed to break higher. Once the lower boundary of that range broke, sellers gained momentum, pushing price downward.
Price has now pulled back toward the broken structure, forming a corrective bullish move — likely a retracement before further downside. The projection on the chart suggests a lower-high formation followed by continuation to the downside.
Key observations:
Breakdown from consolidation: The range around 3960–4000 was rejected multiple times, confirming strong resistance.
Pullback to structure: Current bullish candles appear corrective, not impulsive.
Bearish projection: The chart shows expected continuation toward levels around 3929, 3900, and potentially lower.
Stop-loss area: The SL is clearly marked at 4000.234, above the former resistance zone.

ANFIBO | XAUUSD - Sideway Channel H1 [10.29.2025]Hi traders, Anfibo's here!
XAUUSD Analysis – Daily Trading Plan
Overall Picture:
At present, OANDA:XAUUSD is moving sideways within a well-defined H1 channel, showing signs of short-term consolidation after recent volatility. The market is currently lacking a clear directional bias, as both buyers and sellers are testing the upper and lower bounds of this intraday structure. Such conditions often favor range-trading strategies, where precision and timing become crucial for capturing short bursts of momentum.
In this context, our plan today remains straightforward and tactical — trade directly off the trendlines of the channel. In other words, we will look to buy at the lower boundary of the range and sell near the upper boundary, while also being prepared to switch positions if a breakout occurs in either direction.
Trading Plan for Today:
>>> SELL ZONE:
ENTRY: 4060 - 4080
SL: 4090
TP: 4000 - 3955
>>> BUY ZONE:
ENTRY: 3940 - 3950
SL: 3930
TP: 4000 - 4045 - 4070
Risk Management:
- Stick to small-to-medium positions within the range; increase size only on confirmed breakouts.
- Keep stops tight, as sideways phases tend to trigger false signals.
- Maintain Risk:Reward ≥ 1:2 and avoid overtrading in choppy conditions.
- Reassess bias once the H1 channel is clearly broken.
Conclusion:
Gold is currently in a sideways consolidation phase within its H1 channel, awaiting fresh catalysts to determine direction. Until a decisive breakout occurs, the most effective approach is range trading — buying near support, selling near resistance, and reacting dynamically to any confirmed breakout.
The plan today is simple yet strategic:
“Buy at the trendline, sell at the trendline — and flip when the channel breaks.”
Patience and discipline will be key to capitalizing on this quiet yet potentially explosive setup.
GOODLUCK GUYS!

Gold Price Outlook – Trade Setup (XAU/USD)📊 Technical Structure
OANDA:XAUUSD Gold (XAU/USD) rebounded from the Support Zone ($3,929–$3,938), aligning with the ascending trendline drawn from late October lows. The price is attempting to recover toward the Resistance Zone ($3,985–$3,994) but remains within a broader corrective structure.
The bullish momentum looks corrective rather than impulsive, suggesting that unless gold breaks above $3,995 convincingly, sellers may re-emerge near resistance. The rising trendline remains a short-term guide; holding above $3,940 keeps the rebound bias valid.
🎯 Trade Setup
Entry: $3,929 – $3,938
Stop Loss: $3,925
Take Profit 1: $3,985
Take Profit 2: $3,994
Risk-Reward Ratio: ≈ 1 : 4.95
🌐 Macro Background
Gold is stabilizing near $3,950 after a sharp 1.8% sell-off on Tuesday, following renewed USD strength. As FXStreet’s Dhwani Mehta notes, “Gold is licking its wounds near $3,950... but downside risks remain intact ahead of U.S. data.” 【FXStreet】
USD Dynamics: The Dollar entered a bullish consolidation phase after the risk-off rally, with traders reducing bets on further Fed cuts this year. The CME FedWatch Tool shows less than a 70% chance of a December rate reduction.
Market Sentiment: The global tech-led equity sell-off drove risk aversion, causing investors to cover equity losses by selling gold positions.
Upcoming Data: Traders now focus on U.S. ADP employment and ISM Services PMI, both of which could reshape expectations for Fed policy. Strong readings could strengthen the USD and weigh on gold; weak figures might lift gold on renewed rate-cut bets.
Overall, gold’s short-term recovery remains fragile. A rebound toward $3,985–$3,995 could face resistance unless U.S. data disappoints.
🔑 Key Technical Levels
Resistance: $3,985 – $3,994
Support: $3,929 – $3,938
Trendline Support: $3,940
Psychological Level: $3,950
📌 Trade Summary
Gold (XAU/USD) is showing a corrective bounce after finding support near $3,930. While the setup allows for a short-term long trade toward $3,985–$3,994, traders should remain cautious as the broader sentiment stays bearish. A break below $3,925 would invalidate the rebound and reopen the path toward $3,900.
⚠️ Disclaimer
This analysis is for reference only and does not constitute trading advice. Trading involves significant risk, and proper risk management is essential.

XAUUSD (Gold) 3H Analysis & SMT Divergence with XAGUSD🪙 XAUUSD (Gold) 3H Analysis & SMT Divergence with XAGUSD 🕵️♂️
The 3-hour chart for XAUUSD shows a strong bearish expansion, creating a potential opportunity at the current lows.
Current XAUUSD Price: Trading around $3,936.55.
Key High (CRTH): The high at approximately $3,979.27 is the primary "Buy Side Liquidity" zone. A push above this would invalidate the current bearish structure.
Key Low (CRTL): The low at $3,931.01 is the current "Sell Side Liquidity" target.
SMT Divergence Alert (XAUUSD vs. XAGUSD)
We are observing a potential Smart Money Technique (SMT) Divergence at these lows:
XAUUSD (Gold): Has successfully taken out the recent internal low (sweeping liquidity at $3,931.01 or below).
XAGUSD (Silver): Silver appears NOT to have made a lower low, or has only made a shallow sweep, compared to Gold.
This bullish SMT divergence suggests that the overall pressure on the precious metals sector might be weakening, and Gold's latest dip could be a liquidity grab (Liquidity Sweep) before a strong move up.
Scenario Watch (SMT-Driven):
Bullish Reversal: A sharp volume-driven rejection of the current low, confirming the SMT. Price would likely reclaim the internal structure and aim for the CRTH at $3,979.27 as a primary target.
Bearish Continuation (SMT Failure): If XAGUSD now follows XAUUSD and makes a sharp lower low, the SMT would fail. Both metals would then likely push lower toward key support near $3,917.50 for Gold and its corresponding low for Silver.
What is Silver showing on its low, and does this SMT confirm a potential accumulation phase for XAUUSD?
Greetings,
MrYounity

Gold: Focus on Selling, Watch Resistance at 3960–3975Gold bounced after pulling back to the 3948–3921 support zone yesterday, but was capped by the 4H MA5 and fell back toward support again. On the 30-minute chart, the price action currently shows signs of a potential rebound, with the MA60 serving as the key upside resistance in today's session.
As mentioned during yesterday’s live updates, if the 3948–3921 support area breaks, the next major level to watch will be the 3800 psychological mark along with support from the daily MA60. At that stage, trading strategies should be adjusted based on real-time market behavior and sentiment.
Overall, the short-term bias remains bearish, favoring trend-following sell setups. For medium- to longer-term traders, gradual long positioning can be considered. However, volatility remains elevated in this phase, so risk control is essential—manage position size carefully and avoid emotional trading.
