Gold Trade Set Up Nov 26 2025Price pushed higher in Asia but engulfed to the downside in London so now i will be waiting for either a 15m engulfing/CISD to the upside to target BSL or a push lower to lower SSL
Xauusdforecast

gold needs await breakout#XAUUSD price is still bullish but we await for rejection below 4130 or above the 4167 on H1 closure. Now we sell on little retrace.
Below the rectangle 4150-4147 2 times breakout, target 4130, SL 4160.
Below 4130 holds reverse on buy which can maintain bullish retracement, then if possible the H1 close above 4167 then next target is 4182 which holds strong selling rejection.

XAUUSD – Major H1 Supply Zone Rejection & Potential Drop Setup📉 Chart Analysis (H1 – Gold / XAUUSD)
1. Price at Strong Supply / Sell Zone
The red zone you highlighted represents a major H1 supply area, where price previously rejected.
Multiple wicks indicate selling pressure, showing buyers are weakening.
2. Current Price Reaction
Price is consolidating just below the supply zone.
This typically suggests liquidity building before a potential sell-off.
3. Bearish Confluence
The arrows show your anticipated movement:
retest → rejection → drop.
Structure supports this idea:
Lower highs forming near resistance.
Buyers failing to break above the supply area.
4. Downside Target
The green line represents the next significant support level, likely a demand zone.
This is a logical TP1 area for sellers.
5. Trade Idea Summary
Bias: Bearish from supply zone.
Entry: Sell on rejection inside red zone.
TP: Green support area.
SL: Above the supply zone wick.

XAUUSD - buy gold...XAUUSD was recently in a short term downtrend for a few weeks but has now shown some clear bullish movements ahead. XAUUSD (Gold) has broken out of a downward trend channel that was acting as strong resistance, The price is very likely to head to the next strong resistance level which is marked as the take profit zone (green line). Time to buy GOLD!

XAU/USD 26 November 2025 Intraday AnalysisH4 Analysis:
-> Swing: Bullish.
-> Internal: Bullish.
Analysis and bias remains the same as analysis dated 20 October 2025.
Price has printed as per previous intraday expectation by printing a bearish CHoCH which indicates, but not confirms, bullish pullback phase initiation.
Price is currently trading within an established internal range, however, I will continue to monitor price with regards to depth of pullback.
Intraday expectation:
Price to continue bearish, react at either discount of 50% internal EQ, or H4 supply zone before targeting weak internal high priced at 4,380.990.
Note:
The Federal Reserve’s sustained dovish stance, coupled with ongoing geopolitical uncertainties, is likely to prolong heightened volatility in the gold market. Given this elevated risk environment, traders should exercise caution and recalibrate risk management strategies to navigate potential price fluctuations effectively.
Additionally, gold pricing remains sensitive to broader macroeconomic developments, including policy decisions under President Trump. Shifts in geopolitical strategy and economic directives could further amplify uncertainty, contributing to market repricing dynamics.
H4 Chart:
M15 Analysis:
-> Swing: Bullish.
-> Internal: Bullish.
As per analysis dated 14 November 2025, price has printed a bearish CHoCH to indicate, but not confirm bearish pullback phase initiation.
Price is currently trading within an established internal range.
Intraday expectation:
Price to trade down to either discount of 50% internal EQ, or M15 demand zone before targeting weak internal high, priced at 4,245.195
Note:
Gold remains highly volatile amid the Federal Reserve's continued dovish stance, persistent and escalating geopolitical uncertainties. Traders should implement robust risk management strategies and remain vigilant, as price swings may become more pronounced in this elevated volatility environment.
Additionally, President Trump’s tariff announcements, particularly against China, are expected to further amplify market turbulence, potentially triggering sharp price fluctuations and whipsaws.
M15 Chart:

Gold Attempts to Hold Above $4,000 per OunceOver the past five trading sessions, XAU/USD has maintained a gain of more than 1.4%, as the precious metal has temporarily regained confidence following a more moderate tone from the Federal Reserve regarding interest rates. The U.S. bond market has not seen significant increases in yields in recent sessions, which has allowed gold—often viewed as a natural substitute for bonds—to recover some short-term demand. If the price manages to hold above the $4,000 zone, buying pressure could once again become dominant in the coming sessions.
Uptrend Remains Intact
Since late August, gold has maintained a solid upward trendline, and despite recent pullbacks, the bullish bias continues to prevail in the short term. There is still no meaningful selling pressure capable of breaking this trendline, making it the key technical structure to monitor in the coming sessions, especially if the price stays above the 50-period moving average.
RSI
The RSI line continues to oscillate around the 50 level, indicating the emergence of a neutral bias and reflecting balanced momentum across the last 14 sessions. As long as this pattern continues, indecision is likely to remain present in gold’s short-term price behavior.
MACD
The MACD histogram is also oscillating around the neutral zero line, reinforcing a scenario of technical neutrality in the short-term moving averages. If this continues, a short-term consolidation range could begin to take shape.
Key Levels to Watch
$4,300 – Major Resistance: This level corresponds to the chart’s highs. A move back toward this zone could reactivate a strong bullish bias and reinforce the current upward trend, allowing buying pressure to regain dominance.
$4,140 – Immediate Barrier: This level aligns with recent retracements and the 23.6% Fibonacci level. If the price continues oscillating around this zone, a short-term range may form due to the recent lack of directional strength.
$3,920 – Key Support: The most relevant short-term support, located just below the 50-period moving average and the 38.2% Fibonacci level. A breakdown below this zone could endanger the current uptrend and give way to a more dominant bearish bias.
Written by Julian Pineda, CFA, CMT – Market Analyst

Gold Trade Set Up Nov 25 2025Gold remains bullish on the 4h making HH/HL and has already swept SSL in London session followed by a 1h engulfing candle so i will be looking for internal bullish structure on the 5m-15m to take buys to higher BSL levels

XAUUSD – Bearish Reversal Setup Toward Liquidity TargetsChart Analysis
Your chart shows a potential bearish reversal on XAUUSD with a clear smart-money structure. Here’s the breakdown:
1. Market Structure
Multiple Breaks of Structure (BOS) and Change of Character (ChoCH) indicate a shift from bullish momentum to bearish intent.
Price made a final sweep / liquidity grab at the recent high before sharply dropping into your marked entry zone.
2. Entry Zone
The “ENTRY” mark aligns with:
A bearish mitigation zone from the last up-move
A distribution pattern forming (rounded top + BOS)
This suggests institutional selling activity.
3. Target One – 4,080.064
This level is a logical first target because:
It aligns with previous demand acting as newly created liquidity.
You expect a corrective pullback before continuation—your white zig-zag path reflects this.
4. Target Two – 4,040.652
A deeper liquidity pool and the next major imbalance area.
If price breaks Target One, momentum likely accelerates.
This is the main downside liquidity sweep zone.
5. Context
The shaded half-circle structures highlight swing points where price formed lower highs, reinforcing the bearish narrative.
The clean equal-lows and imbalances under price give strong bearish draw-on-liquidity.

XAU/USD Intraday Plan | Gold Breaks Out — Can Buyers Hold?Gold broke out of the consolidation range yesterday, finally pushing above the 4098 level and extending into the 4142 resistance zone.
Price is now sitting above both the MA50 and MA200 — a constructive sign — but both moving averages remain flat, showing that momentum has not fully shifted yet.
If buyers want to build on this breakout, they need a clean hold above 4142. A confirmed break here would open the path toward 4198 → 4232.
If gold fails to clear 4142, we could see a pullback. First support sits at 4098, followed by 4052.
A deeper correction would bring us back into the Support Zone (4016–3968), with the HTF Support Zone (3921–3862) acting as the major safety net.
📌Key levels to watch:
Resistance:
4142
4198
4232
Support:
4098
4052
4016
3968
3921
3862
📰 Fundamental Focus:
Today brings the first batch of high-impact U.S. data for the week, including Core PPI, PPI, and Retail Sales — all key indicators of inflation and consumer strength. Traders should be prepared for sharper moves as the market reacts to inflation and consumer-spending data.

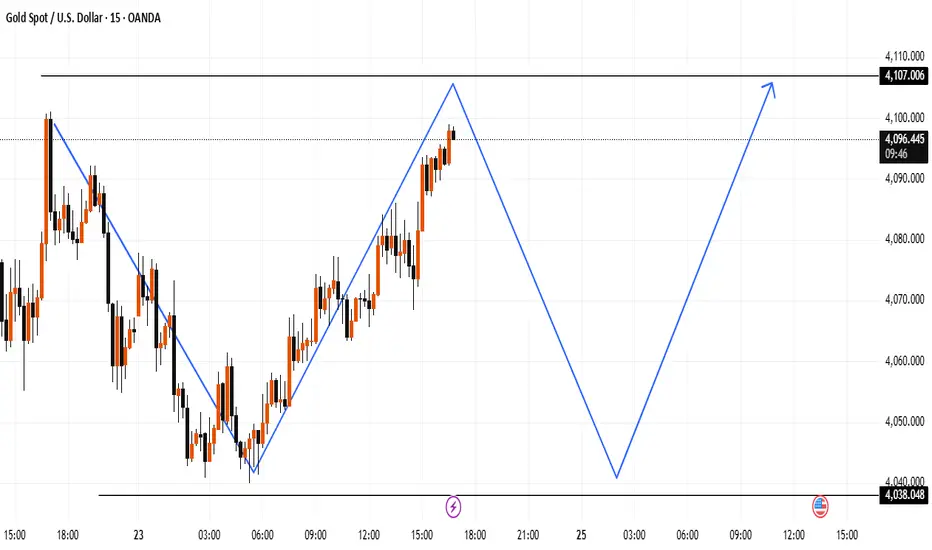
XAUUSD – Potential Reversal Zone and Structural ProjectionThis chart highlights a possible short-term completion of the current upward leg, followed by a deeper corrective move toward the lower support zone near 4038, before a potential bullish continuation toward the 4107 area.
The projection is based on simple market structure:
Price has reached a previous reaction zone.
A corrective wave may form if rejection appears.
A new impulse could develop from the lower support level.
Gold Asia Session Set Up Nov 24 2025Price has shifted into bullish structure on the 4h and 1h making new HH so i will be taking buys targeting the next BSL level at 4211

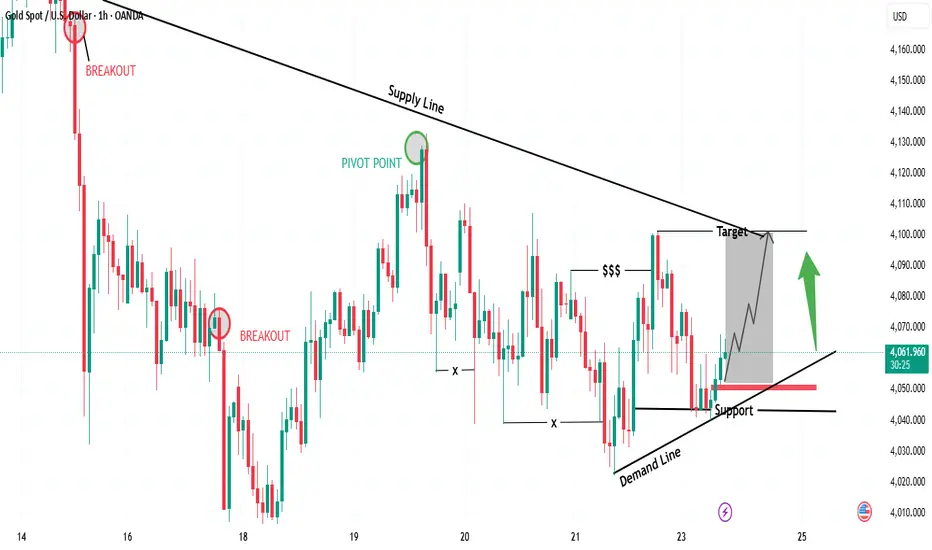
“Gold Rebounding from Demand – Targeting Supply Line Retest🔍 Key Observations
📉 Supply Line (Downtrend Resistance)
Each rally is being capped by the descending supply line
📈 Demand Line (Ascending Support)
Buyers defending higher lows
Strong bullish reaction off support
💰 Liquidity Grab ($$$)
Liquidity was taken below swing lows — bullish signal
Smart money likely securing positions before pushing up
🟢 Bullish Confirmation
If price holds above demand line + support zone
Expect bullish continuation toward supply line retest
🎯 Suitable Target Levels
Target Level (Approx) Status
🥇 First Target 4,095 – 4,105 At supply line retest
🥈 Extended Target 4,120 – 4,130 Breakout continuation
📌 Trade Idea (Bullish Scenario)
Entry Zone: 4,055 – 4,065 🟩
Stop Loss: Below 4,025 ❌
Take Profit 1: 4,100 🎯
Take Profit 2: 4,125 🚀
RR Ratio: 1:2.5 – 1:3 📈
🧭 Market Sentiment
📍 Bias → Short-term Bullish
🛑 But… sellers may reappear at supply line
⚠️ Watch for fakeouts near the target
goldawaitbreakout#XAUUSD we await price for breakout above the 4077 to buy, above 4087-89 holds confirmation on buy once M15-H1 close above.
Buy limit 4077, target 4095-4109, SL 4065.
Below 4063 holds strong bearish continuation which will target 4031.

Gold Trade Set Up Nov 24 2025Price is in a 4h range but internally making HH/HL and swept SSL in Asia and engulfed in London so am expecting price to sweep internal 5m-15m SSL before continuing its bullish push to PDH and higher BSL

Gold Setup Is TOO CLEAN to Ignore — Bulls in Control!In my view, Gold currently presents one of the cleanest technical structures across the entire market. Ideally, I would like to see a downside manipulation first, followed by a continuation move toward the 4110 area to sweep internal buy-side liquidity. Only after that, a potential retracement toward the 3900 zone becomes reasonable. Any bearish movement that occurs without first taking buy-side liquidity does not align with my plan, and in that case, I will not consider opening any short positions.
Like and follow if you wanna see more analysis like this!
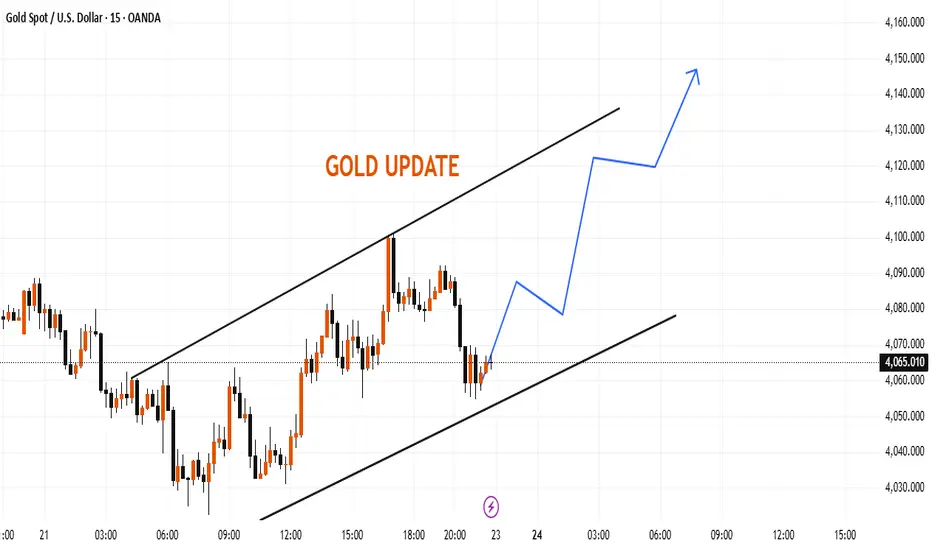
Gold Intraday Channel UpdateGold is currently moving within an ascending channel, with price reacting around the mid-range of the structure. The lower boundary of the channel is acting as a dynamic support zone, while the upper boundary remains the next reaction area to watch.
If price maintains stability above the lower trendline, the structure suggests space toward the upper channel region around the recent intraday highs. The chart highlights how price has been respecting both channel boundaries throughout the session.
This update focuses on the current market structure and key levels visible within the channel.
GoldXAUUSD
- Change of Characteristics
- Order Block
- Symmetrical Triangle as an corrective pattern in Short Time Frame
- Fair Value Gap
- Completed " 12345 " Impulsive Waves and " AB " Corrective Waves

XAUUSD – Potential Distribution Phase Signaling Deeper Bearish TAnalysis of the Chart
Your chart shows a full market cycle structure based on Wyckoff + Smart Money Concepts (SMC). Here’s a clean breakdown:
1️⃣ Previous Accumulation Phase (Left Side)
Multiple BOS (Break of Structure) labels confirming bullish intent.
CHoCH followed by accumulation zones.
Price gradually builds liquidity (SSL / price points).
Strong bullish impulsive leg begins after accumulation.
2️⃣ Strong Bullish Trend Continuation
Successive BOS levels show continuation of bullish strength.
Several mitigation blocks / filled imbalances visible.
Price aggressively pushes toward the premium ceiling zone.
3️⃣ Entry Into Distribution Phase (Top Right)
Market reaches Premium Ceiling Zone.
Signs of exhaustion appear:
Lower high formations
Reversal zone highlighted
Shift in character from expansion → distribution
4️⃣ Bearish Reversal Structure Forming
The chart shows:
A potential descending structure
Expectation of liquidity sweeps followed by deeper decline
First bearish target (Target One) around 3,902
Second bearish target (Target Two) around 3,700
These levels align with prior imbalances and discount pricing.
5️⃣ Market Psychology According to the Chart
Bulls losing momentum after premium pricing reached
Smart money distributing positions
Expecting a retracement toward major discount areas
Possible sweep of liquidity before continuation downward

Gold (XAU/USD) 2H Chart Analysis – Sell Setup from High ProbabilBased on the chart you provided, Gold is currently reacting near a High Probability POI (supply zone) after a corrective bullish move. The structure still shows:
Lower highs and lower lows → Bearish market structure
Price is approaching a supply zone where sellers previously dominated
Liquidity has been taken above internal highs (marked as "$$$"), indicating a liquidity grab
This supports a short position idea from the supply zone.
🔍 Key Technical Levels
Zone / Level Meaning
4,125 – 4,150 USD High Probability POI / Supply (Sell area)
4,080 – 4,100 USD Entry region (price is currently here)
4,040 – 4,025 USD First reaction / partial take zone (50% area)
3,990 – 4,000 USD Main Target (previous demand + equal lows)
🎯 Suggested Target
Primary Target: $4,000
(Exactly aligning with your chart’s marked “TARGET” zone where liquidity sits)
If momentum continues and structure breaks more aggressively:
Extended Target: $3,975 – $3,960
(deeper sweep into demand)
🛑 Risk Management
Detail Level
Stop Loss Above 4,155 USD (beyond POI + liquidity)
R:R Potential Approx. 1:3 to 1:4
📌 Summary
Price has retraced into a key supply zone
Liquidity was taken → seller confirmation likely
Expectation is continuation downward towards the liquidity pool below
📊 Title Recommendation:
“Gold Retests Supply Zone – Bearish Continuation Toward $4,000 Expected”

XAU/USD Weekly Outlook | Gold Stuck in Consolidation RangeGold ended the week stuck inside a broad consolidation range, trading between 4052 support and 4098 resistance, showing indecision as neither buyers nor sellers have been able to take control.
Both the MA50 and MA200 are flat, reflecting a lack of strong directional momentum — the market is in balance, waiting for a catalyst.
Buyers need a confirmed break and sustained hold above 4098, followed by a break of 4142, to shift momentum. Until then, any upside attempts remain corrective within the range.
Failure to reclaim 4098 increases downside pressure. A drop below 4052 would expose the
4016–3968 Support Zone. If selling momentum extends further, gold could slide into the HTF Support Zone at 3921–3862, which is a major higher-timeframe demand area.
📌 Key levels to watch:
Resistance:
4098
4142
4198
4232
Support:
4052
4016
3968
3921
3862
🔎 Fundamental focus:
This week brings key U.S. data releases such as Core PPI, Retail Sales, Consumer Confidence, and Durable Goods Orders. With gold stuck in a range, any surprise in inflation or consumer strength could spark volatility.

Gold Trade Set Up Nov 21 2025Price has changed to bullish structure in London session with a 1h BOS so i will first want to see a sweep of internal 15m SSL and/or tap into 1h FVG to then look for internal bullish engulfing candle plus CISD on the 15m-5m to target higher BSL/PDH

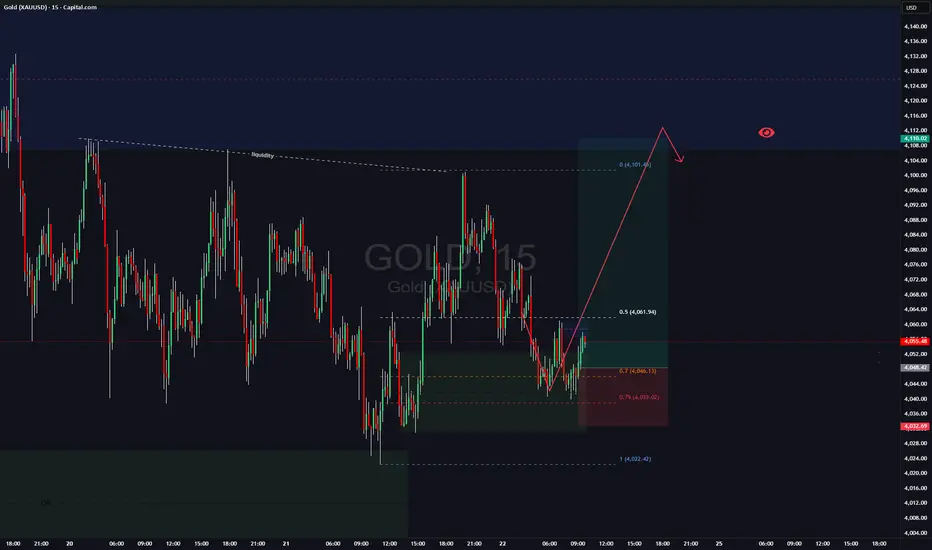
XAUUSD Bullish Retracement Setup from Support Zone Toward Key Re1. Market Structure
Price is currently trading near a major support zone (~4055–4060 area), highlighted in blue.
Multiple rejections from this zone in the past indicate strong buying interest.
The structure shows higher lows forming intraday, suggesting bullish pressure building.
2. Key Zones
🔵 Support Zone (Entry Region)
Marked around 4055–4060.
Price dipped into this zone and bounced, showing a potential demand area for long positions.
🔵 Resistance Level (First Target Region)
Around 4081–4098.
This is the first major resistance the price is likely to test after bouncing.
🔵 Final Target Zone
4120 area, the upper major resistance.
Previous highs around this level show strong selling interest historically.
3. Expected Price Movement
The chart suggests a potential bullish move:
Price bounces from the support (entry) area.
Climbs toward 4081 (minor resistance).
Retraces slightly.
Continues upward toward 4097–4100.
Final push toward 4120 target zone.
This is a classic retracement + continuation bullish structure.
4. Trade Idea
Bias: Bullish
Entry: 4055–4060 (support zone)
First TP: 4081
Second TP: 4097–4100
Final Target: 4120
Stop Loss: Below 4050 (beneath support zone)

GoldXAUUSD
- Change of Characteristics
- Bearish Channel as an corrective pattern in Long Time Frame
- Fibonacci Level - 50.00% / 61.80%
- Bullish Channel in Short Time Frame
- Fair Value Gap
