“BOS Confirmed — Demand Retest for Next Bullish Leg🟡 GOLD (XAU/USD) – Bullish Continuation Setup from High Probability Demand Zone 🆙
🔍 Chart Breakdown & Key Insights
Price created a Break of Structure (BOS) to the upside → confirming bullish momentum ✔️
Retested the Demand Line + Support Zone → buyers defending strongly 💪
High Probability POI (previous accumulation zone) remains valid with liquidity swept below → smart money accumulation evidence 💰
Current pullback = healthy retracement into demand before potential continuation
🎯 Targets (With stickers)
🎯 Target Zone Price Region Sticker
TP1 → Retest recent high 4,165 – 4,175 🎯
TP2 → Liquidity above highs / extended target 4,180 – 4,195 🚀💸
TP1 hit possibility is HIGH due to bullish structure 📈
TP2 depends on strength of breakout ⬆️
📌 Trade Idea (High Probability Setup)
🟩 Buy Entry Zone:
➤ 4,120 – 4,130 (pullback entry at support)
🟢 Take-Profit:
➤ TP1: 4,170 – TP2: 4,190
📊 Risk-Reward Ratio: 1:2.5 – 1:3+ ✔️
🧭 Market Structure Sentiment
Factor Outlook
Trend Bullish 📈
Liquidity Upside still available 💧
Smart Money behavior Accumulation & continuation expected 💼
⚠️ Just watch if price breaks below the demand line → would weaken this bullish plan.
Xauusdforexsignal

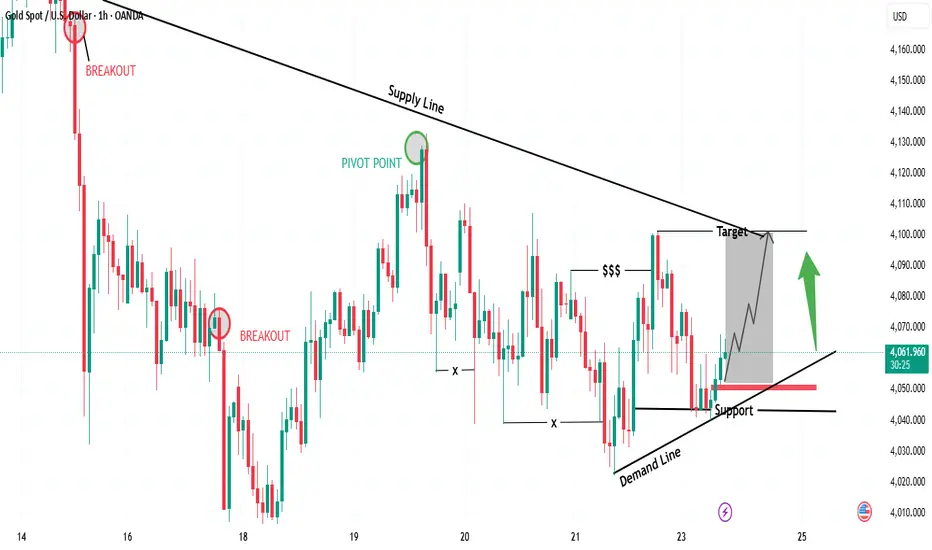
“Gold Rebounding from Demand – Targeting Supply Line Retest🔍 Key Observations
📉 Supply Line (Downtrend Resistance)
Each rally is being capped by the descending supply line
📈 Demand Line (Ascending Support)
Buyers defending higher lows
Strong bullish reaction off support
💰 Liquidity Grab ($$$)
Liquidity was taken below swing lows — bullish signal
Smart money likely securing positions before pushing up
🟢 Bullish Confirmation
If price holds above demand line + support zone
Expect bullish continuation toward supply line retest
🎯 Suitable Target Levels
Target Level (Approx) Status
🥇 First Target 4,095 – 4,105 At supply line retest
🥈 Extended Target 4,120 – 4,130 Breakout continuation
📌 Trade Idea (Bullish Scenario)
Entry Zone: 4,055 – 4,065 🟩
Stop Loss: Below 4,025 ❌
Take Profit 1: 4,100 🎯
Take Profit 2: 4,125 🚀
RR Ratio: 1:2.5 – 1:3 📈
🧭 Market Sentiment
📍 Bias → Short-term Bullish
🛑 But… sellers may reappear at supply line
⚠️ Watch for fakeouts near the target
goldawaitbreakout#XAUUSD we await price for breakout above the 4077 to buy, above 4087-89 holds confirmation on buy once M15-H1 close above.
Buy limit 4077, target 4095-4109, SL 4065.
Below 4063 holds strong bearish continuation which will target 4031.

GoldXAUUSD
- Change of Characteristics
- Order Block
- Symmetrical Triangle as an corrective pattern in Short Time Frame
- Fair Value Gap
- Completed " 12345 " Impulsive Waves and " AB " Corrective Waves

XAUUSD – Potential Distribution Phase Signaling Deeper Bearish TAnalysis of the Chart
Your chart shows a full market cycle structure based on Wyckoff + Smart Money Concepts (SMC). Here’s a clean breakdown:
1️⃣ Previous Accumulation Phase (Left Side)
Multiple BOS (Break of Structure) labels confirming bullish intent.
CHoCH followed by accumulation zones.
Price gradually builds liquidity (SSL / price points).
Strong bullish impulsive leg begins after accumulation.
2️⃣ Strong Bullish Trend Continuation
Successive BOS levels show continuation of bullish strength.
Several mitigation blocks / filled imbalances visible.
Price aggressively pushes toward the premium ceiling zone.
3️⃣ Entry Into Distribution Phase (Top Right)
Market reaches Premium Ceiling Zone.
Signs of exhaustion appear:
Lower high formations
Reversal zone highlighted
Shift in character from expansion → distribution
4️⃣ Bearish Reversal Structure Forming
The chart shows:
A potential descending structure
Expectation of liquidity sweeps followed by deeper decline
First bearish target (Target One) around 3,902
Second bearish target (Target Two) around 3,700
These levels align with prior imbalances and discount pricing.
5️⃣ Market Psychology According to the Chart
Bulls losing momentum after premium pricing reached
Smart money distributing positions
Expecting a retracement toward major discount areas
Possible sweep of liquidity before continuation downward

[WEEKLY] ANFIBO | Gold XAUUSD - Purple or Gray? [11.24 - 11.28]Hi guys, Anfibo’s here!
XAUUSD Weekly Trading Plan
Overall Picture:
OANDA:XAUUSD is entering a critical phase as price continues to consolidate within a tightening structure, signaling that a major directional move is likely to occur next week. After a period of strong volatility, the market is now compressing energy between the upper and lower boundaries of the current range. This setup is textbook for a break–retest–continuation model, and that’s exactly why my strategy for the upcoming week revolves around two clear scenarios: the “purple arrow” plan and the “grey arrow” plan.
The market will reveal its next major direction once either the upper boundary is broken or the lower boundary gives way. Until that happens, there is no reason to pre-commit to a biased direction — we trade what price confirms, not what we predict.
Trading Plan for Next Week:
We will react based on breakout confirmation:
>>> Scenario #1: Break ABOVE the range – Follow the “Purple Arrow” plan (BUY)
If gold pushes through the upper boundary with strength and confirms a retest, we will switch to a bullish continuation plan.
Key Resistance Levels to Watch: 4147, 4243, 4340, 4356, 4377.
A clean break above structure opens the path back into macro bullish territory, where gold may attempt to revisit or even surpass recent highs.
>>> Scenario 2: Break BELOW the range – Follow the “Grey Arrow” plan (SELL)
Once price breaks and retests the lower boundary, we will look for sell setups targeting the ladder of support levels outlined below.
Key Support Levels to Watch: 4000, 3917, 3890, 3862, 3820, 3793, 3760
A bearish breakout from the range could trigger a multi-wave continuation pattern, giving us multiple opportunities to scale in according to structure.
Risk Management:
Trade only after confirmed breakouts — avoid guessing tops and bottoms.
Keep tight SLs on retests to avoid liquidity hunts common during range boundaries.
Maintain Risk:Reward ≥ 1:2 across all setups.
Prioritize clean structure; avoid trading inside the choppy middle zone of the range.
Reassess bias immediately if the breakout fails or re-enters the range.
Conclusion:
Next week’s market will be all about patience and reaction, not prediction. With gold coiling tightly, a breakout is imminent, and both the “purple arrow” (bullish) and “grey arrow” (bearish) plans give us a clear and disciplined roadmap. Whether price breaks upward or downward, we already know exactly where our key levels are and how we will execute. Stick to structure, wait for confirmation, and let the market choose the direction for us.
HAVE A POWERFUL NEW WEEK, GUYS!

XAUUSD Bullish Retracement Setup from Support Zone Toward Key Re1. Market Structure
Price is currently trading near a major support zone (~4055–4060 area), highlighted in blue.
Multiple rejections from this zone in the past indicate strong buying interest.
The structure shows higher lows forming intraday, suggesting bullish pressure building.
2. Key Zones
🔵 Support Zone (Entry Region)
Marked around 4055–4060.
Price dipped into this zone and bounced, showing a potential demand area for long positions.
🔵 Resistance Level (First Target Region)
Around 4081–4098.
This is the first major resistance the price is likely to test after bouncing.
🔵 Final Target Zone
4120 area, the upper major resistance.
Previous highs around this level show strong selling interest historically.
3. Expected Price Movement
The chart suggests a potential bullish move:
Price bounces from the support (entry) area.
Climbs toward 4081 (minor resistance).
Retraces slightly.
Continues upward toward 4097–4100.
Final push toward 4120 target zone.
This is a classic retracement + continuation bullish structure.
4. Trade Idea
Bias: Bullish
Entry: 4055–4060 (support zone)
First TP: 4081
Second TP: 4097–4100
Final Target: 4120
Stop Loss: Below 4050 (beneath support zone)

GoldXAUUSD
- Change of Characteristics
- Bearish Channel as an corrective pattern in Long Time Frame
- Fibonacci Level - 50.00% / 61.80%
- Bullish Channel in Short Time Frame
- Fair Value Gap

GoldXAUUSD
- Bearish Channel as an corrective pattern in Short Time Frame
- Change of Characteristics
- Fair Value Gap
- Demand Zone
- Completed " 12345 " Impulsive Waves and " A " Corrective Wave

XAUUSD – Bearish Retracement Into Supply Zones With Potential Sh1. Overall Context
The market recently had a strong bearish leg after rejecting the upper resistance zone (labelled HIGH PROB POI).
Price is currently retracing upward into a series of supply zones, indicating a potential area for continuation shorts.
2. Key Zones
High Probability POI (Supply)
This is the upper beige zone.
Previously caused a strong sell-off → confirms strong institutional presence.
If price pushes this high again, it may offer the most reliable reversal area.
Extreme POI
The central horizontal zone marked “EXTREME POI”.
Current price is tapping into it.
Market may react here if sellers decide to re-enter early.
3. Internal Structure
A series of labeled SSS (Sell-Side Sweeps) indicate liquidity grabs beneath short-term lows.
After sweeping these lows, price retraced upwards, likely moving toward premium territory to fill sell orders.
The 80% level marked on the chart seems to be your optimal entry zone within the inefficiency/imbalance.
4. Entry Idea
Your marked entry level 4080 sits inside the grey supply block.
This aligns with:
Prior breakdown zones
Fresh supply
Retracement to premium pricing
Liquidity sweep structure
This creates a high-probability short setup, assuming the trend continues downward.
5. Expectation

GoldXAUUSD
- Fibonacci Level - 50.00% / 61.80%
- Demand Zone
- Completed " 12345 " Impulsive Waves and " A " Corrective Wave
- Fair Value Gap
- S / R Level

gold on sideways until breakout#XAUUSD price today is total sideways, but we monitor those price if decline continues. 4046-4040 shows entry on sell, 2 times breakout above 4055.5 on bullish
4046-4040 on sell limit, target 4026-3995, SL 4055.5.
Below 4026 on H4 need reverse back unless the H1 closes below there before selling can continues. The 4055.5 is a strong range which needs 2 times breakout before buying.

XAU/USD (Gold) Price Action Analysis: Trendline Retest & PotentiCurrent Market Structure & Key Observations
Previous Trend: The chart shows a strong uptrend from late October, peaking around November 14th at approximately $4,400. This peak marked a significant reversal.
Correction/Reversal: Since the peak, the price has undergone a sharp downward correction or potential reversal.
Trendline Interaction: The price has recently fallen to and is currently interacting with a major long-term ascending trendline (the solid black line).
Current Price: The price is hovering right at the trendline, indicated by the dashed pink line at approximately $4,034.
Analysis of the Projected Path (Red Lines)
The red lines drawn on the chart suggest a specific bearish scenario:
Trendline Break and Retest: The price is shown to break below the ascending trendline. This is a critical technical signal, often indicating the end of the uptrend and the start of a downtrend.
Pullback/Retest: The price then executes a pullback back up to the broken trendline (now acting as a resistance level). The projected high for this pullback is around $4,060.
Bearish Continuation: After failing to break back above the trendline, the price is projected to continue its decline, heading towards the area of $3,900 and then possibly $3,850 in the following days.
Potential Scenarios (Alternative View)
While the red lines illustrate a clear bearish path, it's important to consider an alternative:
Scenario 1: Bearish Continuation (As Projected)
Action: If the price confirms a breakout below the trendline (closes below it on multiple candles), the trendline turns into resistance.
Target: The focus shifts to lower support levels, with initial targets around $3,900 - $3,850. This confirms the end of the recent uptrend.
Scenario 2: Trendline Hold/Bounce
Action: If the trendline acts as strong support and the price fails to close significantly below it, it could lead to a bounce.
Target: A bounce would target the previous swing high before the major drop, potentially aiming back toward $4,150. This would maintain the longer-term bullish structure.

GoldXAUUSD
- Bearish Channel as an corrective pattern in Short Time Frame
- Order Block
- Demand Zone
- Change of Characteristics
- Fibonacci Level - 23.60% / 38.20%

XAUUSD Bearish Breakout Setup from Ascending Triangle Retest1. Market Structure
The chart shows a strong downtrend, followed by a Break of Structure (BOS) to the downside.
After BOS, price formed a corrective ascending structure (an ascending triangle / rising wedge).
2. Current Pattern
Price is moving upward in a corrective manner, showing lower bullish strength.
The ascending trendline is acting as temporary support.
The horizontal resistance at the top of the triangle reflects slowing bullish momentum.
3. Short Entry Logic
The marked point (yellow circle) shows price tapping the ascending trendline.
The red arrow indicates entry short, expecting a breakdown from this rising structure.
This matches the logic:
✔ Downtrend
✔ BOS
✔ Weak bullish correction
✔ Short at trendline retest before a bearish continuation
4. Target Expectation
The “TARGET” label points upward, but based on context this seems contradictory.
Given BOS and corrective rise, the logical target is downward, toward previous liquidity levels or lows.
The triangle breakout normally aligns with continuation of the previous trend, which is bearish.
5. Trade Bias
Bias: Bearish
Reason: Structural break + corrective pullback + rising wedge = continuation pattern.
6. Risk Considerations
Stop-loss usually goes above the most recent swing high inside the correction.
Watch for any strong bullish candle breaking above the ascending structure — that invalidates the setup.

GoldXAUUSD
- Completed " 12345 " Impulsive Waves and " A " Corrective Wave
- Break of Structure
- RSI - Divergence
- Order Block
- Change of Characteristics

BTCUSD 45m – Pennant Breakout Setup Toward 100k Target1. Pattern Formation: Bullish Pennant
The chart shows a pennant, formed after a sharp downward move followed by price compression.
The upper trendline is descending, the lower trendline ascending, converging into a tightening triangle.
This is typically a continuation pattern, but because the preceding move was downward, traders will often wait for confirmation from the breakout direction.
2. Breakout Attempt
The price is breaking slightly above the upper trendline, marked as ENTRY.
This suggests a potential bullish breakout, but:
The breakout candle is still small.
Ideally, you’d want volume confirmation (not shown in the image).
3. Stop-Loss Placement
The STOP LOSS is placed safely under:
The lower pennant trendline
Recent consolidation lows
This gives a logical invalidation level—if price drops below this, the breakout has failed.
4. Target Projection
The target of $100,006 is consistent with a measured move calculation:
Height of the initial impulse (the pole)
Added to the breakout point
On your chart, the projected move equals about +10%, also labeled on the right.
5. Risk–Reward
The setup shows good R:R, since:
Stop-loss is close
Target is distant
However, pennants can generate fakeouts, so caution is warranted.
6. Market Context (from the chart only)
Current price around $95,984.
The overall trend in the 45-minute view appears mixed:
Strong drop earlier
Stabilization
Compression
The breakout direction will determine the next phase.

GoldXAUUSD
- Fibonacci Level - 38.20% / 50.00%
- RSI - Divergence
- Completed " 123 " Impulsive Waves
- Order Block
- Change of Characteristics

Gold Faces Rejection at Resistance Zone – Potential Bearish CorrAnalysis:
The gold price (XAU/USD) is currently testing a strong resistance zone near $4,235–$4,240, where previous bullish momentum appears to be slowing down. Sellers are showing interest in this area, suggesting a potential bearish reversal or correction phase.
A clear support zone lies around $4,140–$4,150, which serves as the target for the expected downward move. If price breaks below this support, further declines could extend toward the next demand zone.
However, if gold breaks and closes above the resistance zone with strong volume, it could invalidate this bearish setup and open the path to new highs.
Key Points:
Resistance Zone: $4,235 – $4,240
Support Zone: $4,140 – $4,150
Short-term Bias: Bearish correction expected
Target: Support zone near $4,145

GoldXAUUSD
- Completed " 123 " Impulsive Waves
- Break of Structure
- Higher High - Higher Low
- RSI - Divergence
- Fair Value Gap

Gold Bullish Continuation Setup from Ascending Channel Support✅ Analysis – XAUUSD (Gold)
1. Market Structure
Price is moving inside a clean ascending channel, showing a sustained uptrend.
The lower boundary (rejection line) is acting as strong support, where buyers have entered repeatedly.
The current price action is showing a pullback toward this support area, which is typical before a continuation move higher.
2. Current Price Action
Price has retraced back into the buy zone near the channel support.
Candlesticks show slowing bearish momentum, suggesting buyers may soon take control.
Your chart projection indicates a possible bullish bounce.
3. Trade Setup
✅ Buy Zone: Near the rejection line / lower channel
✅ SL (Stop-Loss): Below the support line — smart placement to protect against channel breakdown
✅ Target: Upper resistance of the channel (around 4230 – 4260 zone)
This gives a good risk-to-reward ratio, based on trend continuation.
4. Bullish Expectation
As long as price stays above the rejection line, the uptrend remains valid.
A bounce from this zone is likely to push price toward the target box.

Gold (XAU/USD) Testing Key ResistanceAnalysis:
Gold (XAU/USD) is currently trading around 4145, approaching a significant resistance zone between 4100 and 4120, marked as the first target region. This level previously acted as strong resistance, and price may experience a temporary pullback before resuming upward momentum.
The strong psychological support zone near 3890–3920 served as a solid foundation for the recent bullish reversal, confirmed by double-bottom formations and consistent higher highs.
If gold maintains momentum above 4120, the next upside target lies around 4210, aligning with previous structural highs and a major supply zone. However, rejection from the current resistance could trigger a short-term retracement toward 4100 before another push upward.
Summary:
Immediate Resistance: 4100–4120
Next Target: 4210
Key Support: 3890–3920
Bias: Bullish above 4100, potential retracement before continuation

XAUUSD🟡 #Xauusdgold testing key resistance near 4190–4200 after a strong rally.
Breakout above = 🚀 targets 4240 / 4288 / 4369
Rejection = 🩸 short-term pullback likely.
Momentum strong; watch volume for confirmation.
