GoldXAUUSD
- Completed " 1234 " Impulsive Waves
- RSI - Divergence
- Break of Structure
- Symmetrical Triangle as an corrective pattern in Short Time Frame
- Order Block
Xauusdforexsignal

gold awaits breakout before we buy or sell#XAUUSD bullish await breakout above 4145- 4149 on M30-H1 closure to buy.
Target 4161 -4178. Stop loss 4137
Below the rectangle 4137 holds strong pullback and rejection on sideways before we can get selling range.
If the buy doesn't breakout first but drop below the rectangle then we look for sell.

Gold – Bullish Trendline Retest Points Toward Move to 4,120 USDAnalysis (English):
Gold (XAU/USD) is maintaining a clear bullish uptrend, supported by a strong ascending trendline. After a sharp push upward, the price is now pulling back, moving toward a key demand zone aligned with the trendline.
The chart projection indicates a likely scenario:
✅ Bullish Scenario (Most Probable)
Price corrects down into the demand zone and touches the trendline.
Buyers step in and defend the level.
A bullish continuation move develops, pushing price toward the upper resistance zones at:
4,100 USD
4,115 – 4,120 USD
As long as the price remains above the trendline, the bullish structure stays intact.
⚠️ Bearish Risk
If the price breaks below the trendline (around 4,050 USD), momentum could slow and shift into a deeper correction.

gold await breakout before buying or selling#XAUUSD price still bullish, but if the gap above 4110-4098 gets rejected then short bearish retrace is expected.
Sell at 4098 on 2 times breakout, target 4054, stop loss 4110.
Above 4103-4110 holds bullish continuation if the first breakout covers above there and H1 closure above the price.

Gold (XAU/USD) – 4H Market OutlookFOREXCOM:XAUUSD Bias: Short-term bullish retracement toward prior high
Price is currently reacting from a well-defined support zone around the 4,000 region, where buyers have shown repeated willingness to step in. The market has consolidated within this zone, forming a series of higher lows, which signals accumulation and potential exhaustion of the previous bearish leg.
My entry aligns with the structural demand. The rejection wick at the base of the zone suggests failure to break lower, strengthening the case for a bullish move. As long as price holds above the marked support, the market maintains a realistic path toward the previous swing high above 4,360, which is the projected target.
The bullish target area also aligns with the broad imbalance / inefficiency zone created during the earlier sell-off. Markets commonly retrace to rebalance these areas before deciding on the next major directional move.
Your stop-loss placement below 3,886, under the structural low and beneath the liquidity sweep, is logical. If price violates this level, it would invalidate the bullish thesis and confirm continuation to the downside.
In summary:
• Market is respecting a valid demand zone.
• Accumulation structure favors a bullish corrective leg.
• First major liquidity pool sits above 4,360 (your target area).
• Stop-loss below 3,886 protects the trade idea while honoring market structure.
⸻
Devil’s Advocate — What Could Break This Plan?
To strengthen your thinking, here are the strongest counter-arguments:
1. The “demand zone” may actually be redistribution.
If this is a bearish continuation, the sideways movement could simply be sellers reloading before pushing price to new lows.
2. Liquidity above 4,360 might NOT get hit yet.
Price could rally halfway into the inefficiency and reject aggressively without filling the entire imbalance.
⸻
Three Clarifying Questions you should ask(to tighten your analysis)
1. What confirms for you that this is accumulation and not redistribution?
2. If price only retraces to the midpoint of the imbalance (around 4,260), do you still hold full TP at 4,360?
3. What invalidation level—besides the SL—would signal loss of bullish momentum?

Gold Rejection at Resistance – Bearish Channel Targeting 3930📉 Analysis:
The chart shows a clear shift from an uptrend into a bearish correctional channel:
1. Uptrend Broken
Price previously followed a clean uptrend channel, making BOS (Break of Structure) swings upward.
A ChoCH (Change of Character) occurred, confirming momentum weakening.
2. Strong Resistance Zone
Price entered the 4018–4030 resistance level, marked as a weak high.
This zone acted as a reaction area, causing multiple rejections.
3. Bearish Channel Formation
After hitting resistance, price began forming lower highs and lower lows inside a falling channel.
The rejection line confirms sellers defending the zone.
4. Expected Bearish Leg
The projected path shows consolidation inside the channel followed by a sharp downward impulsive move.
Clean liquidity below supports the bearish scenario.
5. Targets
Major target: 3930
(Highlighted as the trader's target and matches channel support + demand zone.)
📌 Summary
Gold is rejecting the 4020–4030 resistance and forming a bearish channel. A continuation downward toward 3930 remains likely unless price breaks above the resistance with strong momentum.

gold await breakout before entry#XAUUSD price still bullish until the 4019.9 breakout occurs which will target 4029 for bearish reverse.
Buy stop on short, 4019.9, target 4029, stop loss 4010. Sell from 4029 target 3991-3067.
Below 4002 on 2 times breakout hold strong bearish continuation, target 3967.
If H1 on above 4035 closure after 4029 breakout price is full bullish till 4060-70

Gold Rejection at Resistance with Potential Bearish PullbackAnalysis:
The chart shows XAUUSD approaching a strong horizontal resistance zone around 4015–4020, a level where price has previously been rejected multiple times (highlighted in yellow). The market recently broke out of a falling channel, showing short-term bullish momentum, but now price is stalling again at this key resistance.
The grey zone above suggests a supply area, and the white arrow indicates a projected bearish move. As long as gold stays below this resistance, the probability of a downward correction increases.
A potential bearish target appears around 3900–3920 (previous support zone), where buyers may re-enter.
Key Points:
Strong multi-touch resistance at 4015–4020
Price showing early rejection signs
Bearish correction likely if price fails to break above resistance
Downside targets: 3920, possibly 3900

GOLD AWAIT BREAKOUT BEFORE ENTRY#XAUUSD price still bearish unless 2 times breakout occurs above the 3989 limit which will go bullish till 4015.
Now we await for retest above 3974 to sell. Target 3936, stop loss 3989.
Below 3956 on M15-H1 closures holds continuation on sell.

Gold Bearish Continuation After Range BreakdownThe chart shows that gold (XAUUSD) recently broke down from a clear consolidation range highlighted by the red rectangle. This range acted as a distribution zone where price repeatedly failed to break higher. Once the lower boundary of that range broke, sellers gained momentum, pushing price downward.
Price has now pulled back toward the broken structure, forming a corrective bullish move — likely a retracement before further downside. The projection on the chart suggests a lower-high formation followed by continuation to the downside.
Key observations:
Breakdown from consolidation: The range around 3960–4000 was rejected multiple times, confirming strong resistance.
Pullback to structure: Current bullish candles appear corrective, not impulsive.
Bearish projection: The chart shows expected continuation toward levels around 3929, 3900, and potentially lower.
Stop-loss area: The SL is clearly marked at 4000.234, above the former resistance zone.

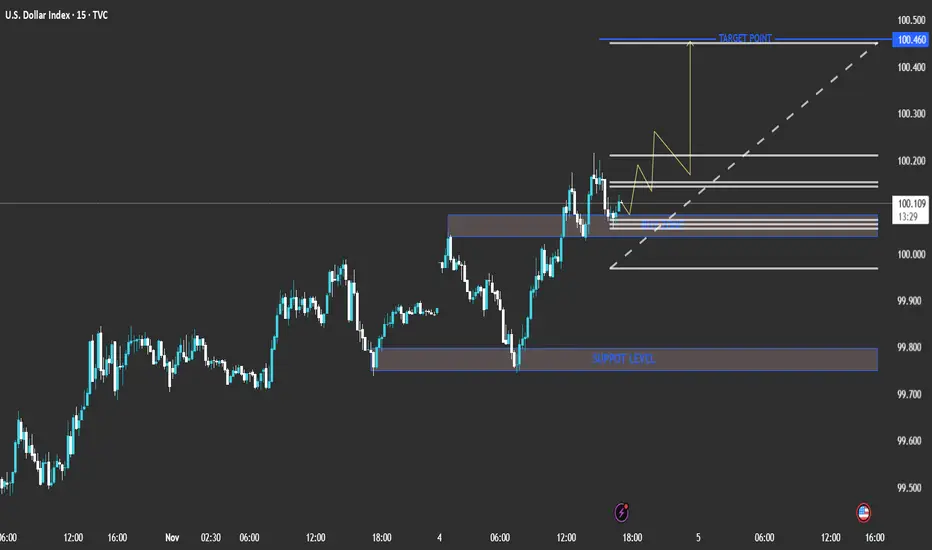
technical analysis of the chart you shared (U.S. Dollar Index Current Price: 100.112
Bias: Bullish short-term
Timeframe: 15-min
The chart shows a clear bullish structure with higher highs and higher lows forming. The price recently bounced from a minor support zone around the 100.00 level and is showing momentum to the upside.
📊 Key Levels
Support Level: 99.750 – 99.850 (major zone from previous lows)
Buy Zone: 100.000 – 100.050 (minor support/entry zone)
Target Point: 100.460
⚙️ Analysis Summary
Price has broken above short-term resistance and is now retesting the buy zone, suggesting a possible continuation higher.
The ascending trendline (dotted white line) supports this bullish bias.
The yellow zigzag projection indicates expected consolidation before a push upward.
🎯 Trading Plan (Based on Chart Setup)
Entry Zone: Around 100.000 – 100.050
Stop Loss: Below 99.900 (below structure support)
Take Profit: 100.460 (target zone)
Risk/Reward Ratio: Approximately 1:3
🔍 Conclusion
The chart suggests a short-term bullish scenario for DXY (U.S. Dollar Index). A successful bounce from the 100.00 zone could lead to a move toward the 100.46 target point. However, a break below 99.90 would invalidate the setup and shift bias to neutral or bearish. TVC:UKX FTSE:UKX FTSE:MCX FTSE:FBMKLCI FTSE:AIM1 FTSE:ASX FTSE:NMX FTSE:AW01 FTSE:JAPAN FTSE:GEISAC FTSE:FBM100 FTSE:AIM5 CBOEEU:BUK100P FTSE:XIN0 FTSE:AXX FTSE:XIN0U
GoldXAUUSD
- Symmetrical Triangle as an corrective pattern in Long Time Frame
- RSI - Divergence
- Change of Characteristics
- Falling Wedge in Short Time Frame
- Fair Value Gap

GoldXAUUSD
- Bullish Channel as an corrective pattern in Short Time Frame
- RSI - Divergence
- Completed " 12345 " Impulsive Waves and " ABC " Corrective Waves
- Falling Wedge as an corrective pattern in Long Time Frame
- Order Block

GoldXAUUSD
- Resistance Level
- Bullish Channel as an corrective pattern in Long Time Frame
- RSI - Divergence
- Symmetrical Triangle as an corrective pattern in Short Time Frame
- Completed " 12345 " Impulsive Waves and " ABC " Corrective Waves

GoldXAUUSD
- Fair Value Gap
- RSI - Divergence
- Completed " 12345 " Impulsive Waves and " ABC " Corrective Waves
- Demand Zone
- Bearish Channel as an corrective pattern in Short Time Frame

Gold Breaks Key Support Zone — Bearish Momentum Builds Below $4,Analysis:
The XAU/USD (Gold vs. USD) 45-minute chart shows a clear breakdown below the established support zone, indicating a shift in market sentiment from consolidation to bearish momentum.
The support zone around $4,050 – $4,000 had previously held multiple times, acting as a strong demand area.
The recent breakout below this zone confirms a potential trend continuation to the downside.
Price action suggests a bearish pattern with lower highs and lower lows forming before the breakout.
A retest of the broken support (now resistance) may occur before the next leg lower.
The next major target lies near $3,900 – $3,850, aligning with the projected measured move.
Technical Outlook:
If gold fails to reclaim the $4,050 level, further downside pressure remains likely. However, a close back above this level could invalidate the bearish breakout and signal a possible false break.

GoldXAUUSD
- Bearish Channel as an corrective pattern in Short Time Frame
- Break of Structure
- Completed " 12345 " Impulsive Waves
- Order Block
- Change of Characteristics

gold on sideway until breakout#XAUUSD now price have break new week low 3886, we await for breakout between the 3910 or 3932 2 times breakout to take new trade.
Below 3910 breakout sell, target 3876, stop loss 3926.
Above 3932 on 2 times breakout buy, target 3970, stop loss 3921.
The move needs to form strong pivot before possible selling.

Gold Rebounds from Extreme POI – Bullish Move Building UpGold?Analysis:
Gold (XAU/USD) has shown a strong recovery after tapping into the Extreme Point of Interest (POI) zone, signaling the potential start of a bullish reversal.
The chart indicates an SMC Trap (Smart Money Concept Trap), where liquidity was swept below previous lows to trigger sell stops before reversing upward — a classic smart money accumulation pattern.
Price reacted sharply from the Extreme POI, forming higher lows, which confirms renewed buyer interest.
The immediate target area lies around $4,180 – $4,200, aligning with the projected bullish arrow.
Below, the High Probability POI remains as a deeper demand zone — a strong confluence area if price retests.
📊 Conclusion:
Gold is showing signs of bullish structure recovery after liquidity sweep. Holding above the Extreme POI zone strengthens the case for continued upside movement toward $4,200 and possibly higher.

Gold Breakout Potential: Descending Wedge Signals Bullish ReversAnalysis:
The XAU/USD (Gold vs. USD) chart on the 45-minute timeframe shows price action forming a descending wedge pattern, a typically bullish reversal formation. The price has been compressing between lower highs and lower lows but is now testing the upper trendline resistance, indicating a possible breakout.
Key observations:
Trendline Breakout Zone: The narrowing wedge suggests weakening bearish momentum. A confirmed breakout above the trendline could trigger strong upward momentum.
Targets: The projected upside targets are around 4,300, 4,400, and 4,500, aligning with previous resistance zones.
Support Zone: Immediate support remains near 4,050–4,000, where the lower wedge boundary provides buying interest.
Momentum Indicator: Gradual bullish recovery and decreasing downside pressure indicate renewed buyer strength.
GoldXAUUSD
- Change of Characteristics
- Strong Bullish Trend Line
- Completed " 12345 " Impulsive Waves and " ABC " Corrective Waves
- Order Block
- RSI - Divergence

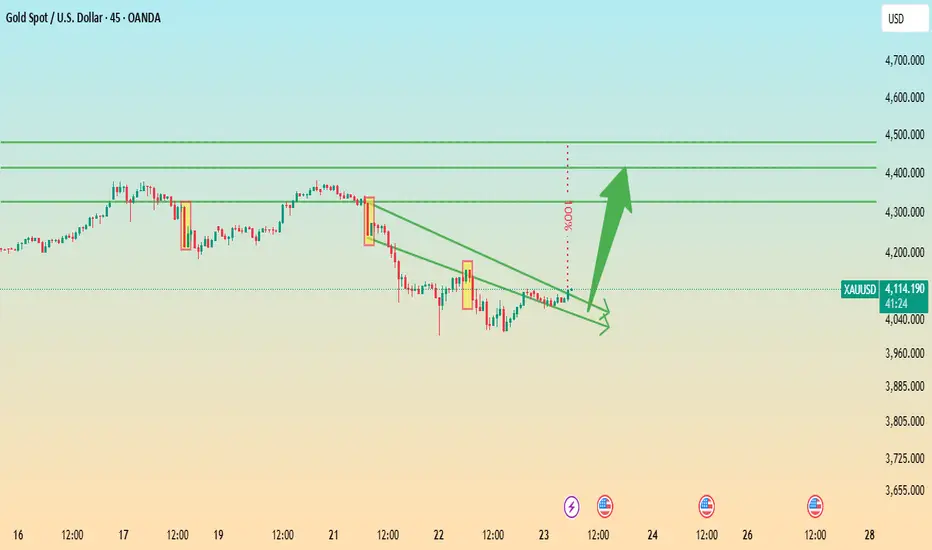
Gold (XAU/USD) Potential Bullish Reversal Setup – Entry Zone For**Analysis:**
The chart illustrates a possible bullish reversal scenario after a recent downward move in Gold (XAU/USD). The marked *Change of Character (ChoCH)* indicates an early sign of a trend shift from bearish to bullish momentum.
Price has entered a **consolidation zone** near the support area, where the **entry level** is highlighted. This zone suggests accumulation and potential preparation for an upward move.
The setup shows:
* **ENTRY:** Around current support, within the highlighted range.
* **STOP:** Below the recent low, providing risk control if the reversal fails.
* **TARGET:** The projection points to a **100% measured move**, aligning with a strong bullish continuation potential toward 4,700 levels.
If price maintains structure and confirms a breakout above the short-term resistance, it may initiate a new **bullish impulse phase**.
