GoldXAUUSD
- Ascending Triangle as an corrective pattern in Long Time Frame
- Fibonacci Level - 50.00%
- Completed " 12345 " Impulsive Waves and " ABC " Corrective Waves
- Double Top in Short Time Frame
- Sell Side Liquidity
Xauusdlong

XAUUSD long setup Since price corrected from the rally up, price has been building HH's and HL's.
There will be news on Wednesday, Thursday and Friday so expect volatility.
I'd enter long with a clean break and close above $5100 (couple 1H candles or a 4H candle, to be sure this is not a fake out)

Bullish recovery - gold rose 5136Related Information:!!! ( XAU / USD )
Bullion initially advanced toward the $5,000 threshold before reversing direction, as early profit-taking emerged. However, buying interest resurfaced near the $4,950 area, where dip-buyers stepped in and propelled the yellow metal back toward its intraday highs.
Meanwhile, the broader set of US macroeconomic indicators released over the week painted a resilient picture of economic activity. In particular, a robust Nonfarm Payrolls report showed job gains exceeding 130,000 in January, alongside a decline in the unemployment rate to 4.3%. These data points have alleviated pressure on the Federal Reserve by reinforcing the strength of the labor market.
personal opinion:!!!
Gold prices recovered above $5000 after negative CPI data for the USD, allowing buyers to continue their current accumulation trend. The long-term trend remains upward due to ongoing global instability.
Important price zone to consider : !!!
Resistance zone point: 5089, 5250 zone
Support zone point : 4658 , 4404 zone
technical analysis : !!!
3 EMA moving averages, price trading above --> supports an uptrend.
Trading volume is stable and accumulating.
Follow us for the most accurate gold price trends.

Gold Technical Outlook - Bullish Structure Still Intact?Gold is currently trading near 5042 and moving within a rising structure after forming a strong base from the February lows. Price is respecting the ascending trendline and holding above the key demand zone around 4900-4950 which keeps the short term bullish structure intact. However the market is still capped below the range high and weak high area near 5110-5130 showing hesitation and liquidity resting above. Price is holding above the rising trendline and the 5116 but is still struggling below the range high and weak high zone. This structure suggests accumulation where a minor pullback into support could be followed by a continuation move toward the upper channel and liquidity zone around 5300-5400.
Trade Plan
Buy Zone: 4950 – 4900
Buy Trigger: Clean breakout and close above 5115 – 5120 with continuation momentum
Targets: 5170 → 5290 → 5350-4000
Invalidation: H4 or Daily close below 4880
Bias : Bullish continuation favored while price holds above the demand zone and trendline. Pullbacks are considered buying opportunities not selling zones.
Note
Please risk management in trading is a Key so use your money accordingly. If you like the idea then please like and boost. Thank you and Good Luck!

XAUUSD/GOLD 4H BUY & SELL PROJECTION 15.02.26Let’s take a look at Gold on the 4-hour timeframe and break down the possible buy and sell scenarios.
Currently, price is trading inside a major supply and resistance zone around 5,100 – 5,150.
This area has already reacted multiple times, which tells us there is strong liquidity sitting here.
We can also see price respecting a descending trendline, while at the same time forming higher lows — meaning the market is moving into a compression phase.
This usually leads to a breakout move.
📈 Bullish Scenario (Buy Setup)
If price holds above the 5,000 psychological level and gives a strong bullish confirmation,
we can expect a continuation towards:
👉 5,200 zone
👉 Followed by the next target near 5,250+
This move would be supported by trendline breakout and sustained buying pressure.
📉 Bearish Scenario (Sell Setup)
On the other hand, if price fails to sustain above the resistance zone and breaks back below the trendline support,
we could see a rejection leading to a drop towards:
👉 Support 1 around 4,850
👉 And if momentum increases, Support 2 near 4,650
This would confirm sellers still control the higher timeframe structure.
🧠 Market Expectation
Right now, gold is at a decision point.
So the best approach is to wait for confirmation rather than entering early.
✔ Break above resistance → Look for buys
✔ Rejection from zone → Look for sells
🎯 That’s the projection for gold on the 4H timeframe.
Trade safe, manage risk, and wait for confirmation.

XAU/USD Monthly Chart Analysis: and Future Target 3000?On the monthly chart of XAU/USD, a classic Cup and Handle formation has developed, with a significant breakout occurring on March 1, 2024. Following this breakout, the price rallied by approximately 24.62%.
To project future price targets, I employed a method of measuring the depth of the cup and adding it to the breakout level. This calculation resulted in a potential price target range of $2,915.24 to $3,000, reflecting a total expected increase of around 42.39%. As of today, August 22, the price has already moved up by 18.81%, leaving a potential upside of 16% to reach the target.
The time projection for achieving this target was derived from the duration taken to complete the Cup pattern, which spanned 108 bars. By dividing this time period by two, I arrived at 54 bars, pinpointing a potential target date of September 1, 2028. Interestingly, there's a coincidental alignment between the breakout date of March 1 and the projected target date of September 1.
However, it’s important to note that financial markets are highly sensitive to news and events, leading to dynamic price movements. The prices are not static and can experience various phases, including uptrends and downtrends. The intention behind this analysis is to identify and track high-time-frame patterns, providing a basis for future projections.
I’ll also be tagging my previous Ethereum prediction, where I forecasted a price movement from $1,500 to $3,500 based on similar logic.
Disclaimer: This analysis is for educational purposes only and reflects my personal study and predictions. It is not intended as financial advice. Please conduct your own research or consult with a professional before making any investment decisions.

XAUUSD 15M | Channel Break & Retest Targeting 5100XAUUSD 15M – Channel Break & Retest Bullish Setup
Gold is respecting a broad ascending channel structure, and we’re now seeing a breakout from the mid-range consolidation followed by a potential retest near the 5035–5038 area.
🔎 Structure Insight:
Price rebounded strongly from the lower channel boundary.
Higher lows are clearly forming inside the channel.
Current move shows a breakout attempt above minor intraday resistance.
Retest zone aligns with previous structure + demand area.
📈 Trade Plan:
Entry: 5035–5038 (retest of breakout level)
Stop Loss: Below 5012 (under recent swing low / structure support)
Target: 5100–5102 (upper channel resistance / liquidity pool)
🧠 Market Logic:
As long as price holds above the 5010–5012 support region, the bullish channel remains intact. The retest provides a cleaner risk-to-reward setup targeting the upper boundary of the channel near 5100.
A breakdown below 5010 would invalidate the bullish continuation bias and suggest deeper correction.

XAU/USDT — Overextension Risk After Parabolic YearGold has delivered nearly 2× in a year, following an additional +35% move before that.
For an asset traditionally viewed as a store of value, this is exceptional. Historically, gold is not highly volatile.
However, it is now actively traded on crypto exchanges — not only via tokenized gold (XAUT), but also through futures and derivatives.
Recently, it has behaved more like a high-beta asset, with corrections of 20%+ in just a few days.
This may be the first signal of a global correction.
The main argument is historical RSI overbought conditions.
In previous cycles, overbought readings alone were not enough for a full reversal — a monthly bearish divergence typically formed before major tops.
That process can take months or even a year. It’s not mandatory, but statistically more common.
Two scenarios remain on the table:
1️⃣ A final push to new highs, followed by divergence formation.
2️⃣ A reversal starting from current levels.
On the weekly timeframe, a bearish candle structure has formed.
Confirmation requires a sustained break and hold below 4800.

Gold Trade Set Up Feb 13 2026Price is overall bearish making LH/LL on the 4h but failed to make a LL on the 1h so i will expect price to either close under London highs and sell toward London lows and PDL or trade higher into the 4h FVG and supply before selling

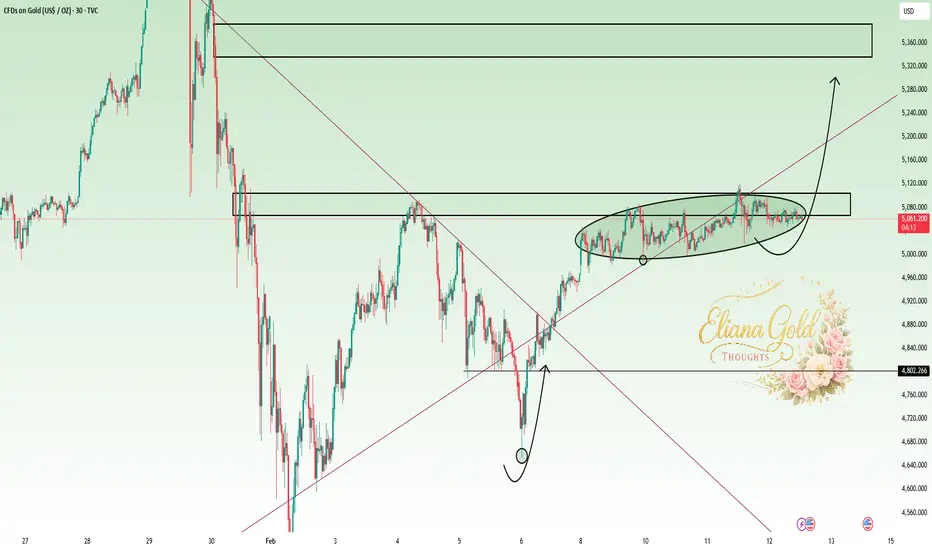
Eliana | XAUUSD · 30M – Bullish Compression Below ResistancePEPPERSTONE:XAUUSD OANDA:XAUUSD
Market Overview
After the sell-side liquidity grab near 4,680, buyers reclaimed structure and pushed price back into bullish territory. The current sideways compression under 5,120 indicates absorption of supply. A sustained hold above 5,000 keeps the bullish bias intact while liquidity sits above 5,120.
Key Scenarios
✅ Bullish Case 🚀
• Hold above 5,000 trendline
• 🎯 Target 1: 5,120
• 🎯 Target 2: 5,200
• 🎯 Target 3: 5,300+
❌ Bearish Case 📉
• Break below 5,000
• 🎯 Target 1: 4,920
• 🎯 Target 2: 4,820
• 🎯 Target 3: 4,680
Current Levels to Watch
Resistance 🔴: 5,080–5,120
Support 🟢: 5,000–4,980
⚠️ Disclaimer: This analysis is for educational purposes only. Not financial advice.
XAUUSD H1 – Pullback Into Discount Before Bullish Continuation?🧠 Market Structure Overview
Gold recently shifted structure after forming multiple Break of Structure (BOS) to the upside, confirming a short-term bullish phase.
However, price printed a Change of Character (CHOCH) at the recent high — signaling a temporary bearish retracement rather than a full trend reversal.
Current movement appears to be a corrective displacement targeting inefficiencies below.
🔎 Key Technical Observations
📉 Strong bearish impulse from range high suggests liquidity sweep + mitigation move
📦 Price reacting near minor supply / mitigation zone (~4,900 area)
🟢 Major Discount POI + FVG confluence below current price
🔴 Higher timeframe Premium FVG remains untouched above (~5,200–5,300)
Structure Context:
Previous BOS sequence = bullish bias intact
Current CHOCH = internal correction phase
Expectation = seek liquidity in discount before continuation
🎯 Trading Scenarios
🟢 Primary Bullish Scenario
Price retraces into Discount FVG / POI zone (~4,780–4,820)
Liquidity sweep + bullish confirmation (LTF BOS / CHOCH)
Continuation toward:
5,000 psychological resistance
5,100 internal highs
5,250–5,300 Premium FVG target
🔴 Alternative Bearish Scenario
Failure to hold Discount zone
H1 close below major demand
Structure shifts bearish → continuation toward lower liquidity pools
📍 Key Levels
Resistance: 5,050 – 5,100
Premium Target: 5,250 – 5,300
Mitigation Zone: ~4,900
Discount POI / FVG: 4,780 – 4,820
Invalidation: Sustained break below discount demand
🧭 Trading Bias
➡️ Short-term: Bearish retracement
➡️ Mid-term: Bullish continuation bias while structure holds
⚠️ Notes
Wait for confirmation inside POI — don’t chase mid-range entries
Combine with sessions + news volatility
Manage risk — this is structural analysis, not financial advice

XAUUSD 30M: Bullish Continuation After Liquidity Sweep – 5,060 🔎 Market Structure
Higher timeframe (left side) shows strong bullish momentum.
We had a sharp selloff into the 4,900–4,920 zone.
Price formed a strong rejection + impulsive bullish move from the low.
Now we’re seeing a bullish pullback + higher low formation.
This looks like a classic continuation setup after a liquidity sweep.
📈 Current Setup Logic
Entry Zone: Around 4,970–4,980 (current consolidation area)
Price is:
Holding above previous minor structure.
Forming a small ascending channel / bullish flag.
Showing higher lows on the lower timeframe.
That’s bullish pressure building.
🎯 Targets
TP1: 4,980–4,990 → First resistance / minor structure
TP2: ~4,999–5,000 → Psychological level + internal resistance
TP3: ~5,020 → Previous structure level
Final Target: ~5,060 → Major resistance / range high
If momentum expands, 5,060 is very realistic.
🛑 Stop Loss
Below 4,946 (as marked)
Below the recent demand + structure low
If price breaks that cleanly, the bullish idea is invalid.
🧠 What Makes This High-Probability?
✔ Liquidity grab below prior lows
✔ Strong impulsive bullish displacement
✔ Pullback holding structure
✔ Clear risk-to-reward (very clean R:R profile)
⚠️ What Could Go Wrong?
If price:
Fails to break 4,990 with momentum
Or starts making lower highs on 15M
Then this becomes a fake breakout and could rotate back to 4,950 zone.
Overall?
This is a solid bullish continuation idea with clean structure and defined risk.
If buyers step in with volume, 5,020+ is very achievable.

A-Book vs B-Book: What Every Retail Trader Needs to KnowMost retail CFD traders have never even heard the terms “A-Book” and “B-Book,” yet almost all of them are directly affected by how these models work. Your broker’s choice between the two can change the prices you see, how your orders are filled, and even whether your stop loss gets hit. Let’s break it down so you know exactly what’s going on behind the scenes.
█ What is A-Book?
An A-Book broker routes your orders straight to external liquidity providers, such as banks, market makers, or directly to an exchange in the case of futures or spot markets. Your broker is essentially the middleman, passing your trade along and matching it with a real counterparty.
⚪ How they make money:
Spreads (the difference between the bid and ask prices).
Commissions on each trade.
Occasionally a small markup on the feed.
Because they don’t profit when you lose, an A-Book broker’s ideal client is a trader who trades frequently and consistently, your activity is their revenue stream.
█ What is B-Book?
A B-Book broker keeps your trades “in-house,” meaning they take the other side of your position. If you buy, they sell; if you sell, they buy, but all within their own system. Your trades don’t reach the real market at all.
⚪ How they make money:
Your losses are their profits.
They may still earn on spreads and commissions, but the main income is the net loss of their client base.

XAUUSD: Bullish Push to 5250?FX:XAUUSD is eyeing a bullish breakout on the 4-hour chart , with price rebounding from the upward trendline after recent pullback, converging with a potential entry zone near support that could ignite upside momentum if buyers defend amid volatility. This setup suggests a continuation opportunity in the uptrend, targeting higher resistance levels with more than 1:4 risk-reward .🔥
Entry between 4800–4850 for a long position (entry from current price with proper risk management is recommended). Target at 5250 . Set a stop loss at a close below 4750 , yielding a risk-reward ratio of more than 1:4 . Monitor for confirmation via a bullish candle close above entry with rising volume, leveraging gold's resilience near the trendline.🌟
Fundamentally , gold is trading around $4,976 in mid-February 2026, with today's key US Dollar event being the CPI release for January at 8:30 AM ET (13:30 UTC), forecast at 0.3% MoM and 2.5% YoY, where hotter-than-expected inflation could strengthen USD and pressure gold lower, while softer readings boost safe-haven demand. 💡
📝 Trade Setup
🎯 Entry (Long):
4800 – 4850
(Entry from current price is valid with proper risk & position sizing.)
🎯 Target:
• 5250
❌ Stop Loss:
• Close below 4750
⚖️ Risk-to-Reward:
• > 1:4
💡 Your view?
Does gold extend toward 5250 after defending trendline support, or will CPI volatility trigger a deeper correction first? 👇

XAUUSD/GOLD 1H SELL LIMIT PROJECTION 13.02.26In today’s analysis, we are looking at XAUUSD on the 1-hour timeframe, and the market is clearly preparing for a potential downside move.
Let’s break it down step by step.
First, price previously respected the day high as resistance. That zone acted as strong supply, and we saw a massive impulsive bearish candle from that level. This confirms institutional selling pressure.
After that sharp drop, the market formed a retracement.
Now pay attention here 👇
Price has pulled back into the 0.5 – 0.618 Fibonacci retracement zone, which is a premium area for sell entries in a bearish trend.
At the same time:
• The market left a Fair Value Gap (FVG) above
• Stop-loss liquidity is resting above recent highs
• Price is retracing into imbalance
This is a classic smart money sell setup.
Now let’s confirm with indicators:
🔹 Stochastic Oscillator is above 80 – indicating overbought conditions.
🔹 RSI is below 50 on the 1H timeframe – which confirms bearish momentum overall.
So what does this mean?
Even though price is pulling back, the higher timeframe momentum remains bearish. This retracement looks like a liquidity grab before continuation.
📌 Trade Plan:
Entry Zone: Around 0.5 – 0.618 Fibonacci area
Stop Loss: Above the Fair Value Gap / recent swing high
Target: Yesterday’s low / key support zone

Bearish Breakout Below Range, Pullback Into Resistance
Current Structure:
Price was ranging under a clear resistance zone (≈ 4,992 – 5,018) before printing a strong bearish impulse candle that decisively broke structure to the downside. This move invalidated short-term bullish momentum and shifted bias intraday to bearish.
🔎 Key Observations
1. Market Structure Shift
The large bearish candle confirms a break of minor support and signals momentum expansion.
This looks like a liquidity sweep + displacement move, often followed by a corrective pullback.
2. Entry Zone (Demand) – 4,909 – 4,937
Price tapped into a marked demand/support area.
Reaction here suggests potential for a short-term retracement rather than immediate continuation.
This zone is likely where buyers attempt a bounce.
3. Resistance / Target Zone – 4,992 – 5,018
Previous consolidation + supply area.
If price retraces, this zone becomes:
A sell-on-rally area
A potential lower high formation zone
📈 Probable Scenario (Based on Structure)
Most likely flow:
Short-term bounce from demand
Retracement toward ~4,975–5,000
Rejection at resistance
Continuation lower if bearish structure holds
This would form a lower high, confirming bearish continuation.
⚠️ Alternative Scenario
If price:
Reclaims and closes strongly above 5,018
Holds above resistance
Then the bearish impulse becomes a fake breakdown and buyers regain control.
📊 Bias Summary
Intraday Bias: Bearish
Short-term Expectation: Pullback → rejection → continuation lower
Invalidation: Sustained move above resistance zone

XAU/USD (Gold) – 1H Chart Technical Analysis
🟢 Market Structure
The chart shows bullish recovery after a strong downtrend.
Price formed higher lows and higher highs, indicating buyers are gaining control.
Currently, price is moving in a consolidation range just above a demand zone.
🔵 Key Zones
✅ Demand Zone / Buy Entry
Around 5000 – 5030
Price has reacted multiple times here → strong buyer interest.
This area is marked as a potential BUY entry.
🔴 Stop Loss Zone
Around 4970 – 4990
If price breaks and closes below this zone, bullish setup becomes weak.
🟩 Resistance / Target Zone
Around 5140 – 5170
Previous rejection area.
Likely profit-taking zone if price continues upward.
📍 Current Price Behavior
Price is consolidating above demand → bullish sign.
ALMA moving average is supporting price → trend strength confirmation.
The circled region suggests a pullback and continuation pattern.
📈 Trade Idea (Based on Chart)
Buy Entry: Demand zone (≈ 5000 – 5030)
Stop Loss: Below 4970
Target: 5140 – 5170 resistance zone
⚠️ Risk Notes
If price breaks below demand zone → possible bearish continuation.
Watch for false breakouts near resistance

XAUUSD Bullish Continuation Setup Inside Ascending ChannelTrend: Bullish (short-term intraday)
Pattern: Ascending channel
Current behavior: Consolidation above support
Momentum: Cooling, not reversing
Price tapped support around the 5,039–5,050 zone and reacted strongly. That tells us buyers are still defending structure.
Trade Idea Breakdown
Entry: Around 5,062–5,065 (break + hold above minor resistance)
Stop Loss: Below 5,038 (below channel support + structure low)
Target: 5,106 area (channel top + projected measured move)
Risk-to-reward looks solid here — roughly 1:2+ depending on execution.
What Needs to Happen
For continuation:
We need a clean bullish break above 5,070–5,075
Followed by strong candles, not weak wicks
If price starts closing below 5,050 again and loses momentum, this bullish idea weakens fast and we could see a deeper retrace toward lower channel support.
Summary
Bias: Bullish continuation
Invalidation: Break below 5,038
Confirmation: Strong close above 5,075
Target zone: 5,100–5,110
This is a structure-based continuation setup — not a breakout chase. Patience at entry makes the difference here.

GOLD : (Reverse To The Upside Trade)Gold Buy @ 5059.612
TP1 : 5064.576
TP2 : 5068.454
TP3 : 5073.662
TP4 : 5081.365
SL : 5040.408

G O L D : (Buy Stop 5082+)Gold Buy Stop - (Xausd) looking to be buying this is due to its trend and price structure as usual we follow the trend and look at the structure ,combine that with our daily direction this helps us discover the sentiment of the market for the day
Potential New Price : 5118.269

Gold Trade Set Up Feb 12 2026Price is in a range and just swept London highs but making HL on the 1h and 15m. If price breaks and closes above London highs i will expect price to trade higher to PDH and 15m supply but if price closes under and makes internal 5m bearish structure i will take sells to Asia Lows

gold on retest below 5030#XAUUSD base on D1 similar candle, we expect opposite move first on price before actual move. Price needs to retest below 5030 for continuation on buy.
5030 2 times breakout buy, target 5080,5122, SL 5015.
Above 5074 can expect drop till 5030 but valid breakout above 5084 on M15 tf will continue buy.
If breakout below 5007 then we look for sell.

XAUUSD on Rangbound before [ Bullish streak]XAUUSD is still with Rangebound along Rising pattern is still intact .(Non-Farm Payrolls) data delivered exactly as we were waiting.
If Price-action remains intact above the Lower trendline & structural support then we could see another spike
-1st POI 5045-5035
Target : 5145 - 5170
-2nd POI 4980-4970 for optimal buy
⚠️ secondly if H1-H4 Candle (Body) closes below 5030 then wait for implusive drop towards 4990-4970.
