Gold Pullback Opportunity Within Strong Bullish MomentumAnalysis:
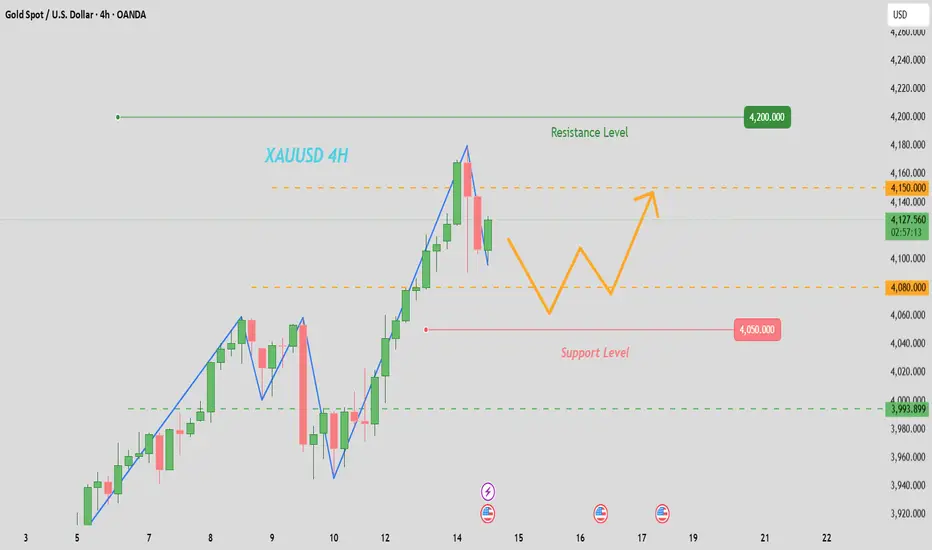
The XAU/USD chart shows that gold has maintained a powerful upward trajectory, breaking out of its previous consolidation channel (highlighted in purple). After the breakout, price surged to new highs near 4,120, confirming strong bullish momentum.
Currently, the market is showing a minor pullback toward the 4,090–4,060 zone — a region aligning with previous resistance turned support. This retracement appears healthy and could provide buyers a chance to re-enter before another leg up.
The bullish continuation setup is supported by:
Previous breakout retest: The price is testing the prior resistance area, which could now act as strong support.
Momentum structure: Higher highs and higher lows remain intact.
Favorable risk-reward ratio: The long position targets around 4,180, with stops below 4,060 support.
Xauusdlong

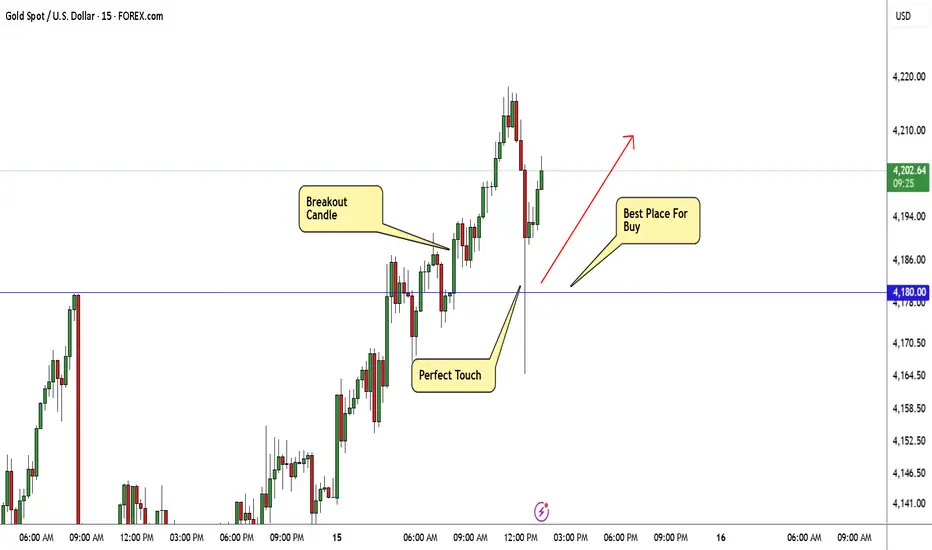
GOLD Breakout Done , Long Setup Valid To Get 300 Pips !Here is My 15 Min Gold Chart , and here is my opinion , the price going up very hard without any correction so we should move with it and we have a 4H Candle closure above our Res 4180.00 And Perfect Breakout and this give us a very good confirmation , so we have a good confirmation now to can buy after the price go back to retest the broken area 4180.00 One more time and we have already a great touch that take all stop losses before going up so i think the second touch will be better and will give us a good chance to enter with good stop loss , and we can be targeting 100 to 300 pips . if we have a daily closure below this area this mean this idea will not be valid anymore .
Reasons To Enter :
1- Perfect Touch For The Area .
2- Clear Bullish Price Action .
3- Bigger T.F Giving Good Bullish P.A .
4- The Price Take The Last High .
5- Perfect 4H Closure .
Gold Tarde Set Up Oct 15 2025Im still bullish on gold but i want to see a test of 15m supply to then see SSL/London lows swept followed by a 15m Bullish candle close to then target previous swing high and ATH

gold on sell#XAUUSD price await for correction below the 4059 limit. We wait for 2 entries on 2 times breakout before selling.
4200 holds confirmation on sell, target 4151-4059, stop loss 4217.
Below 4186-4180 holds strong confirmation on 2 times breakout, target 4059.
Above 4217 on H1 close above there will continue bullish.

XAUUSD on Retracement overall bullish trend XAUUSD is still on bullish Bias and holding rising wedge pattern but retracement can be on strike.
What will I do Today?
✳️ currently market is bit tricky for scalpers and retailers let's assume a scanario or condition of mine .
- I'm on buy from 4190 and expecting H4 candle remains above the mentioned upper zone then hold for targets.
My target will be $4235 & 4260 In extension !!
✳️ Secondly
if any candle closes below 4180 then our buying will be postpond and we'll have retracement towards 4135 then 4110 in extension ,
Additional Tip:
-BUY the Dips
OR

XAUUSD Delivered Excellent profits [ 1570 pips straight]Thanks to those traders who followed us and made profits 📈🙏 keep grinding 💪.
I booked profits on buying orders during overnight session, entering around 4142 & 4132 and exiting near 4105 while my shorter-term longs hit the 4098 target on yesterday Ny session drop.
Next I bought XAUUSD 4102 which I hold overnight and it's 1200 pips floating in profits.
Going forward, I’ll continue buying dips from my key entry zones as long as Gold holds above the bullish trend till 4170.

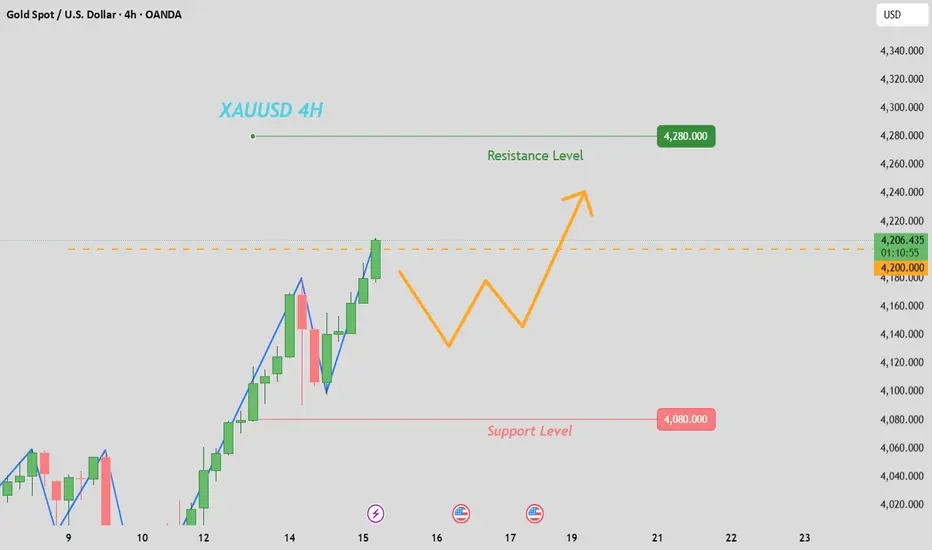
XAUUSD: Testing the solidity of 4200 levelAs we predicted in our analysis yesterday, gold is currently approaching the critical 4200 level, focusing on testing the solidity of the resistance at this level. Once the price stabilizes above the 4200 mark, it is expected to accelerate upward and launch an assault on the 4280-4300 area.
Gold Is on Fire: Can XAU/USD Hit $4130 Gold’s price is really strong right now. As long as gold stays above $4000, it can move up to $4130. But if gold drops below $4000, it could slow down or even start to fall.
What do you think will happen next, do you think gold will keep going up or fall back down? Have you ever watched gold make a big move before?
If you want to know what to do or have any questions, just ask me! Sometimes a simple question can help you learn something new about trading gold. What do you want to know about gold today?
Mindbloome Exchange
Trade Smarter Live Better

Momentum Breakout into Strength | D-H Flip ConfirmedStrong continuation from last session’s impulsive push.
I caught my move during the Tokyo impulsive hour after price broke cleanly above 4175 — confirming a momentum breakout setup on the 15-min chart.
The previous Daily High (4191.2) has now flipped into solid support, reinforcing the bullish narrative I’ve been tracking since the start of the week.
My original weekly target was 4200 — we’ve exceeded that level now, and the momentum still looks healthy.
Price action is slowing ahead of the London session, which could set the stage for another expansion leg. If bullish pressure holds, I’m watching 4230–4250 next, with 4500 as a stretch target.
💡 Key Notes:
Setup: Momentum Breakout
Bias: Bullish
Entry: 4177.3 | Exit: 4185.1
Result: +$386 (5 Contracts)
Time in Trade: 42m
Context: Daily High Flip + Strong Impulse Continuation
#Gold #Futures #DayTrading #PriceAction #Breakout #TradingView #MGC #Trader #NoFOMO #Discipline #MomentumBreakout #ICTInspired

XAUUSDGold hit a high of 4180 before plummeting 90 points in a remarkably short period of time, a clear sign of a major market manipulation. September's gains were very stable, with limited room for pullbacks. We must be wary of a sharp and rapid decline in October. Excessive gains will inevitably lead to a market shakeout, a risk we've repeatedly discussed.
After breaking through yesterday's high, the daily chart suggests a continuation of the trend today, with an intraday surge. However, after the sharp drop, a return to strength may not be imminent; a period of consolidation is needed. Therefore, the US market is expected to see volatility initially. With prices deviating significantly from the short-term moving average, a correction is needed to bring prices closer. An uncorrected rise is unhealthy. A return to bullish strength after a correction indicates the trend is continuing.

GOLD: Short-term testing of the 4080 support levelRecently, due to the ongoing deadlock between the U.S. Democratic and Republican parties, the government has remained in a shutdown. Concerns over economic downturn have intensified, while expectations for the Federal Reserve to cut interest rates within the year have continued to rise. Additionally, trade frictions have escalated again—all these factors have driven gold prices to keep surging, making gold once again the darling of the global economy.
However, in the afternoon, as Trump repeatedly emphasized peace in the Middle East, gold experienced a sharp drop of nearly $90 after hitting the all-time high around the 4179 level. It then rebounded to a high of around 4145, and a platform resistance has formed at this level in the short term. Currently, long-position traders are jittery at high levels. For short-term trading, the risks and profits for both long and short positions are basically balanced.
We also reminded everyone in the afternoon to exit long positions in a timely manner, and any level above 4130 is a good entry point for short positions. Gold is now testing the support around the 4080 mark again. For short-term trades, it is advisable to go short on rebounds; for medium-to-long-term positions, we still expect gold to continue surging to new all-time highs after a pullback.
💎
Sell 4120 - 4125 TP 4100 - 4080 SL 4130
Buy 4075 - 4080 TP 4090 - 4100 SL 4070
Daily-updated accurate signals are at your disposal. If you run into any problems while trading, these signals serve as a reliable reference—don’t hesitate to use them! I truly hope they bring you significant assistance
gold on sideway until breakout#XAUUSD We await for price breakout between the two entry.
Firstly breakout below 4090 on 2 times breakout, will drop the price till 4025, stop loss at 4108.
Above 4135 on 2 times breakout will go bullish till 4195.
We await for breakout before trading.

plan day 14-oct-2025 Related Information:!!!
USD investors appear reluctant to place strong bets as more market participants accept that the Federal Reserve (Fed) is likely to cut interest rates twice this year. Moreover, economic uncertainties stemming from a prolonged U.S. government shutdown, renewed U.S.-China trade tensions, and rising geopolitical risks could continue to act as a tailwind for the safe-haven gold. This, in turn, calls for caution among XAU/USD sellers.
personal opinion:!!!
After several days of continuously hitting new highs, gold prices have started to correct toward $4000 and move sideways.
Important price zone to consider : !!!
Resistance zone point: 4000 zone

Gold’s Bull Run Continues – Target $4,080+Gold is clearly maintaining strong bullish momentum above $4,000. The market has maintained its upward trajectory since rebounding from the $3,900–$3,920 support zone. This zone acted as a solid demand area, leading to consistent higher highs and higher lows — a clear indication that buyers are dominating.
The recent price action shows a clean breakout above the $3,980–$4,000 resistance area, which has now turned into a new short-term support. The chart also marks a “Weak High” near the current level, suggesting that a minor pullback or consolidation could occur before another bullish push resumes. This retracement could test around $4,010–$4,020 before aiming higher.
The next major resistance levels are visible at $4,060, $4,075, and potentially $4,080–$4,100, which could be the next targets if bullish momentum continues. As long as gold stays above $4,000, the overall market bias remains positive. A sustained break below this zone might trigger a deeper correction toward $3,960 or even $3,940, but that currently looks less likely given the strong bullish structure.
In summary, the short-term outlook remains bullish with expectations of a possible brief dip before continuation toward $4,080+. The trendline support and consistent break of minor resistances confirm strong buyer confidence in the market.
Strong bullish trend continues
Key resistance: $4,072 → $4,132 → $4,150
Support to watch: $3,976 → $3,925
🔹 Buy Zone:
A potential buy zone lies between $4,010 – $4,025, where a short retracement is expected before the next upward move. This area aligns with minor structure support and trendline confluence, making it ideal for re-entry or fresh long positions.
🔹 Buy Trigger:
A strong buy trigger would be a bullish 1-hour candle closing above $4,045, confirming momentum continuation toward the next resistance targets at $4,065, $4,075, and $4,080+.
Note
Please risk management in trading is a Key so use your money accordingly. If you like the idea then please like and boost. Thank you and Good Luck!

Gold Analysis: Will Buyers Push the Price to 4,150?Hello everyone, Kilian here!
XAUUSD is currently trading within a well-defined ascending channel, with price action consistently respecting both the upper and lower boundaries of the channel. This stability indicates that the market is following a sustainable uptrend, and it’s no surprise that investors remain confident in the strength of the buyers.
Price Action and Growth Potential
Recently, price action has clearly shown that buyers are in control. The strong bullish momentum could lead to a significant breakout, potentially breaking through the resistance zone that has been hindering the price's upward movement. If this happens, XAUUSD could continue its uptrend, with a retest of the support level before advancing further.
A successful retest would further strengthen the bullish trend and potentially spark a powerful move toward the 4,150 target, which aligns with the upper boundary of the ascending channel.
Potential Risks and Key Factors to Watch
However, we cannot overlook the possibility that the price might fail to break through the strong resistance zone. If this occurs, it could signal that bullish momentum is weakening. In this case, there might be a retracement, with the next target being the support zone at the lower boundary of the channel.
Tips for Traders
As always, the most important thing in trading is to confirm your setups and manage your risk properly. Whether or not this scenario plays out, being prepared for every situation will help you minimize risks and optimize your profits.

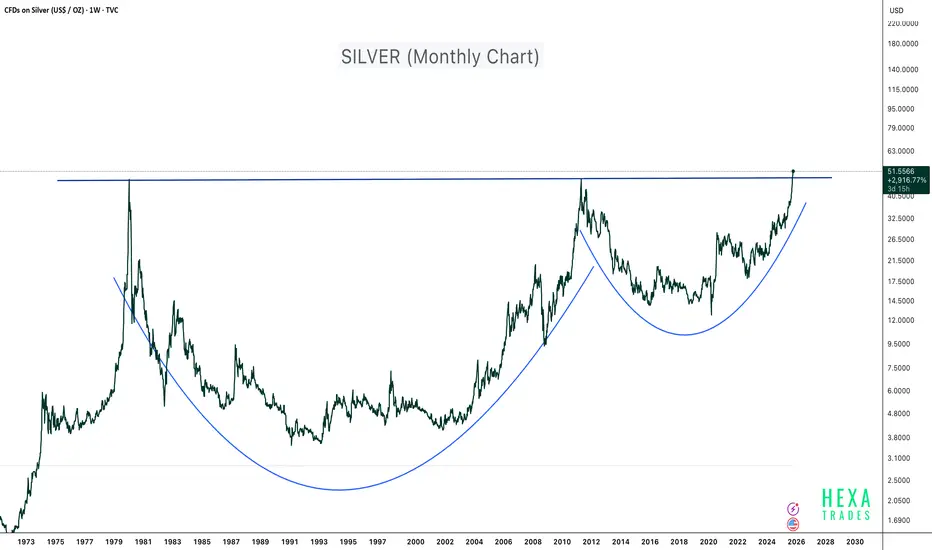
Silver - 45 Years of Breakout!Silver has just completed one of the largest and longest cup and handle patterns in financial history, spanning more than four decades. The metal has officially broken above the 1980 and 2011 highs, signaling a potential supercycle breakout on the monthly timeframe.
This type of long-term technical structure typically marks the beginning of a massive secular bull run, often driven by macroeconomic shifts such as inflation cycles, fiat currency debasement, and rising demand for hard assets.
Technical Highlights:
- Pattern: 45-year Cup and Handle formation
- Breakout Zone: Above $50 confirmed (Weekly chart)
- Structure: Deep base formation showing multiple accumulation phases (1981–2001 and 2012–2023)
Macro Perspective:
Silver is benefiting from:
- Increased industrial demand (especially in solar, EV, and electronics sectors)
- Inflationary monetary policies and growing global money supply
- Renewed investor interest in tangible and real assets
This breakout could mark the start of a multi-year bull run for silver. Long-term investors may view this as an opportunity to accumulate and hold for 10–15 years, aligning with the magnitude and duration of the pattern.
If the price experiences short-term pullbacks in the coming months, use DCA (Dollar-Cost Averaging) to build long-term exposure.
Conclusion:
After 45 years of consolidation, silver is finally breaking free. The chart points toward a historic structural breakout, potentially setting the stage for the next precious metals supercycle.
Cheers
Hexa
Disclaimer:
This analysis is for educational purposes only and does not constitute financial advice. Always conduct your own research and manage risk responsibly.
Gold Next Move : 4222? NEW ATH CONTINUOUSLY ?Gold Currently Runs On The Bullish Channel
We Are Considering Bullish Setup On RBS Pull Back Buy Zone
Area To Buy 4060 / 4050
Pullback Buy
Target Bullish Setup 4220 - 4250
Lets Gooo NEW ATH GOLD

GOLD – Bullish Above 4011 Ahead of Tariff TensionsGOLD – Outlook
Gold remains supported by bullish momentum ahead of the renewed tariff tensions between the U.S. and China.
These developments are expected to strengthen safe-haven demand, keeping gold on track toward new all-time highs if momentum continues.
Technically, as long as the price trades above 4011, the bullish trend is likely to extend toward 4040 and 4058, with potential continuation toward 4092.
A bearish correction would require a 1H candle close below 4011, which could trigger a move down to 3980, and below 3965 the decline may extend to 3944.
Gold will likely trade sensitively in the short term, reacting to any new statements from President Trump or updates on the tariff situation between Washington and Beijing.
Pivot Line: 4011
Resistance Levels: 4040 / 4058 / 4092
Support Levels: 3980 / 3965 / 3944
📈 Summary:
Bullish bias remains above 4011, targeting 4058 → 4092, while a close below 4011 may trigger a short-term correction.

gold on sideways until breakout on buy or sell#XAUUSD price await breakout below the 4073 to sell, target 4060 first TP, stop loss 4086.
Breakout below the 4058-4055 will drop the price further more till 4025.
Above the 4088-90, price have bullish breakout which will form new trend at 4112.

Gold Trade Set Up Oct 13 2025Gold bullish trend continues making ATH so i will only be looking for buys for now. A 5m demand just got respected to id like to see a 15m BOS followed by a 15m demand or support touch before looking for buys but i will be careful since it can reverse anytime

GoldXAUUSD
- Break of Structure
- Supply Zone
- Bullish Channel as an corrective pattern in Short Time Frame
- RSI - Divergence
- Completed " 1234 " Impulsive Waves

GOLD Continue To Upside ,Should We Buy It After Great Breakout ?Here is My 30 Min Gold Chart , and here is my opinion , the price going up very hard without any correction so we should move with it and we have a 4H Candle closure above our Res 4059.00 And Perfect Breakout and this give us a very good confirmation , so we have a good confirmation now to can buy after the price go back to retest the broken area 4059.00, and we can be targeting 100 to 200 pips . if we have a daily closure below this area this mean this idea will not be valid anymore .
Reasons To Enter :
1- Perfect Touch For The Area .
2- Clear Bullish Price Action .
3- Bigger T.F Giving Good Bullish P.A .
4- The Price Take The Last High .
5- Perfect 4H Closure .

Gold/USD: Bullish Climb to $4100?OANDA:XAUUSD is showing a bullish setup on the 1-hour chart , with an entry zone between $3,963-$3,985 near a key support level.
First target at $4,075 marks initial resistance, while the second at $4,100 offers a deeper upside potential. Set a stop loss on a close below $3,940 to manage risk effectively. 🌟
A break above $3,985 with strong volume could confirm this move, driven by safe-haven demand and USD dynamics. Watch economic data trends! 💡
📝 Trade Plan:
✅ Entry Zone: $3,963 – $3,985 (support area)
❌ Stop Loss: Daily close below $3,940
🎯 Targets:
TP1: $4,075 (initial resistance)
TP2: $4,100 (extended target)
Ready for this rally? Drop your thoughts below! 👇
