find new ATH 4074 , price increase⭐️GOLDEN INFORMATION:
Gold (XAU/USD) extends gains for a second day, reaching a new record high near $4,060 in Monday’s Asian session. Persistent economic uncertainty from the prolonged US government shutdown, renewed US-China trade tensions, and growing expectations of further Federal Reserve rate cuts continue to support the safe-haven metal. Markets now anticipate two additional rate cuts this year, pressuring the US Dollar and bolstering Gold. However, President Trump’s softer tone on China tariffs has improved overall risk sentiment, capping the metal’s upside for now.
⭐️Personal comments NOVA:
Tariffs, adding momentum for gold prices to continue growing, creating new ATH this week
⭐️SET UP GOLD PRICE:
🔥SELL GOLD zone: 4074 - 4076 SL 4081
TP1: $4060
TP2: $4050
TP3: $4040
🔥BUY GOLD zone: $4000-$4002 SL $3995
TP1: $4010
TP2: $4020
TP3: $4030
⭐️Technical analysis:
Based on technical indicators EMA 34, EMA89 and support resistance areas to set up a reasonable BUY order.
⭐️NOTE:
Note: Nova wishes traders to manage their capital well
- take the number of lots that match your capital
- Takeprofit equal to 4-6% of capital account
- Stoplose equal to 2-3% of capital account
Xauusdlong
GOLD Completes Correction – Ready to Soar to 4,050 USD!OANDA:XAUUSD The price is currently testing a key support zone within a clearly defined ascending channel, indicating potential for continued upward movement. If price action confirms rejection at this level, we may see a bullish move towards 4,050 USD, aligning with the middle line of the channel. However, a break below this support level could invalidate the bullish outlook and signal a shift in momentum.
This setup reflects the potential for the current uptrend to continue. If you agree with this analysis or have additional insights, feel free to share your thoughts in the comments!

Gold Performance Recap for the weekThe XAU witnessed a "surge, pullback and rebound" trend this week, recording the largest weekly volatility since 2025.
The movement can be divided into three phases:
1 Monday: A record-breaking sharp rally
2 Tuesday-Wednesday: High-level consolidation and a second rally
3 Thursday-Friday: Volatile swings driven by policy divergences
Looking ahead to next week, if the Federal Reserve's October interest rate decision delivers the anticipated 25-basis-point rate cut as scheduled, gold prices are expected to challenge the 4,080 resistance level; if signals of a "rate cut pause" are released, a deep correction may be triggered with the support level eyed at 3900.
We also need to monitor whether the historical high of 4,057 can be effectively broken and the strength of support around the weekly consolidation center at 3,989.
XAUUSD: Next - week forecastOver the past week, gold rebounded sharply after a sharp decline, formed a "double-bottom" pattern, and regained the 4,000 level, with clear short-term support.
We predict that next week gold will oscillate upward in the range of 3,960 - 4,080, gradually rise relying on trendline support, and is expected to test the resistance at 4,050 during the week. If it breaks through with increased volume, it will target 4,100 resistance level.
However, at the same time, we need to closely monitor Fed policy and geopolitical risks as core variables, because macro events may become the key to breaking the balance.

Tariff tensions - the driving force behind gold price increases✍️ NOVA hello everyone, Let's comment on gold price next week from 10/13/2025 - 10/17/2025
⭐️GOLDEN INFORMATION:
Gold (XAU/USD) climbs during the North American session on Friday, trading near $3,997, up 0.6%, as renewed US-China trade tensions, the ongoing US government shutdown, and expectations of further Fed easing fuel safe-haven demand. Risk sentiment deteriorated after President Donald Trump warned of new tariffs on China, which threatened countermeasures on rare earth exports, while Trump dismissed the need to meet President Xi Jinping later this month.
⭐️Personal comments NOVA:
Tariff tensions return, US government remains shut. Gold price maintains bullish momentum above 4000
🔥 Technically:
Based on the resistance and support areas of the gold price according to the H4 frame, NOVA identifies the important key areas as follows:
Resistance: $4058, $4100
Support: $3980, $3942, $3895
🔥 NOTE:
Note: Nova wishes traders to manage their capital well
- take the number of lots that match your capital
- Takeprofit equal to 4-6% of capital account
- Stoplose equal to 2-3% of capital account
- The winner is the one who sticks with the market the longest

Fear Feeds Gold to the Next Target at 4200Last Friday October 10,2025 massive waterfall came in when President Donald Trump announced he will impose an additional 100% tariff on goods from China, on top of the 30% tariffs already in effect, starting November 1 or sooner. The threat is a massive escalation after months of a trade truce between the two nations.(-CNN)
With this sentiment in the air, the positivity of cut rates have been wiped out and the sentiment is inclined to fear making gold the safe haven asset for investors.
Gold has picked up its momentum at the 0.5 level of the Fibbonaci ratio around 3940 $/oz and is accumulating to beat again the recent all time high 4059 $/oz
Safe haven status will lead gold to another highs this week. Potentially targeting the next 2 Standard deviation around 4200 $/oz .
It is possible Monday will open a gap up and will continue its way up all Monday long. Retracements will sure happen if Dollar index picks up.
The said fear can be alleviated by Powell's speech coming on October 15,2025 at 12:20 noon US time.

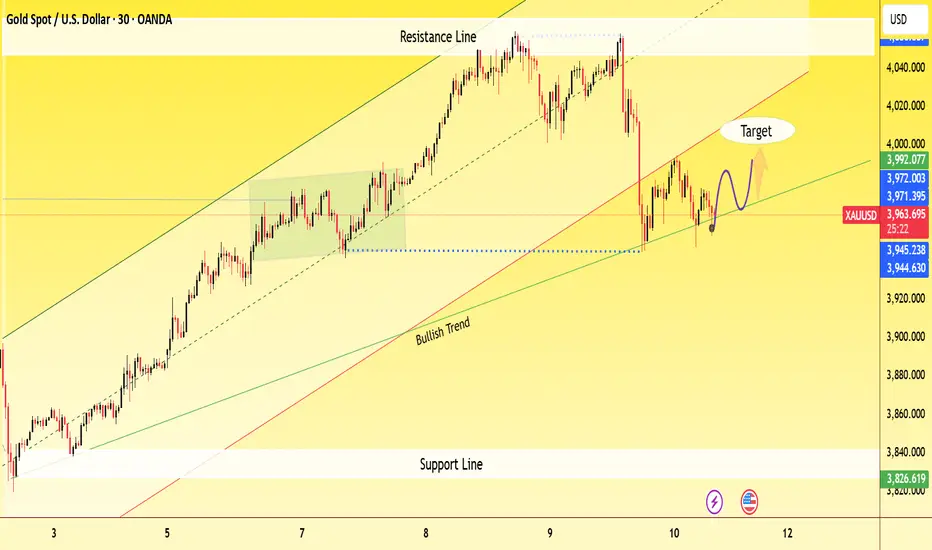
GOLD POISEDFOR BULLISH AS PRICE HOLDS ABOVE KEY TRENDLINE SUPPOR🧭 General Overview
Instrument: Gold Spot / USD (XAU/USD)
Timeframe: 30-minute
Current Price: 3,958.59
Trend: Overall bullish, but showing short-term correction
📊 Key Technical Elements on Chart
1. Bullish Trendline
The green upward trendline labeled “Bullish Trend” indicates that gold remains in a long-term uptrend.
Price is currently testing this bullish trendline — a crucial support area.
2. Resistance Zone
The resistance line near 3,992–4,000 marks the recent swing high where price was rejected.
Each approach to this zone triggered a pullback, indicating strong selling pressure ther
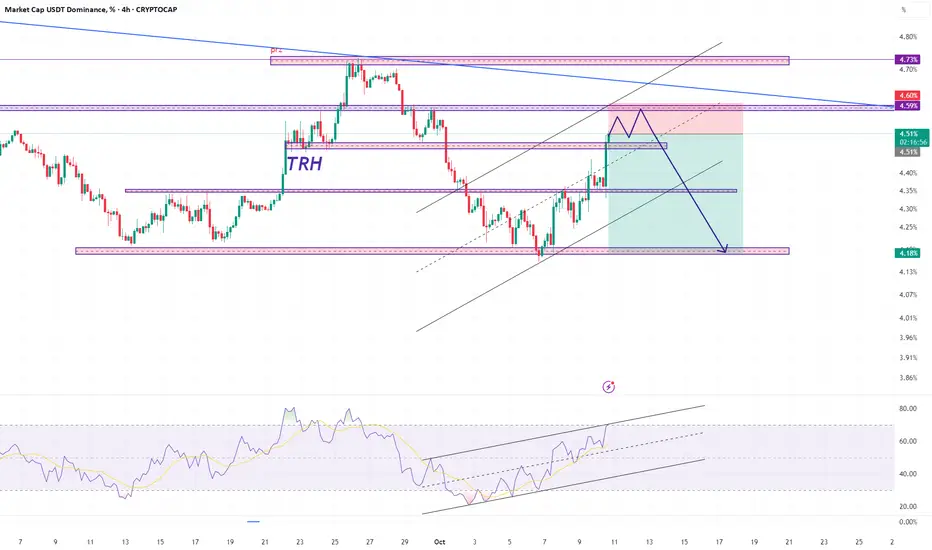
usdt.d 4hHello friends, I am Mehdi.
Given the area, we expect a price correction from this area trh.
Reasons:
We are in the area trh.
There is a possibility of approaching the channel ceiling and then correcting the price.
The resistance at 4.60 is a good place to buy.
I would like to thank you for supporting me by liking and commenting.
And please state your desired currency for analysis.
XAUUSD Long :) 15 MINI'm currently going long on XAU/USD on the 15-minute timeframe. The bullish trend has confirmed with a break of structure, and price has cleanly broken above the Asian session high. I'm targeting a 1:2 risk-to-reward ratio on this setup.
RISK MANAGMENT PLEASE

XAUUSD – Buy the Dip | Targets: $4,200 → $4,400+XAUUSD – Buy the Dip | Targets: $4,200 → $4,400+ 🟡
Gold is offering a textbook dip-buying opportunity within a strong bullish structure. Price is holding above key Fibonacci retracement levels, with smart money accumulation signaling strength beneath the surface. The immediate target is $4,200, with an extended projection toward $4,400+ as momentum builds.
📌 Stay aligned with the trend.
🧠 Fundamentals + technicals are in confluence.
#XAUUSD #Gold #BuyTheDip #TradingView #TechnicalAnalysis #SmartMoney #Fibonacci #ElliottWave #Commodities #Investing

Gold: high throw and bargain huntingGold showed a trend of "opening higher, moving lower, and then staging a weak rebound" on the day. It touched an intraday high of 3,994.22 per ounce and a low of 3,946.59 per ounce. After the opening, the gold price kept declining, and although it rebounded with support at the low level, it had not yet recovered the opening price. Currently, trading volume data indicates moderate market activity without obvious volume expansion signals, suggesting that the current oscillating trend may continue.
It is expected that the gold price will oscillate within the range of 3,940-4,000. If the US Dollar Index continues to surge and break through the resistance level of 99.5, the gold price may test the support at 3,940 again; if the US Dollar pulls back, the gold price is expected to surge above 3,995.
It is advisable to adopt a "high throw and bargain hunting" strategy within the range of 3,940-4,000, and strictly set stop-loss and take-profit levels with a suggested take-profit range of 8-12 and a stop-loss range controlled within 5-8, while avoiding blind chasing of rallies or selling on declines.
Buy 3950 - 3960
TP 3970 - 3980 - 3990
SL 3945 - 3942
Daily-updated accurate signals are at your disposal. If you run into any problems while trading, these signals serve as a reliable reference—don’t hesitate to use them! I truly hope they bring you significant assistance

GOLD PRICE ANALYSIS – SUPPORT RETEST BEFORE NEXT BULLISH MOVEChart Overview
Current Price: $3,973
Support Zone: $3,882 – $3,942
Target Level: $4,189
Channel Type: Ascending channel pattern (bullish structure)
📊 Technical Insights
Trend Structure
Gold is trading within a rising parallel channel, showing higher highs and higher lows.
The current pullback is approaching the lower boundary of the channel, a potential buy zone.
Support Area
The marked support zone ($3,882 – $3,942) aligns with both:
Channel support trendline
Previous structure lows (confluence support)
This makes it a strong potential reversal zone.
Possible Scenarios
Scenario A (Bullish Continuation)
Price bounces from the support zone and resumes upward momentum toward the target level at $4,189, representing a +6.23% move.
Scenario B (Deeper Correction)
Price briefly dips below the lower boundary before reclaiming it — forming a false breakout and then rallying higher.
Momentum Context
Short-term retracement is normal within an uptrend.
If candles show rejection wicks or bullish engulfing patterns around $3,900–$3,940,** it could confirm bullish continuation.
⚙️ Trading Plan Idea (Educational)
Buy Zone: $3,885 – $3,940
Target: $4,180 – $4,190
Stop-Loss (suggested): Below $3,870 (to protect against breakdown)
Risk–Reward Ratio: Approx. 1:3
📈 Summary
Gold remains bullish within its rising channel.
A short-term dip toward the support zone could offer a strong buy opportunity before the next push toward the $4,189 target.

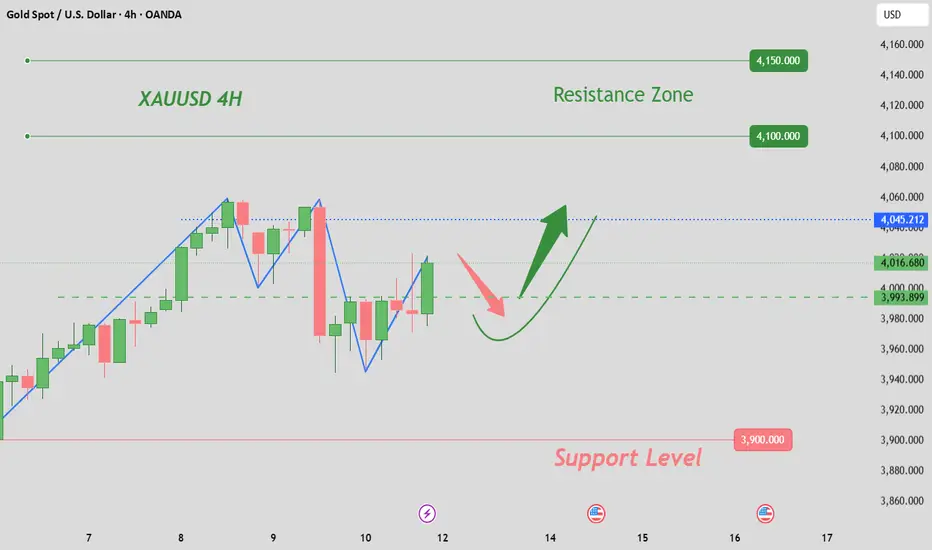
Gold (XAU/USD) Rebound Setup – Support Holding StrongAnalysis:
Gold (XAU/USD) is showing signs of bullish strength after testing the $4,000–$3,970 support zone, where buyers are stepping back in. The recent consolidation above support suggests a potential reversal and continuation of the uptrend.
The setup highlights:
Support Zone: Around $3,970 – $4,000, acting as a key accumulation area.
Bullish Trigger: A breakout above minor resistance could drive momentum higher.
Targets:
🎯 Target 1: $4,101
🎯 Target 2: $4,150
🎯 Target 3: $4,200
Stop Loss: Below $3,970 to protect against a downside breakout.
📈 Outlook: As long as price sustains above support, Gold remains bullish, aiming for a breakout towards $4,150 and $4,200 levels.

Gold: Long-short divergence is emergingGold exhibited a consolidative trend today, with the 4000-4050 range providing significant support. After touching an intraday low of 4001, prices rebounded sharply—indicating robust buying interest in this interval.
Resistance is concentrated between 4045-4050. While gold remains in a strong zone above 4000 in the short term, the rate of increase has narrowed compared to previous sessions. Long-short divergence is emerging, warranting caution against pullback risks following rallies.
Market expectations for a 25-basis-point rate cut by the Federal Reserve in November remain uncertain, and this ambiguity has led to the oscillating trend in Gold. If subsequent economic data (e.g., inflation and employment figures) reinforce rate cut expectations, the U.S. Dollar Index may weaken further, potentially allowing gold to break through the 4050 resistance level and advance toward the 4070-4100 range. Conversely, if rate cut hopes fade, prices may retrace to the psychological 4000 level to seek support.
Buy 4000 - 4010 TP 4020 - 4030 - 4040
Daily-updated accurate signals are at your disposal. If you run into any problems while trading, these signals serve as a reliable reference—don’t hesitate to use them! I truly hope they bring you significant assistance

GOLD Hello friends
Given that the price has reached the ceiling and recorded a new ceiling, we can expect a price correction. In this correction, we have identified important supports for you and it is expected that it will be able to succeed in setting a new ceiling.
*Trade safely with us*

Gold: Continue its rally to reach an all-time highGold has successfully stood firm above the key psychological level of 4000, continuing its rally to reach an all-time high. From the perspective of capital flows, although specific position data is lacking, the price-volume surge following the breakthrough,evidenced by both New York Gold and London Gold recording "rising prices with increasing trading volume" that confirms the continuous inflow of safe-haven funds. Additionally, the seasonal upward momentum of gold in October has not yet faded, and the momentum-driven uptrend continues, further strengthening the confidence of bullish investors.
The 4000-4050 range has been effectively broken through, and this former resistance level has now transformed into a short-term support level. If gold can maintain a stable position above 4050 in the subsequent sessions, the next target range can be set at 4100-4150. For short-term support, focus on the key psychological level of 4000; a breakdown below this level may trigger a pullback to the 3950-3980 range.
Buy 4010 - 4020 TP 4030 - 4040 - 4050
Daily-updated accurate signals are at your disposal. If you run into any problems while trading, these signals serve as a reliable reference—don’t hesitate to use them! I truly hope they bring you significant assistance

Gold: Reach a new highGold has successfully stood firm above the key psychological level of 4000, continuing its rally to reach an all-time high. From the perspective of capital flows, although specific position data is lacking, the price-volume surge following the breakthrough,evidenced by both New York Gold and London Gold recording "rising prices with increasing trading volume" that confirms the continuous inflow of safe-haven funds. Additionally, the seasonal upward momentum of gold in October has not yet faded, and the momentum-driven uptrend continues, further strengthening the confidence of bullish investors.
The 4000-4050 range has been effectively broken through, and this former resistance level has now transformed into a short-term support level. If gold can maintain a stable position above 4050 in the subsequent sessions, the next target range can be set at 4100-4150. For short-term support, focus on the key psychological level of 4000; a breakdown below this level may trigger a pullback to the 3950-3980 range.
Buy 4010 - 4020 TP 4030 - 4040 - 4050 SL 4000
Daily-updated accurate signals are at your disposal. If you run into any problems while trading, these signals serve as a reliable reference—don’t hesitate to use them! I truly hope they bring you significant assistance

XAUUSD on swing upside (currently holding Rangebound)XAUUSD is still maintaining the bullish streak Trapping the traders on intraday basis. I will buy gold on every dip till my Traget 4080
What will I do Today?
I'm watching XAUUSD although I took small buy trade at 4028 when market makes liquidity sweeps
-My target will be $4065 & 4080 In extension !!
Additional Tip:
4030-4025 us support area if H4 remains above then you can buy to our targets
If H4 closed below 4025 then market will test 3980.

Gold Trade Set Up Oct 8 2025Price has pushed well above PDH and created a new ATH once again so as long as the 15m support holds i will be looking for a BOS on the 15m and retest into a 5m/15m demand to take buys higher
www.tradingview.com

gold on sellThe price of XAUUSD has recently reached a new high of 4049, and we are currently awaiting a breakout below 4029 for a bearish confirmation. If the price breaks below 4027-4025, it is likely to target the lower price of 4020. If this target is achieved, it may be possible to retrace on a buy, but if the price breaks below 4018, it could potentially reach 3984. The stop loss should be set at 4040. If the price closes above 4050 on a long candle, it would be advisable to consider a buy.

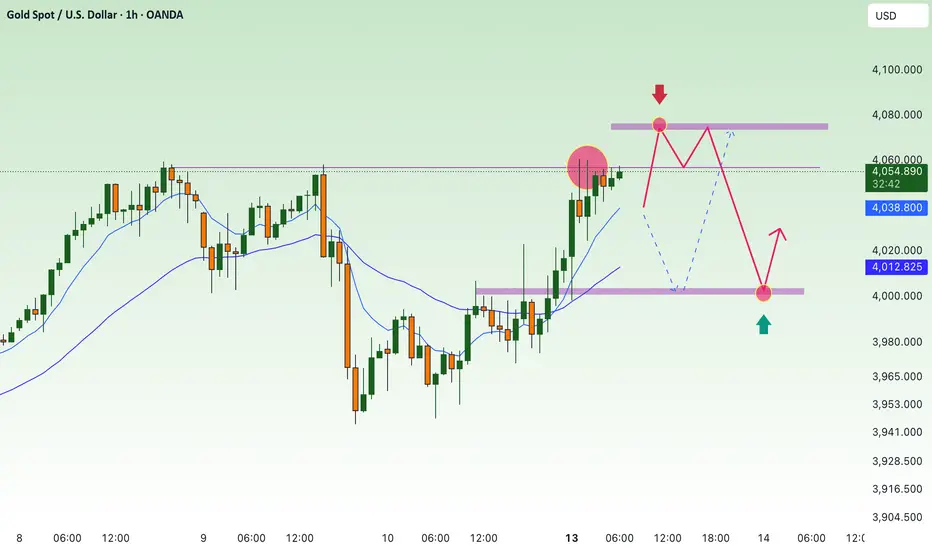
Gold Maintains Bullish Momentum Within Ascending ChannelAnalysis:
The XAU/USD (Gold Spot) 1-hour chart shows a strong upward trend within a well-defined ascending channel. Price action continues to form higher highs and higher lows, indicating sustained bullish momentum.
Currently, gold is trading near $3,959, staying comfortably above the trendline support, which has repeatedly acted as a dynamic base for buyers. The projected movement (blue arrow) suggests a potential short-term retracement toward the lower channel boundary, followed by a rebound toward the upper resistance zone around $4,000–$4,035.
As long as gold remains above the trendline, the bullish structure remains intact. A breakout above the upper boundary could signal further upside potential, while a drop below the trendline may lead to short-term consolidation.
Summary:
Trend: Bullish
Support: $3,915 – $3,925 (trendline zone)
Resistance: $3,995 – $4,035
Bias: Buy on dips near trendline support for potential continuation toward new highs.

XAU/USD Intraday Plan | Support & Resistance to WatchGold continues its strong bullish run, extending gains above 4000, with price now approaching the 4046 resistance level. Momentum remains firmly in buyers’ hands with no clear signs of exhaustion so far, although price is now moving into overextended territory following several strong impulsive moves.
If bullish momentum remains strong and buyers manage to break above the 4046 resistance, price may extend toward the 4064 level. However, failure to clear 4046 could trigger a pullback toward lower support zones.
Immediate support sits at the First Reaction Zone (4000–3970) — a natural area for a short-term pullback if price starts to cool off.
Deeper retracement zones are found around 3937 and 3909, where the broader uptrend could rebuild momentum should short-term profit-taking intensify.
📌Key levels to watch:
Resistance:
4046
4064
4080
Support:
4020
4000
3970
3937
3909
🔎Fundamental Focus | October 8, 2025
All eyes are on the FOMC Meeting Minutes later today, scheduled for 8:00 pm (GMT+2).
Despite the ongoing U.S. government shutdown, the Fed’s communications remain unaffected since it operates independently.
Several Fed officials — including Mester, Barr, Goolsbee, Logan, and Kashkari — are also speaking throughout the day, which could add volatility.
⚠️ Stay cautious — sentiment remains headline-driven amid the shutdown and multiple Fed speeches today.

"Gold 'Buy the Dip' Opportunity Targeting the $4,000 Level"
Technical Analysis
This is a classic bullish continuation setup. Here's a breakdown of the key elements:
Prevailing Trend: The chart shows a strong bullish impulse wave, indicated by the series of large green candles. This establishes the short-term trend as upward.
Corrective Pullback: After reaching a local high (around $3,980), the price is currently in a corrective phase, pulling back towards a potential support level. This is normal and healthy price action in an uptrend.
Support Zone: The red rectangle you've highlighted from approximately $3,950.00 to $3,956.00 is a well-defined area of potential support. This zone represents a previous level of consolidation and the base of the last major push upwards, making it a likely area for buyers to step back in.
Trade Idea: The projected path you have drawn suggests an expectation that the price will dip into this support zone, find buying pressure, and then continue its upward trajectory. This is often referred to as a "buy the dip" strategy.
