Gold Ascending Triangle Breakout - Targets $3,800+This chart is not only for trading, it’s also for educational purposes and shows a long-term trade setup. You can see how the triangle pattern works here.
On the monthly time frame chart shows a clear bullish structure: a rising lower-trendline (series of higher lows), a flat horizontal resistance across the highs (an ascending-triangle shape) and a breakout candle that closes above that horizontal resistance. That is a bullish monthly breakout => the path of least resistance is upward while the breakout holds. (Market context: gold was hitting fresh lifetime highs around 22 Sep 2025 as Fed easing hopes and safe-haven flows supported the move.
Price structure & pattern (what the chart is telling you)
Pattern: the formation is an ascending triangle — horizontal (flat) highs vs. rising lows. This pattern is bullish because buyers progressively step in at higher prices against a persistent overhead supply line. The measured-move technique for triangles (height of the pattern added to the breakout) is a standard way to estimate a conservative target.
Trend: monthly trend is bullish — higher highs and higher lows inside a rising channel drawn above and below price. The breakout out of the triangle also cleared the upper channel midline, increasing odds of a run to the upper channel boundary.
Confirmation to watch: a monthly close back below the breakout level and the rising trendline would weaken the bullish case.
Practical Measured Target
Using the measured-move method gives a conservative first target:
Example estimate from the chart: take the triangle height ≈ (resistance ~3,450) − (swing low ~3,100) = 350. (3,450 − 3,100 = 350).
Add the height (350) to the breakout level (~3,450) → 3,450 + 350 = 3,800 as the first measured target; extension toward the top of the longer-term channel puts price into the ~3,900–4,000 neighborhood if momentum continues. (This is the standard target method — actual numbers depend on the exact points you measure on the chart).
Key levels
Immediate resistance / near-term targets: 3,700–3,900 (measured target and channel top).
Immediate support (first line): the breakout zone / prior flat resistance (now support) — roughly 3,350–3,450 on the chart.
Secondary support: rising lower-trendline / channel mid — roughly 3,100–3,250.
Strong structural support well below: 2,700–2,800 (major prior lows and horizontal red lines on the chart).
Use these as rules-of-thumb zones: if price reclaims and holds the breakout zone, bulls remain in control; if price closes monthly back below the rising trendline, the bullish pattern has failed.
Macro drivers & why the breakout matters now
Interest-rate expectations and real yields are the dominant macro drivers for gold: falling real yields (and expectations of Fed rate cuts) make gold more attractive, and the 2025 rally has been powered by that dynamic. Central-bank buying, geopolitical uncertainty and demand flows are additional tailwinds.
U.S. dollar: gold usually trades inverse to the DXY. Around the breakout date the dollar was not significantly stronger (DXY in the high-90s), which removes a major headwind for gold’s advance. If the dollar weakens further, that amplifies an upside path for gold; if the dollar rallies strongly, it increases the chance of a corrective pullback.
Scenarios (how to think about probabilities)
Bull case (highest probability while breakout holds): price follows measured-move to the ~3,800 region and then challenges the upper channel toward ~3,900–4,000 as momentum and lower real yields continue.
Base case (consolidation): a breakout retest — price dips back to the breakout zone (~3,350–3,450), finds buyers, then resumes uptrend (this is healthy and common).
Bear case (pattern failure): monthly close back under the rising trendline (and below ~3,100) — that would open a deeper correction toward 2,900–2,700 and reduce the bullish edge.
Trade plan and risk management (long-term investors vs traders)
Long-term investor (multi-year): if you believe in the macro thesis (lower real yields, central bank demand), holding through volatility is reasonable; consider layering in on pullbacks to the breakout zone (~3,350–3,450) with wider stops and position sizing for multi-year exposure.
Tactical trader (swing/position): the conservative trade is to wait for a breakout retest to the former resistance (buy on confirmed support hold). Entry zone: ~3,350–3,450 with a stop below the rising trendline (e.g., below ~3,100 in the chart) and targets at measured-move (~3,800) and then the channel top (~3,900–4,000). If you prefer momentum entries, a clean monthly close above the breakout with continued follow-through on the next monthly candle is a valid trigger, but tighten stops.
Always size positions so a failure (close below the rising trendline) does not blow you out — place stop levels outside normal monthly noise.
Extra checks (what to watch next)
Watch U.S. inflation prints, Fed commentary and the 10-year real yields — those will be the largest macro switches that could change the story.
Watch DXY moves: a durable dollar rally would increase the odds of a deeper retracement.
On the chart: volume/flow confirmation on the breakout (higher volume on breakout is healthier); monthly-MA alignment (longer MAs acting as support) — these help confirm sustainability.
One-line conclusion
Monthly chart shows a classically bullish ascending-triangle breakout with a conservative measured target near ~3,800 and upside extension possible toward ~3,900–4,000 if macro drivers (falling real yields, Fed easing expectations, weak dollar) remain supportive; a monthly close back below the rising trendline (~3,100 area on the chart) would invalidate the bullish scenario.
Note
Please risk management in trading is a Key so use your money accordingly. If you like the idea then please like and boost. Thank you and Good Luck!
Xauusdlong

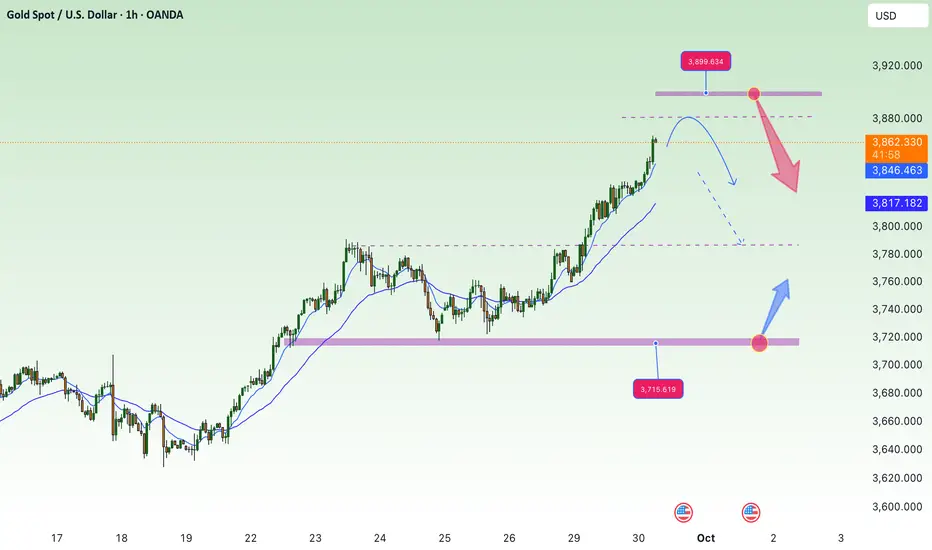
XAU/USD – Bulls Eyeing Breakout Toward 3,820From my point of view, Gold (XAU/USD) is showing signs of strength after rejecting support levels multiple times. The chart highlights a clear horizontal range where buyers have consistently stepped in around the 3,713 – 3,720 zone. This area is acting as a strong base, signaling that demand is present whenever price dips lower.
On the other side, resistance near 3,780 has been tested several times, and each rejection has been weaker than the last – which often signals that sellers are losing control. A breakout above this zone could unleash a strong impulsive rally.

Bulls continue to increase prices, creating new ATH⭐️GOLDEN INFORMATION:
With little on the US calendar, Fed officials dominated headlines on Monday. St. Louis Fed President Alberto Musalem repeated his hawkish stance, warning that inflation expectations remain elevated despite rising risks of labor market weakness. New York Fed President John Williams noted that policy is restrictive enough to pressure inflation lower, while the labor market shows gradual signs of softening. Meanwhile, Cleveland Fed President Beth Hammack stressed that inflation is still too high and blamed tariffs for stalling the disinflation process.
⭐️Personal comments NOVA:
Markets are positive, rising after expectations of a rate cut in October increased.
⭐️SET UP GOLD PRICE:
🔥SELL GOLD zone: 3900- 3902 SL 3907
TP1: $3890
TP2: $3880
TP3: $3870
🔥BUY GOLD zone: $3819-$3817 SL $3812
TP1: $3828
TP2: $3840
TP3: $3850
⭐️Technical analysis:
Based on technical indicators EMA 34, EMA89 and support resistance areas to set up a reasonable BUY order.
⭐️NOTE:
Note: Nova wishes traders to manage their capital well
- take the number of lots that match your capital
- Takeprofit equal to 4-6% of capital account
- Stoplose equal to 2-3% of capital account
Gold Trade Secured 150 PipsOur buy set up this morning played out perfectly bouncing off the 15m demand targeting the swing high
www.tradingview.com

GOLD ON SIDEWAY UNTIL BREAKOUT#XAUUSD price have formed new high, now we await for breakout above 3831.5 to continue bullish till 3872 target, stop loss at 3815.
But price failing to break above and retest below 3815 then we have short target of 3805-3791.
The curve shows continue on bearish if the H1 closes below 3791.

Plan day: 29-sep 2025 Related Information:!!!
U.S. inflation, as measured by the Personal Consumption Expenditures (PCE) Price Index, rose to 2.7% year-on-year in August from 2.6% in July, the Bureau of Economic Analysis reported on Friday. The figure was in line with market consensus. Meanwhile, the core PCE Price Index, which excludes volatile food and energy prices, increased 2.9% year-on-year in August, matching both the July pace and analysts’ estimates. On a monthly basis, headline PCE and core PCE rose 0.3% and 0.2%, respectively.
Markets are currently pricing in nearly an 88% probability of a Fed rate cut in October and a 65% chance of an additional cut in December, according to the CME FedWatch Tool. Lower interest rates could reduce the opportunity cost of holding Gold, thereby supporting the non-yielding precious metal.
personal opinion:!!!
Gold extends gains, targeting $3,850.

XAUUSD Has Left the buildingOn the way up, we first found support at the L-MLH (1).
Then the Centerline stepped in as resistance (2), but it eventually couldn’t hold price down.
Eating through the Centerline like a mouse through cheese, price found support again at (2) before blasting upward to the U-MLH — and quickly through it.
Once again, the U-MLH turned from prior resistance into fresh support.
From there, price mirrored (2), moving sideways before blasting off to the moon! 🚀
I’m surprised that WL1 offered no resistance at all.
Now that we’ve left WL1 behind, WL2 is the next target.
Watching the show patiently.

Gold Trade Secured 600 pips!On friday price made a HH/HL on the 1h so i was expecting a continuation higher as long as price made HL which it did so i bought at a 15m demand zone which played out perefectly securing 600 pips
www.tradingview.com

Gold price increase - towards 3825⭐️GOLDEN INFORMATION:
Gold (XAU/USD) hovers near $3,800 in Monday’s Asian session, supported by in-line US inflation data that reinforced expectations of further Fed rate cuts this year. Geopolitical uncertainty also underpins safe-haven demand, though upcoming remarks from several Fed officials could sway the Dollar and limit gains for bullion.
⭐️Personal comments NOVA:
continue to rise - above 3790 and hit 3825 resistance today
⭐️SET UP GOLD PRICE:
🔥SELL GOLD zone: 3825- 3827 SL 3832
TP1: $3817
TP2: $3808
TP3: $3792
🔥BUY GOLD zone: $3759-$3757 SL $3752
TP1: $3770
TP2: $3780
TP3: $3790
⭐️Technical analysis:
Based on technical indicators EMA 34, EMA89 and support resistance areas to set up a reasonable BUY order.
⭐️NOTE:
Note: Nova wishes traders to manage their capital well
- take the number of lots that match your capital
- Takeprofit equal to 4-6% of capital account
- Stoplose equal to 2-3% of capital account

“Gold (XAU/USD) – Breakout Play from Resistance (1-Hour ViewChart Structure & Key Levels
You’ve drawn a resistance zone above current price. The label “this is the resistance area here if break we will hold” points to a horizontal resistance line or zone.
You also show a descending trendline acting as dynamic resistance.
On the lower side, you mark LL (Lower Low) and LH (Lower High) points, implying the prior structure was in a downtrend or consolidation.
Your trade setup (green = target area, red = stop area) suggests you are expecting a break above resistance and a move upward with three target levels:
• TP1 at ~ 3,759.74
• TP2 at ~ 3,779.03
• TP3 at ~ 3,799.67
What Your Setup Implies (and Risks)
Bullish Bias on Breakout
You are expecting that if price breaks above the resistance zone + trendline, that resistance may flip into support, allowing the price to rally further. This is a classic breakout reversal expectation.
If the breakout is confirmed (with strong candle close above, ideally with volume), then the path is “clearer” for your targets.
Stop / Risk Control
Your red zone (stop area) is placed below the resistance/trendline region. If price fails and falls back below this, your trade idea would be invalidated.
Target Levels Logic
TP1 is relatively conservative, just above resistance.
TP2 and TP3 stretch further to capture the upside momentum if the breakout has strength.
Additional Considerations & Technical Tips
Confirm the Breakout
Don’t just enter on a quick wick above resistance. Wait for a sustained close above the zone (on your timeframe) to reduce the chance of a false breakout.
Check volume: higher-than-average volume on the breakout gives it more credibility.
Watch for Retest
Often after a breakout, price returns to retest the broken resistance (which now may act as support). This retest can offer a better entry with lower risk.
Manage Risk Aggressively
The more distant your TP3, the more room for price to reverse. Consider scaling out of the trade (taking partial profits as price hits TP1, TP2) to lock in gains.
Keep an Eye on Macro / Fundamental Factors
Gold (XAU/USD) is sensitive to U.S. monetary policy, the strength of the U.S. dollar, inflation expectations, and geopolitical risk.
For example, stronger U.S. data or hawkish Fed statements could work against a bullish breakout in gold.
Divergences & Momentum Indicators
Use RSI / MACD / ADX to check whether momentum supports your breakout idea. If momentum is weak or showing divergence, be cautious.
Timeframe Alignment
Make sure that higher timeframes (4H, daily) are not giving strong bearish signals conflicting with your breakout bias on the 1-hour chart.


Gold weekly setup for new athThis chart shows a 1-hour analysis of XAU/USD (Gold vs. US Dollar).
Price is currently around $3,759, slightly above the key support trend line.
Important support levels are marked near $3,755, $3,735, and $3,723, where buyers may step in.
The short-term bullish scenario points to a possible rebound from support toward the $3,800 target, with a continuation higher to a new all-time high at $3,817.
If the price fails to hold above the support zone, it could retest lower levels before resuming an upward move.
Overall, the outlook suggests bullish momentum remains strong, with buyers targeting $3,800–$3,817, but the market may experience pullbacks before continuing higher.

Gold Bulls Eyeing $3,800+ – Key Buy Areas RevealedGold is currently holding inside a rising channel structure after making an ATH near $3,790. The market has pulled back from the high and is consolidating around key trendline support. The immediate buy area lies near $3,730–$3,740, which also aligns with the trendline support. A deeper dip towards $3,710–$3,715 could offer a stronger buy trigger zone if price retests.
On the upside, gold will likely revisit the $3,790 ATH, and a sustained move above this level may extend towards $3,800–$3,820 in the coming sessions. Overall, the market bias remains bullish as long as price holds above the $3,710–$3,692 support region, with consolidations and pullbacks seen as part of the broader upward trend.
🔑 Key Levels to Watch:
- Resistance: $3,760–$3,765
- Support: Immediate support $3,730 and strong support $3,710–$3,715
📌 Buy Zone & Buy Trigger:
- Buy Zone: $3,720–$3,730
- Buy Trigger: The buy trigger area is $3,760–$3,765, where a breakout above the descending resistance from the ATH would indicate renewed bullish momentum.
Note
Please risk management in trading is a Key so use your money accordingly. If you like the idea then please like and boost. Thank you and Good Luck!

Gold Analysis – Weekly Outlook (Sep 28, 2025# Gold Analysis – Weekly Outlook (Sep 28, 2025)
On the **15M timeframe**, price action is showing clear liquidity structures:
- **Buy-side liquidity** targeted around **3796 – 3781** zone.
- The market created an **ABC corrective move**, with an **inducement** before liquidity grab.
- After the liquidity sweep, a potential **CHOCH** signals possible bearish continuation.
- Price could retrace lower to fill liquidity gaps, with the next demand zone near **3745 – 3736**.
- Below that, further downside liquidity sits around **3730 – 3720**.
### Key Levels:
- **Upside liquidity:** 3796 / 3781
- **CHOCH confirmation:** ~3761
- **Downside targets:** 3745 → 3736 → 3720
### Trading Plan:
If liquidity at **3796 – 3781** is swept and **CHOCH** confirms, we could expect a bearish leg towards the downside liquidity levels.
📊 Structure aligns with Smart Money Concept (SMC) approach: liquidity sweep → inducement → CHOCH → BOS → continuation.

𝐌𝐓𝐗 | Pitstop Zone to Continue the 1,300 Pip Potential Rally1️⃣ Key Levels
• 729 – 737 → Major golden support zone.
• 759 – 760 → Key resistance / breakout trigger.
• 691 – 683 → Strongest potential buy zone of the week.
⸻
2️⃣ Expected Scenarios
• Bearish:
• 4H close below 759 → retest of the 729–737 support zone.
• 4H close below 729 → extension toward 709 → 700 → 691.
• Zone 691–683 is the most important potential reversal area this week, with multiple confluences, possibly triggering a strong rally toward the 3800 high again.
• Bullish:
• 4H close above 760 → continuation toward 780 → 791.
• 4H close above 792 → further bullish momentum targeting 808 → 817 → 830.
⸻
⚖️ Summary
The market is positioned between critical zones:
• Holding above 759–760 confirms strength toward 830.
• Breaking below 729 increases the probability of testing the 691–683 demand zone, which could be the week’s strongest reversal setup.

Plan 28-sep-2025Related Information:!!!
Federal Reserve Governor Stephen Miran told Fox Business on Thursday that there is no clear evidence of tariff-driven inflation, but it appears to be holding back policymakers. The economy is more vulnerable to downside shocks because Fed policy is too tight, and that policy is restraining by 200 basis points, Miran added.
Separately, Chicago Fed Governor Austan Goolsbee noted that the labor market seems to be cooling, but inflation is rising, and relying on inflation being temporary makes him uneasy. Goolsbee said interest rates could come down a bit further if inflation moves toward 2%, but he is also cautious about cutting rates too soon, stressing that inflation must be brought back to the 2% target.
personal opinion:!!!
XAUUSD sideway 3750-3780, breakeven 3780 then 3800(ATH)

Gold XAUUSD Weekly Analysis 28 Sept to 2 Oct 2025Gold is currently trading at a decisive level where the weekly structure is hinting at a potential shift. After a strong bullish run, price tested the 3785–3800 zone but failed to sustain, forming a double top/M pattern and rejecting strongly from this supply area. The rejection has now pushed gold back into the crucial support zone of 3725–3733, which is a make-or-break level for the next swing move. If this support holds firm and we get a strong H4 close above it, buyers could regain momentum, opening the door for a bullish continuation towards 3780–3800, where the previous rejection zone lies. This would keep the broader bullish structure intact. On the flip side, if the market fails to hold this level and breaks below 3725 decisively, we can expect further downside towards the next demand zone at 3650–3660, which served as an earlier accumulation area. Overall, swing traders should treat 3725/33 as the key inflection point: above it, gold looks poised to retest the highs, while a breakdown could trigger a deeper correction into lower support levels.

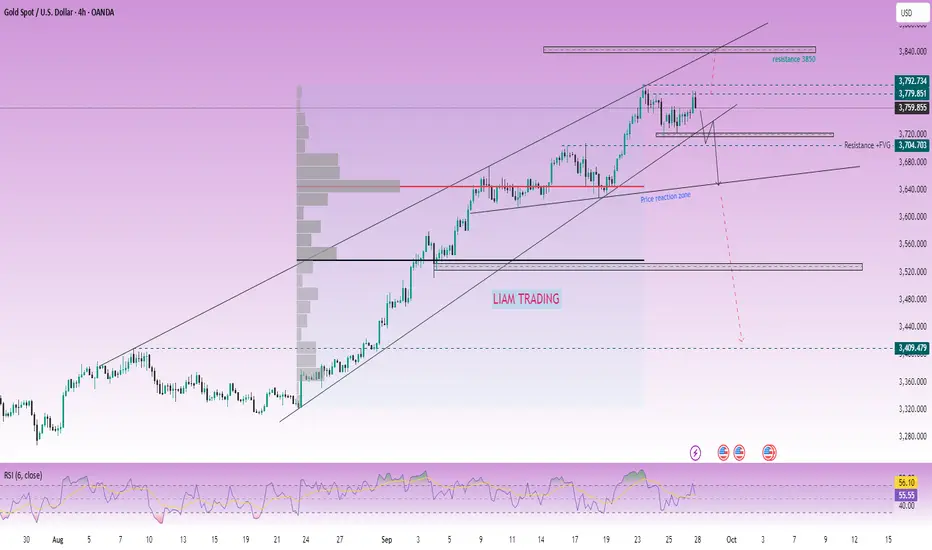
LiamTrading – Mid-term Gold Outlook H4Let's prepare the scenario for the new week, everyone!
In my opinion, gold next week might start to show a mid-term correction phase. However, it is important to note that nothing is absolutely certain on a larger time frame. If you're trading short-term within the day, closely follow price action to ensure higher accuracy.
Gold closed the weekly candle at 3759.85 – a price point clearly reflecting hesitation. The end-of-week session showed resistance to price increases, mainly due to profit-taking pressure, so it's too early to confirm that a downtrend will begin.
The upward price channel is strong, so it's still necessary to think in line with the market's upward trend to ensure the mindset of holding profits remains firm.
The upward structure is still stable, but the RSI has indicated a weakening in buying sentiment. To confirm a mid-term correction, gold needs to break 3720. At that point, a reasonable strategy would be to wait to sell around 3737–3740 (retracing to the trendline), with the target being the support area coinciding with the highest volume profile cluster at 3645.
Conversely, the buying scenario will occur when:
- Price touches the 3735 boundary and shows a candle rejection reaction.
- Or gold breaks above the minor resistance at 3780, then you can buy immediately, with the expectation of heading towards the 3850 area.
Next week, be patient and wait for market confirmation to increase the probability of winning. I will continue to share detailed scenarios in each trading session for everyone to stay updated.
Gold price accumulates around ATH 3790✍️ NOVA hello everyone, Let's comment on gold price next week from 09/29/2025 - 10/03/2025
⭐️GOLDEN INFORMATION:
Gold climbs as PCE data reinforces Fed easing bets, with the core index holding below 3%. Market sentiment stays upbeat despite weaker Michigan Consumer Sentiment, as inflation expectations point to gradually easing price pressures and lingering concerns over the labor market.
⭐️Personal comments NOVA:
The bulls continue to try to break through ATH and increase the price. The momentum of interest rate reduction in the next rounds in 2025
🔥 Technically:
Based on the resistance and support areas of the gold price according to the H4 frame, NOVA identifies the important key areas as follows:
Resistance: $3812, $3832
Support: $3727, $3697
🔥 NOTE:
Note: Nova wishes traders to manage their capital well
- take the number of lots that match your capital
- Takeprofit equal to 4-6% of capital account
- Stoplose equal to 2-3% of capital account
- The winner is the one who sticks with the market the longest

Gold Trade Setup - 27/Sep/2025Hi Traders,
I am biased for further upside in Gold.
The first trade that I will be looking for is from the highlighted zone and the price is already testing it.
If price corrects here , then I will expect it to drop further to the next marked POI.
Please follow me and like if you agree or this idea helps you out in your trading plan.
Disclaimer : This is just an idea. Please do your own analysis before opening a position. Always use SL & proper risk management.
Market can evolve anytime, hence, always do your analysis and learn trade management before following any idea.

XAUUSD Delivered Excellent profits Thanks to those who followed, trusted me, and made profits 210 pips delivered
As I mentioned in today’s commentary session:
• I took buy trades if H4 candle closes above 3760., and I’m expecting the market to test the 3785 benchmark with an extension towards 3830.
My strategy was to buy the dips, and I’m very happy with the profits so far – .
My first target (3782) is achieved, Alhamdulillah.

XAUUSD on range aiming 3930 on mark!!XAUUSD in Accumulation zone 3730-3760 area.
My stance on XAUUSD?
-First point of buying will be 3730-3725 area , H1 -H4 candle closes above it , my target will be 3785.
- Secondly if H4 candle closes above 3760 then I will took buy as well and target Target will be 3830.
Additional Tip :
On the otherhand, the 3690–3700 supply zone is the perfect buyying opportunity aiming target 3830.
On long term I'm watching gold at 3930!!

Gold Trade SetupI will risk!!!
It seems we are near at the end of correction wave...
The first target R/R is 2 and the second is 4...
