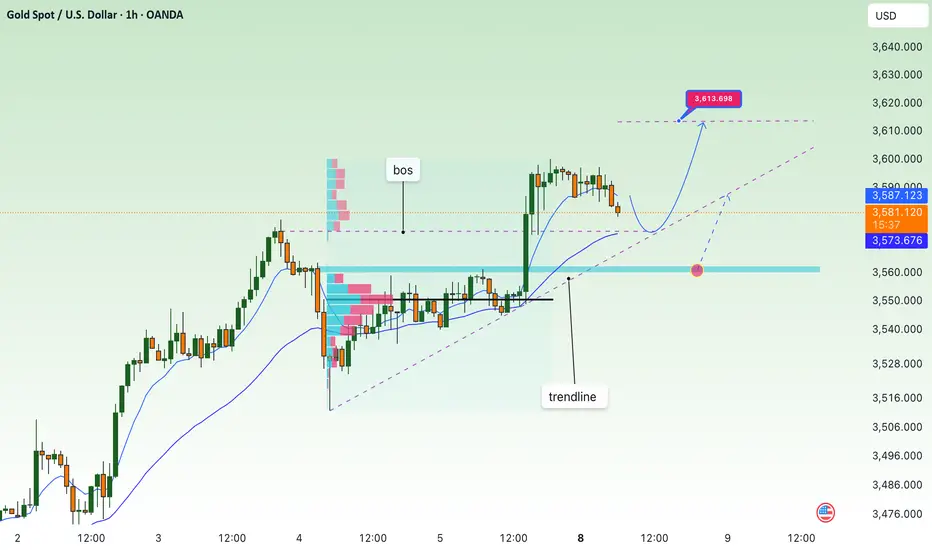
Gold Price Outlook – Key Levels & Buy TriggerGold (XAUUSD) is holding its bullish structure within the upward channel, currently trading near 3531 after testing key support. The main buy zone lies between 3511–3524, where Fibonacci support and channel trendline align. A confirmed bounce and close above 3537 would trigger fresh buying momentum, targeting 3578, followed by 3619 and 3644. The overall trend remains bullish as long as 3511 holds, while a break below 3470 would weaken the outlook.
🔑 Key Levels to Watch:
- Immediate Support: 3511 – 3524. A strong confluence with the channel support makes this the main buy zone.
- Immediate Resistance: 3537, 3578
- Major Upside Targets: 3619, 3644
Invalidation: 3470 (previous swing low). If broken, the trend may weaken toward 3450.
Buy Zone: 3511 – 3524 (Fibonacci 0.618 & 0.5 retracement + channel support).
Buy Trigger: Bullish rejection or H1 close above 3537 confirming strength for upside continuation.
Note
Please risk management in trading is a Key so use your money accordingly. If you like the idea then please like and boost. Thank you and Good Luck!
Xauusdlong

short correction, continue to create new ATH⭐️GOLDEN INFORMATION:
Gold (XAU/USD) consolidates near record highs just below $3,600 on Monday, pausing after Friday’s surge. A modest US Dollar rebound and upbeat equity sentiment cap gains, though expectations of aggressive Fed rate cuts and continued central bank buying underpin the metal. Overbought conditions may limit fresh upside ahead of key US inflation data later this week.
⭐️Personal comments NOVA:
Selling pressure, short-term profit taking at ATH 3600. Gold price adjusted down to accumulate for the upcoming big uptrend.
⭐️SET UP GOLD PRICE:
🔥SELL GOLD zone: 3612- 3614 SL 3619
TP1: $3600
TP2: $3590
TP3: $3580
🔥BUY GOLD zone: $3563-$3561 SL $3556
TP1: $3570
TP2: $3580
TP3: $3590
⭐️Technical analysis:
Based on technical indicators EMA 34, EMA89 and support resistance areas to set up a reasonable BUY order.
⭐️NOTE:
Note: Nova wishes traders to manage their capital well
- take the number of lots that match your capital
- Takeprofit equal to 4-6% of capital account
- Stoplose equal to 2-3% of capital account
Gold hourly outlookHello, good day,
1H timeframe and personal outlook along with invalidation levels:
The structure is still bullish; we are at the liquidity high, and the 1H buyers’ TP has not yet been touched. (As long as the 1H candle does not close and confirm below 3548, the defined TP for 1H buyers will remain 3606).
Therefore, it can be assumed that from the marked breaker block zone, or with a slight hunt around the 3553 area, a buy trigger could appear for a liquidity grab at the high.
For the invalidation condition: if the 1H candle comes from any of these three support zones toward the high, it should not close above 3600–3606. If it only hunts liquidity, then we can consider the continuation of the move down to the internal liquidity hunt (internal choch). From there, one could again look for a buy trigger, with the 3503 level under the internal choch acting as support.
Personally, I’m watching the breaker block, 3553, and 3543 for buys at the beginning of next week to see how the market reacts to the high

**"Gold Price Rebounding from Support:Potential Move Toward 3436This chart shows the **price movement of Gold (XAU/USD)** on a **daily timeframe**.
### Key Points:
* **Support Zone** : Around **\$3,266**, this is the area where price has bounced up multiple times, meaning buyers step in here.
* **Resistance Line**: Around **\$3,436**, this is the level where price has been rejected before, meaning sellers are strong here.
* **Current Price**: Around **\$3,293**.
### What the Chart Suggests:
* Price is near the **support** zone again.
* If the support holds, the green arrow shows a possible move **upward**.
* Price may first move up slightly, pull back, and then try to **break above resistance** at \$3,436.
Gold is in a sideways range. It's near a strong support level and might go up from here toward the resistance level, as shown by the green line.

Gold Targets $3,600 After Strong BreakoutAnalysis:
Gold (XAU/USD) continues its bullish rally after breaking above the buy zone near $3,440 and holding strong momentum. The market has recently made higher highs, with price consolidating slightly below the resistance zone.
Currently, gold is trading at $3,548, with the short-term target identified at $3,600. The chart suggests potential consolidation in the highlighted area before another upward push. The SMA (9) at $3,552 is acting as dynamic support, keeping the bullish bias intact.
If buyers maintain control, a clear breakout above $3,552 – $3,560 could confirm a move toward $3,600 – $3,604. However, if momentum weakens, support lies at $3,511 and $3,499, with a deeper pullback possible toward the $3,440 buy zone.
Overall, the sentiment remains bullish, and gold looks positioned to test the $3,600 psychological resistance in the near term.

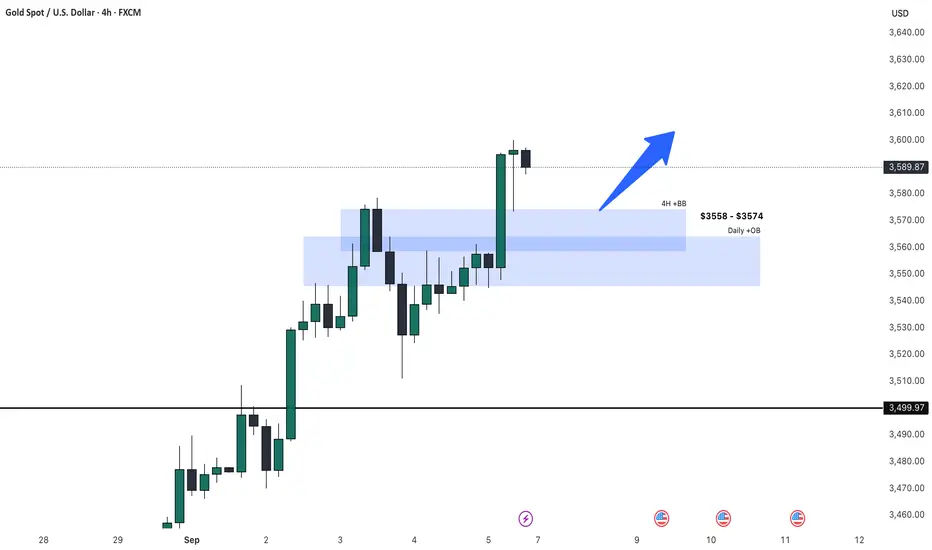
Gold Trade Idea for the Week [Sept 8-12]Last week, we continued momentum upwards, and see no retracement for an entry, expect to look at lower timeframes for Long entries, and do not trade Short.
On Friday NFP, the daily candle has ended with an engulfing over Thursday's bearish candle and I would look around $3558 - $3574 for a Long.
Trade safe & have a good week!
Gold Trade Set Up Sep 5 2025OANDA:XAUUSD
www.tradingview.com
Price has created a new ATH again due to NFP and is making HH/HL so i want to see a pullback and test of 15m FVG before a continuation higher

Gold Price Analysis – Testing Resistance near Sell ZoneAnalysis:
Gold (XAU/USD) is currently trading around 3,551.40, showing minor intraday losses (-0.03%). The chart indicates a strong resistance zone between 3,556–3,563, identified as the “sell zone,” with an All-Time High (ATH) slightly above at 3,578.12. Price is consolidating beneath this resistance, struggling to break higher.
The Fair Value Gap (FVG) below suggests a potential retracement toward 3,511–3,520 if sellers gain momentum. The Ichimoku cloud shows mixed signals, with price hovering around the equilibrium, indicating indecision in the short term.
A break above 3,563 could trigger bullish continuation toward ATH, while rejection at this level may lead to a pullback into the highlighted FVG region.

Gold prices are still supporting price increases⭐️GOLDEN INFORMATION:
Gold (XAU/USD) inches higher in Friday’s Asian session, extending its rebound from the $3,500 level and staying close to this week’s record highs. Expectations of at least two Fed rate cuts this year, starting in September, keep the US Dollar subdued and support the safe-haven metal, while trade tensions add to its appeal. However, upbeat risk sentiment and overbought conditions could cap gains as traders await the US Nonfarm Payrolls report later today for fresh cues on Fed policy.
⭐️Personal comments NOVA:
The market is expecting continued good news for gold, rate cuts and gold hitting above 3600.
⭐️SET UP GOLD PRICE:
🔥SELL GOLD zone: 3600- 3598 SL 3605
TP1: $3585
TP2: $3568
TP3: $3552
🔥BUY GOLD zone: $3482-$3484 SL $3477
TP1: $3490
TP2: $3500
TP3: $3510
⭐️Technical analysis:
Based on technical indicators EMA 34, EMA89 and support resistance areas to set up a reasonable BUY order.
⭐️NOTE:
Note: Nova wishes traders to manage their capital well
- take the number of lots that match your capital
- Takeprofit equal to 4-6% of capital account
- Stoplose equal to 2-3% of capital account

Gold Trade Set Up Sep 4 2025OANDA:XAUUSD
www.tradingview.com
Price is making HH/HL, swept PDL, closed above it and also swept SSL on the 15m so as long as we stay closed above i will look for buys back to PDH

Gold/XAUUSD Intrday Move 04.09.2025Gold is currently trading near 3539, after retracing into yesterday’s demand zone at 3526–3531. This zone has shown strong reactions previously and continues to hold as a key level for buyers.
🔑 Key Reasoning
Demand Zone: Price is retesting 3526–3531, a strong support area where buyers previously stepped in.
Bullish Continuation Bias: The broader structure remains bullish, and as long as this zone holds, the outlook favors continuation to the upside.
Confirmation Level: A decisive close above 3542 would confirm bullish momentum and open the way for further upside.
Invalidation: A break below 3511 (recent low) would invalidate the bullish setup and shift bias to neutral/short-term bearish.
🎯 Trade Plan
Entry: Buy from 3526–3531 demand zone.
Confirmation: Add positions if price closes clearly above 3542.
Stop-Loss: Below 3511 (recent low).
Targets:
First target: 3578 (recent swing high).
👉 Summary: Bias stays bullish above 3526–31 demand zone. A clean break above 3542 strengthens the case for continuation toward 3578, with invalidation below 3511.

Gold (XAUUSD) – 4 Sep | Bullish Bias, Watching 3547–3541 POI🟡 Gold (XAUUSD) Analysis – 4 September
Market Overview
Gold printed a fresh all-time high yesterday at 3578.6 , confirming the strength of the ongoing bullish trend.
The higher-timeframe structure ( H4 ) remains firmly bullish, with a clear series of higher highs and higher lows.
On the M15 chart, price action is in a healthy pullback phase — a normal reaction after such an extended bullish impulse.
Context
This pullback is currently resting inside the M15 Point of Interest (POI) zone at 3547.6–3541.5 .
This is a high-probability area for price to stabilize, build liquidity, and potentially set up for the next bullish leg.
What We’re Watching
🔹 3547.6–3541.5 (M15 POI Zone)
If this zone holds and price confirms strength on lower timeframes (micro-ChoCH / BoS), it can offer a clean long setup toward new all-time highs.
This would keep price in alignment with the higher-timeframe bullish structure.
If the zone fails and price breaks below with strength, we will stand aside and reassess structure for fresh demand areas before looking for long opportunities again.
Execution Plan
✅ Wait patiently for confirmation before entering — no impulsive buys inside the zone.
✅ Look for a shift in lower-timeframe structure that signals strong buyer presence.
✅ Manage risk strictly (our approach: 40 pips SL, 120 pips TP for a fixed 1:3 R:R).
Bias for Today
📈 Bullish Only — until this key zone is broken with conviction, H4/M15 structure continues to favor upside continuation.
Patience and precision are key — let the market confirm its intention before committing to a position.
📘 Shared by @ChartIsMirror

Closing my Trades in [ 300 pips profits ]Thanks to those who followed, trusted me, and made profits.
As I mentioned in today’s commentary session:
• I took buy trades around 3535–3533, and I’m expecting the market to test the 3565 benchmark, with an extension towards 3575.
My strategy was to buy the dips, and I’m very happy with the profits so far – .
My first target (3565) is achieved, Alhamdulillah.
Additional Tip:
Selling against the current bullish bias isn’t advisable, but I believe the top is priced in and the market is cooling off. MA periods show balance, confirming this as a consolidation phase of the bull market.

Where can you buy gold?Hello friends
After the good growth we had, you can see that the price has formed a three drive pattern and this could indicate a price correction to the specified support areas.
Otherwise, if the price breaks the resistance level, we can buy with confirmation in the pullback, of course with capital and risk management.
*Trade safely with us*

PLAN XAUUSD SEP 03, 2025 Related Information:!!!
According to the CME Group’s FedWatch Tool, traders are pricing in over a 90% probability that the U.S. Federal Reserve will cut borrowing costs by 25 basis points at the conclusion of its two-day policy meeting on September 17. Furthermore, market participants expect the central bank to implement at least two rate cuts by the end of this year, which continues to support non-yielding Gold prices.
Meanwhile, U.S. President Donald Trump has pressured Fed Chair Jerome Powell to lower interest rates. In addition, Trump’s move to dismiss Fed Governor Lisa Cook amid allegations of mortgage fraud has raised concerns about the central bank’s ability to operate without political interference. This, combined with ongoing trade uncertainties, has propelled the XAU/USD pair to fresh record highs.
personal opinion:!!!
Gold price breaks above the 3,550 resistance, then continues its uptrend.
Important price zone to consider : !!!
Resistance zone point: 3550 zone

Gold Trade Set Up Sep 3 2025OANDA:XAUUSD
tradingview.com/chart/uzrFMOzW/
Price has broken out of a daily range and is at ATH. So i want to see a pull back and HL created before looking for more buy set ups

Gold XAUUSD Intraday Move 3.9.2025🔹 Bias: Bullish Continuation After Liquidity Sweep
Gold remains in a bullish structure overall, consolidating around 3538 after failing to clear 3547, which suggests liquidity engineering beneath current levels before continuation higher.
🔹 Key Demand Zone (3526–3531)
This zone marks prior accumulation and the origin of the last bullish impulse. A controlled dip into this area would allow liquidity sweep and re-entry of buyers, making it the critical zone to watch.
🔹 Liquidity Above 3547
Equal highs have formed near 3547, indicating liquidity resting above this level. A breakout here, once demand is respected, can provide fuel for a strong push toward the 3567 objective.
🔹 Risk Management (3515 Invalidation)
The invalidation point sits at 3515. A sustained break below this level would indicate absorption of demand and shift bias away from buyers. Until then, risk-to-reward strongly favors longs.
🔹 Trade Plan
Entry: Scale in within 3526–3531 after confirmation of order flow shift (CHOCH or strong bullish displacement).
Stop-Loss: Below 3515.
Take Profits: Partial at 3544/3547, trail stop to breakeven above 3547, final target at 3567.
👉 This breakdown balances structure, liquidity, and execution plan—giving traders both reasoning and a clear actionable path.

Gold Approaches All-Time High with Strong Bullish MomentumAnalysis:
Gold (XAU/USD) has successfully broken above the identified buy zone around $3,440 – $3,460, confirming strong bullish momentum. The recent price action shows a clear breakout supported by an upward channel formation, pushing prices toward higher resistance levels.
The breakout above the consolidation zone signals strong buyer interest.
Immediate upside target is placed at $3,550, as indicated by the projection.
The 9-period SMA ($3,467) is currently acting as dynamic support, reinforcing the bullish setup.
If the price retraces, the buy zone ($3,440 – $3,460) will serve as a strong support area for potential re-entries.
📌 Conclusion: Gold is showing a bullish continuation pattern, with momentum favoring an upside move toward $3,550. Holding above the buy zone keeps the outlook positive.

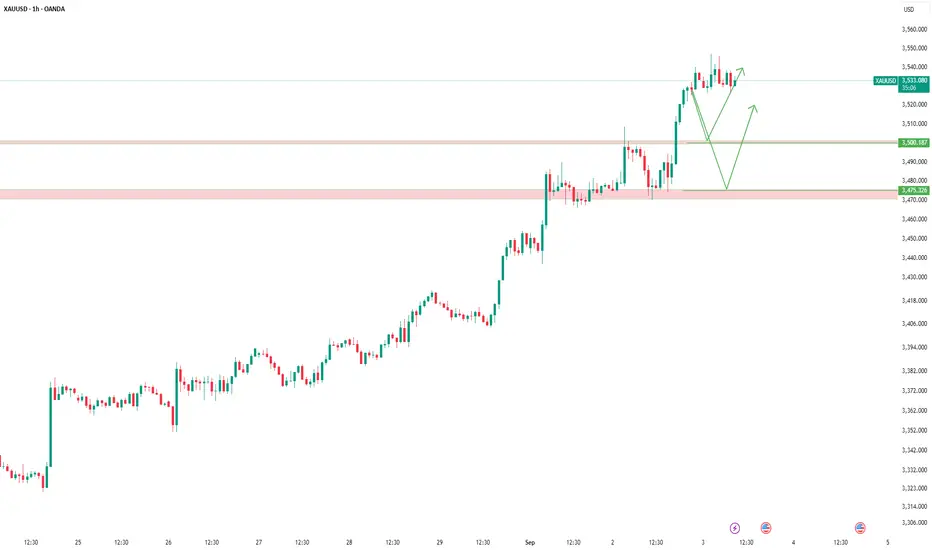
GOLD Breakout Done , Long Setup Valid To Get 200 Pips !Here is My 15 Mins Gold Chart , and here is my opinion , we finally above 3500.00 With Daily Candle ! and we have a 4H Candle closure above it And Perfect Breakout and this give us a very good confirmation , so we have a good confirmation now to can buy after the price go back to retest the broken area 3500.00 , and we can targeting 100 to 300 pips . if we have a daily closure below this area this mean this idea will not be valid anymore .
Reasons To Enter :
1- Perfect Touch For The Area .
2- Clear Bullish Price Action .
3- Bigger T.F Giving Good Bullish P.A .
4- The Price Take The Last High .
5- Perfect 15 Mins Closure .

Waiting for Gold PullbackWe’re waiting for gold to retest the broken level, giving us a buying opportunity.
The $3500 and $3475 levels look like solid spots for long entries 📈.
As always, we don’t dictate where the market should go—we just follow it:
If the levels break to the downside, we’ll simply wait for a pullback to short 📉.
One of the keys to success is moving with the market, not stubbornly relying on a few lines drawn on the chart.
✅ If the market wants to go up—great, we’re with it.
✅ If it wants to drop—that’s fine too, we’re still with it.
Levels are just tools to help us align with the market—not holy lines that must work.
Everything in trading is probabilities 🎯, and our levels work about 85% of the time.
Gold price continues to find new ATH⭐️GOLDEN INFORMATION:
Gold (XAU/USD) extends its two-week rally, surging to a fresh record high near $3,546 in Wednesday’s Asian session as expectations of a Fed rate cut and lingering trade tensions boost safe-haven demand. However, a stronger US Dollar, overbought technical conditions, and caution ahead of Friday’s US Nonfarm Payrolls (NFP) report limit further gains.
⭐️Personal comments NOVA:
gold price fomo continues to look for new ATH in September. 3600 mark becomes gold's next target
⭐️SET UP GOLD PRICE:
🔥SELL GOLD zone: 3596- 3598 SL 3603
TP1: $3585
TP2: $3568
TP3: $3552
🔥BUY GOLD zone: $3484-$3486 SL $3479
TP1: $3494
TP2: $3508
TP3: $3520
⭐️Technical analysis:
Based on technical indicators EMA 34, EMA89 and support resistance areas to set up a reasonable BUY order.
⭐️NOTE:
Note: Nova wishes traders to manage their capital well
- take the number of lots that match your capital
- Takeprofit equal to 4-6% of capital account
- Stoplose equal to 2-3% of capital account

GOLD to the MoonHiper Clear Structure and the beginning of a new impulse towards 3.600 and 3.700
Hope everybody had a chance to got in
gg

GOLD: Where Will The Bulls Take Us Next?Why we should buy...
(H4)
Market structure is still bullish. Last strong BOS was through 3425, which confirms continuation.
Demand Zone to watch:3428–3435
In case we get a deeper pullback, another zone to keep an eye on is 3405–3415.
(H1)
Gold closed the week strong, creating a clean FVG at 3430–3438 which aligns with H4 demand.
As long as price holds above 3428, bulls remain in control.
(M15)
Intraday structure is bullish. Price is still creating higher highs and higher lows.
Liquidity is sitting just above 3455–3460 which you could use for your first target.
There is some internal liquidity also built up below 3435. This could be a perfect sweep area for a retest entry.
Invalidation: A clean H4 close below 3420 would invalidate my bias and open further decline back into 3405–3415 area.
