What will gold do in the US trading session?📈 Market Structure
Price Action:
Price has just broken out of the accumulation zone, moving sharply toward the main resistance area.
📊 Trendlines
Lower Trendline (Red): Long-term dynamic support — price has bounced multiple times from this level.
Upper Trendline (Red): Main descending resistance — price is now approaching this zone.
🧱 Support Zones
3,970,000: Confluence of horizontal support and the lower trendline → key reaction area to monitor.
4,030 – 4,050 (Breakout Zone): Intermediate support if price pulls back after the breakout rally.
⚔️ Resistance Zones
4,100 – 4,115: Strong resistance aligning with the upper trendline and previous highs → possible correction zone.
🎯 Scenario
If price gets rejected around 4,115, it could pull back toward the 4,030 – 4,050 breakout zone, or even retest 3,970,000.
A clean breakout above 4,115 would confirm stronger bullish continuation.
🧭 Summary
Trend: Short-term bullish — currently testing major resistance.
Strategy: Watch price action near 4,115; wait for confirmation to re-enter buys around 4,030 – 3,970.
💼 Trading Plan
BUY GOLD: 4,030 – 4,028
Stop Loss: 4,018
Take Profit: 100 – 300 – 500 pips
SELL GOLD: 4,115 – 4,117
Stop Loss: 4,127
Take Profit: 100 – 300 – 500 pips
Xauusdlong

Gold Targets 4153 After Support ReboundGold is trading near $3,982, showing bullish momentum after rebounding from the support trend line around $3,922. The price is forming higher lows, suggesting potential upward continuation. If gold sustains above the support zone, it could target the resistance level at $4,039, with a further potential move toward the $4,153 target. However, a break below the support line may weaken the bullish outlook.

Gold 1 Hr Up Up Up...Trend line possible as the channel hopefully continues, just cools off a bit after that lovely ride.

This week's gold price movementFor this week's gold price movement, it is expected to continue in a range-bound consolidation pattern. In terms of operation, it is recommended to adopt a "sell high and buy low" strategy within the range, with a key focus on the core consolidation interval of 3,970-4,030.
Specifically, when the gold price pulls back to around 3,970, one can consider establishing a light long position, with a stop-loss set below 3,950 to control risks, and the target range set at 4,000-4,010. When the price rebounds to around 4,030, one can attempt to establish a light short position, with a stop-loss set above 4,050 to avoid greater losses from a breakthrough of the resistance level, and the target range set lower at 4,000-3,980.
It should be reminded to investors that current market divergences are significant, and price fluctuations may exceed expectations. In actual operations, it is necessary to strictly control positions and avoid over-trading. Meanwhile, closely monitor changes in key news such as global macroeconomic data and Federal Reserve policy trends, and adjust operating strategies in a timely manner according to actual market conditions to respond to potential risks and opportunities.

XAU/USD) Technical Outlook – Potential Bearish Reversal Below Gold is currently trading near $4,001, consolidating just below a key resistance zone between $4,015 – $4,025. Price action has formed a rising wedge pattern, suggesting weakening bullish momentum.
The chart indicates that sellers could regain control if the price fails to break above the resistance level. A potential fakeout or retest of the upper resistance might occur before a sharp bearish move.
If bearish pressure confirms below $3,995, the next target lies around $3,965, aligning with the marked target zone and prior support.
Key levels to watch:
Resistance: $4,015 – $4,025
Support: $3,995 / $3,965 (target zone)
Bias: Bearish below resistance; potential short setup after rejection confirmatio EURONEXT:BE8Z2025 EURONEXT:BXF1! EURONEXT:CU6X2025 EURONEXT:ES6X2025 EURONEXT:AB6X2025 EURONEXT:AB7X2025 EURONEXT:AB8Z2025 EURONEXT:AG8Z2025 EURONEXT:AV6X2025 EURONEXT:AV8Z2025 EURONEXT:BL6X2025 EURONEXT:BL6X2025

Gold (XAU/USD) – 4H Market OutlookFOREXCOM:XAUUSD Bias: Short-term bullish retracement toward prior high
Price is currently reacting from a well-defined support zone around the 4,000 region, where buyers have shown repeated willingness to step in. The market has consolidated within this zone, forming a series of higher lows, which signals accumulation and potential exhaustion of the previous bearish leg.
My entry aligns with the structural demand. The rejection wick at the base of the zone suggests failure to break lower, strengthening the case for a bullish move. As long as price holds above the marked support, the market maintains a realistic path toward the previous swing high above 4,360, which is the projected target.
The bullish target area also aligns with the broad imbalance / inefficiency zone created during the earlier sell-off. Markets commonly retrace to rebalance these areas before deciding on the next major directional move.
Your stop-loss placement below 3,886, under the structural low and beneath the liquidity sweep, is logical. If price violates this level, it would invalidate the bullish thesis and confirm continuation to the downside.
In summary:
• Market is respecting a valid demand zone.
• Accumulation structure favors a bullish corrective leg.
• First major liquidity pool sits above 4,360 (your target area).
• Stop-loss below 3,886 protects the trade idea while honoring market structure.
⸻
Devil’s Advocate — What Could Break This Plan?
To strengthen your thinking, here are the strongest counter-arguments:
1. The “demand zone” may actually be redistribution.
If this is a bearish continuation, the sideways movement could simply be sellers reloading before pushing price to new lows.
2. Liquidity above 4,360 might NOT get hit yet.
Price could rally halfway into the inefficiency and reject aggressively without filling the entire imbalance.
⸻
Three Clarifying Questions you should ask(to tighten your analysis)
1. What confirms for you that this is accumulation and not redistribution?
2. If price only retraces to the midpoint of the imbalance (around 4,260), do you still hold full TP at 4,360?
3. What invalidation level—besides the SL—would signal loss of bullish momentum?

Maintain the morning's trading strategyDue to the government shutdown, the U.S. Bureau of Labor Statistics failed to issue the October Nonfarm Payrolls report as scheduled, marking the second consecutive "absence" of the report.
Therefore, for today's U.S. trading session, we will maintain the morning's trading strategy and continue to treat the market as a volatile trend. We will focus on short-selling on rebounds, adopt a "observe more, trade less" approach, refrain from chasing trades cautiously, and patiently wait for key levels to enter positions.

Gold Rejection at Resistance – Bearish Channel Targeting 3930📉 Analysis:
The chart shows a clear shift from an uptrend into a bearish correctional channel:
1. Uptrend Broken
Price previously followed a clean uptrend channel, making BOS (Break of Structure) swings upward.
A ChoCH (Change of Character) occurred, confirming momentum weakening.
2. Strong Resistance Zone
Price entered the 4018–4030 resistance level, marked as a weak high.
This zone acted as a reaction area, causing multiple rejections.
3. Bearish Channel Formation
After hitting resistance, price began forming lower highs and lower lows inside a falling channel.
The rejection line confirms sellers defending the zone.
4. Expected Bearish Leg
The projected path shows consolidation inside the channel followed by a sharp downward impulsive move.
Clean liquidity below supports the bearish scenario.
5. Targets
Major target: 3930
(Highlighted as the trader's target and matches channel support + demand zone.)
📌 Summary
Gold is rejecting the 4020–4030 resistance and forming a bearish channel. A continuation downward toward 3930 remains likely unless price breaks above the resistance with strong momentum.

Gold Rejection at Resistance with Potential Bearish PullbackAnalysis:
The chart shows XAUUSD approaching a strong horizontal resistance zone around 4015–4020, a level where price has previously been rejected multiple times (highlighted in yellow). The market recently broke out of a falling channel, showing short-term bullish momentum, but now price is stalling again at this key resistance.
The grey zone above suggests a supply area, and the white arrow indicates a projected bearish move. As long as gold stays below this resistance, the probability of a downward correction increases.
A potential bearish target appears around 3900–3920 (previous support zone), where buyers may re-enter.
Key Points:
Strong multi-touch resistance at 4015–4020
Price showing early rejection signs
Bearish correction likely if price fails to break above resistance
Downside targets: 3920, possibly 3900

LONG ON GOLD XAU/USDGold has swept sell side liquidity and has given us a choc (change or character) to the upside.
There is tons of buyside liquidity to the upside with huge FVG's (Fair value gaps) and equal highs (double top) that need to be mitigated.
I am buying gold looking to catch over 200-300 points.
That's 2000-3000 pips.

XAUUSD LONG SETUP INTRADAY ( NOV 06, 2025 )If you have doubt on our trades you can test in demo.
OANDA:XAUUSD LONG SETUP
EP: 3993.469
TP: 4017.410
SL: 3981.518
Trade Ideas:
Idea is clearly shown on chart + we have some secret psychologies and tools behind this.
Trade Signal:
I provide trade signals here so follow my account and you can check my previous analysis. So don't miss trade opportunity so follow must.

Gold: High VolatilityYesterday, gold’s main structure followed a consolidation path, with the focus of its short-term structure edging slightly higher. The risk of price volatility today has increased. Combining the daily and hourly chart trends, the risk of volatility for gold will be very high in the next two days. Subjectively, we temporarily maintain the expectation of a technical correction pullback. Gold’s bullish performance has not been particularly strong, and with heavy resistance above, the trend has not reversed.
From the 4-hour chart, focus on the short-term resistance at the 4010 level, with secondary resistance at 4020-4025. For support, watch the short-term level at 3960-3970 and the key previous low support at 3888-3890. The bull-bear dividing line remains the 4040-4055 range. As long as this resistance range is not broken, I believe the trend has not reversed,on the contrary, any rebound presents opportunities to enter short positions.
We can enter short orders when rebounds encounter pressure. Operationally, it is recommended to continue shorting as long as rebounds fail to break key resistances.
Trading Strategy:
Sell 4010 - 4020
TP 3970 - 3960 - 3950
Buy 3920 - 3930
TP 3950 - 3960 - 3970

US Employment Data Positive for GOLD Prices. Can GOLD reverse?GOLD is declining in falling channel pattern however seems to be taking support at the marked trendline.
US Employment data came just in where number of jobs added was better than expectations which would mean a stronger labour market and inflation might stay elevated which is good for GOLD/SILVER due to safe haven demand in the long term.
Keep an eye on GOLD prices.

XAUUSD LONG-2 HIGH ACCURACY ( NOV 05, 2025 )If you have doubt on our trades you can test in demo.
OANDA:XAUUSD LONG
TP: 3987.065
SL: 3951.327
Trade Ideas:
Idea is clearly shown on chart + we have some secret psychologies and tools behind this.
Trade Signal:
I provide trade signals here so follow my account and you can check my previous analysis. So don't miss trade opportunity so follow must.

technical analysis of your XAU/USD (Gold) chartTimeframe: 15-Minute Chart
Current Price: $3,977
🔍 Chart Overview
The chart shows a downward channel (yellow lines) that Gold has recently broken to the upside, indicating potential bullish momentum.
There’s a support zone around $3,955 – $3,965, labeled as “SUPPORT LEVEL”.
A short-term corrective move is expected before the next upward push.
📊 Key Levels
Support Zone: $3,955 – $3,965
Immediate Resistance: $3,985 – $3,990
Major Target (Resistance): $4,031
🧭 Price Projection
After testing or retesting the support level, price is expected to bounce upward toward the $4,031 target.
The purple projection curve indicates a potential retracement followed by a bullish continuation.
💡 Trading Bias
Short-Term: Bullish above $3,960
Invalidation: Break below $3,950 could signal renewed bearish pressure.
LME:CA1! LME:MC1! LME:NI1! LME:SC1! LME:LH1! LME:AH1! LME:CO1! LME:CB1! LME:HC1! LME:AA1! LME:EA1! LME:HN1! LME:MD1!
Target: $4,031 (upside target based on resistance and breakout structure).
⚠️ Summary
Gold shows a reversal from a descending channel, now forming a support base near $3,960. If the price sustains above this zone, buyers may push it toward $4,031 in the short term.

GOLD AWAIT BREAKOUT BEFORE ENTRY#XAUUSD price still bearish unless 2 times breakout occurs above the 3989 limit which will go bullish till 4015.
Now we await for retest above 3974 to sell. Target 3936, stop loss 3989.
Below 3956 on M15-H1 closures holds continuation on sell.

Gold Bearish Continuation After Range BreakdownThe chart shows that gold (XAUUSD) recently broke down from a clear consolidation range highlighted by the red rectangle. This range acted as a distribution zone where price repeatedly failed to break higher. Once the lower boundary of that range broke, sellers gained momentum, pushing price downward.
Price has now pulled back toward the broken structure, forming a corrective bullish move — likely a retracement before further downside. The projection on the chart suggests a lower-high formation followed by continuation to the downside.
Key observations:
Breakdown from consolidation: The range around 3960–4000 was rejected multiple times, confirming strong resistance.
Pullback to structure: Current bullish candles appear corrective, not impulsive.
Bearish projection: The chart shows expected continuation toward levels around 3929, 3900, and potentially lower.
Stop-loss area: The SL is clearly marked at 4000.234, above the former resistance zone.

XAUUSD LONG SETUP INTRADAY ( NOV 05, 2025 )If you have doubt on our trades you can test in demo.
OANDA:XAUUSD LONG SETUP
EP: 3966.253
TP: 3990.121
SL: 3954.296
Trade Ideas:
Idea is clearly shown on chart + we have some secret psychologies and tools behind this.
Trade Signal:
I provide trade signals here so follow my account and you can check my previous analysis. So don't miss trade opportunity so follow must.

XAUUSD LONG SETUP 1:2 RR ( NOV 05, 2025 )If you have doubt on our trades you can test in demo.
OANDA:XAUUSD NEW LONG SETUP
EP: 3972.539
TP: 3996.226
SL: 3960.454
Trade Ideas:
Idea is clearly shown on chart + we have some secret psychologies and tools behind this.
Trade Signal:
I provide trade signals here so follow my account and you can check my previous analysis. So don't miss trade opportunity so follow must.

Gold Bearish Continuation After Range BreakdownThe chart shows that gold (XAUUSD) recently broke down from a clear consolidation range highlighted by the red rectangle. This range acted as a distribution zone where price repeatedly failed to break higher. Once the lower boundary of that range broke, sellers gained momentum, pushing price downward.
Price has now pulled back toward the broken structure, forming a corrective bullish move — likely a retracement before further downside. The projection on the chart suggests a lower-high formation followed by continuation to the downside.
Key observations:
Breakdown from consolidation: The range around 3960–4000 was rejected multiple times, confirming strong resistance.
Pullback to structure: Current bullish candles appear corrective, not impulsive.
Bearish projection: The chart shows expected continuation toward levels around 3929, 3900, and potentially lower.
Stop-loss area: The SL is clearly marked at 4000.234, above the former resistance zone.

XAUUSD Bullish Flag: Breakout Above 4,150 Toward 4,400Gold (XAUUSD) ripped higher from late August and topped just below 4,400 before slipping into a tidy pullback. Price is now hovering near 3,940 with momentum cooled and volatility contracting—classic flag behavior after a vertical pole. Structure remains bullish on higher timeframes, even as the short-term trend corrects. The 20-day average near ~4,085 is capping price, while immediate demand sits around 3,930.
The primary path is continuation: a daily close above 4,150 would clear the flag top and the MA20, opening room for a run back into the 4,380–4,400 supply zone. If momentum builds, expect a retest of the mid-October high at 4,400; interim buoyancy above ~4,100 would support a grind toward 4,340 before the final push. Accumulation near 3,930–3,950 is higher risk, and should be reserved for clear reversal signals.
If buyers fail to defend 3,930–3,920, the setup breaks. A daily close below 3,920 invalidates the flag and puts 3,780 (near the MA60 ~3,773) on the map, with rallies likely to be sold beneath 4,040–4,085 until structure repairs. Clean line in the sand for longs sits just under 3,920, with protective stops around ~3,900.
This is a study, not financial advice. Manage risk and invalidations

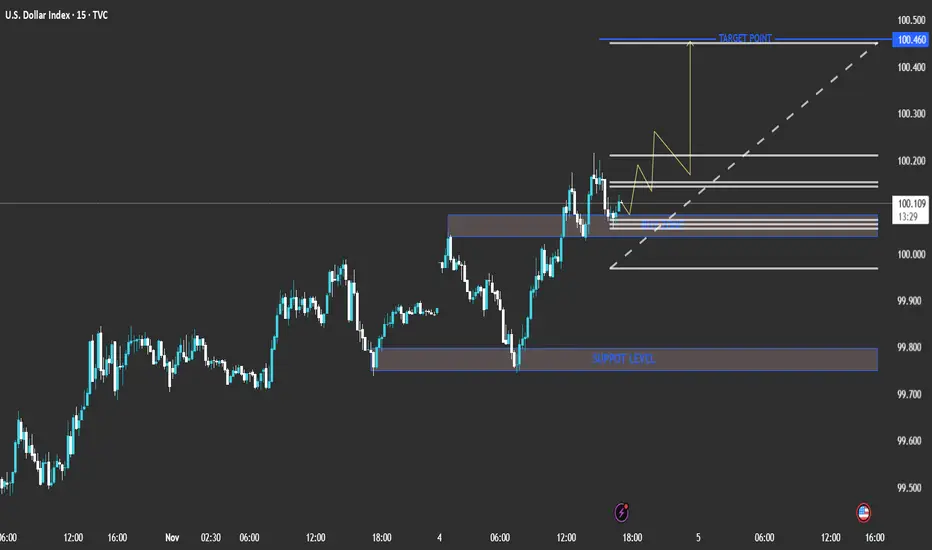
technical analysis of the chart you shared (U.S. Dollar Index Current Price: 100.112
Bias: Bullish short-term
Timeframe: 15-min
The chart shows a clear bullish structure with higher highs and higher lows forming. The price recently bounced from a minor support zone around the 100.00 level and is showing momentum to the upside.
📊 Key Levels
Support Level: 99.750 – 99.850 (major zone from previous lows)
Buy Zone: 100.000 – 100.050 (minor support/entry zone)
Target Point: 100.460
⚙️ Analysis Summary
Price has broken above short-term resistance and is now retesting the buy zone, suggesting a possible continuation higher.
The ascending trendline (dotted white line) supports this bullish bias.
The yellow zigzag projection indicates expected consolidation before a push upward.
🎯 Trading Plan (Based on Chart Setup)
Entry Zone: Around 100.000 – 100.050
Stop Loss: Below 99.900 (below structure support)
Take Profit: 100.460 (target zone)
Risk/Reward Ratio: Approximately 1:3
🔍 Conclusion
The chart suggests a short-term bullish scenario for DXY (U.S. Dollar Index). A successful bounce from the 100.00 zone could lead to a move toward the 100.46 target point. However, a break below 99.90 would invalidate the setup and shift bias to neutral or bearish. TVC:UKX FTSE:UKX FTSE:MCX FTSE:FBMKLCI FTSE:AIM1 FTSE:ASX FTSE:NMX FTSE:AW01 FTSE:JAPAN FTSE:GEISAC FTSE:FBM100 FTSE:AIM5 CBOEEU:BUK100P FTSE:XIN0 FTSE:AXX FTSE:XIN0U
XAU/USD Technical Analysis – Bearish Rejection at ResistanceXAU/USD) is currently trading around the $4,009 level after rebounding from a recent intraday low. The price action shows a clear rising channel structure, with the upper boundary acting as a significant resistance zone near $4,040 – $4,050.
The chart highlights a resistance level where price has repeatedly failed to sustain upward momentum, indicating a potential double-top or distribution pattern forming in this area.
If price fails to break and hold above the $4,020 – $4,040 resistance zone, bearish momentum may resume, potentially pushing gold toward the $3,950 area initially, followed by a deeper correction to the target level near $3,913.
Conversely, a decisive breakout and close above $4,050 could invalidate the bearish outlook, opening the way for further bullish continuation.
Key Levels:
Resistance Zone: $4,020 – $4,050
Immediate Support: $3,990
Target Level: $3,913
Trend Bias: Short-term bearish under resistance
Conclusion:
Gold is approaching a critical resistance area, and a rejection could confirm a short-term bearish reversal pattern. Traders should watch for confirmation near $4,020–$4,040 for potential short entries targeting $3,913. CME_MINI:NQ1! CME_MINI:MNQ1! CME_MINI:ES1! CME_MINI:MES1! COMEX_MINI:MGC1! CBOT_MINI:YM1! NYMEX:CL1! CME:BTC1! COMEX:SI1! NSEIX:NIFTY1! CME_MINI:RTY1!
