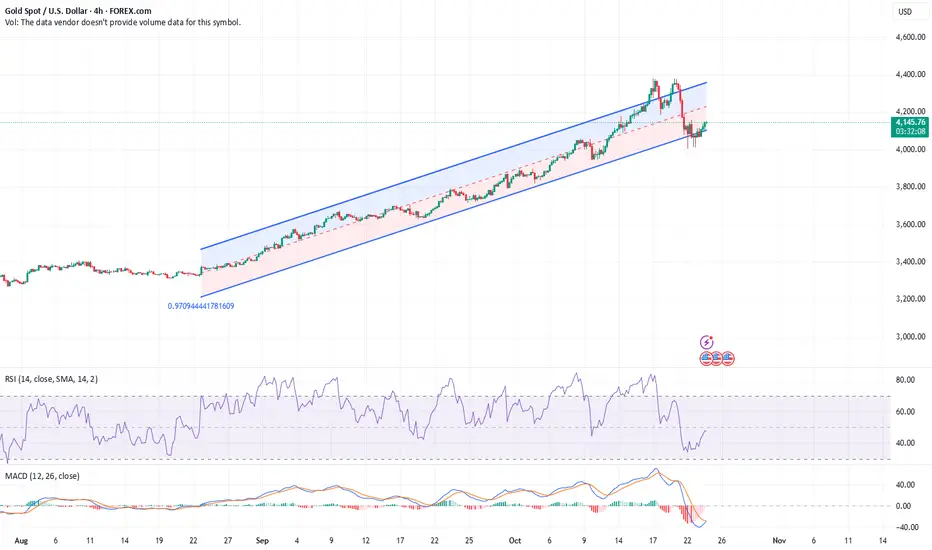
Gold price analysis on March 24XAUUSD – Bears Still in Control
Gold is trading sideways around the key resistance zone of 4145, indicating a strong struggle between buyers and sellers. However, the price has been repeatedly rejected at this zone, indicating that the bearish pressure is still dominant.
If the current trend is maintained, the support zone of 3946 will be the next potential target for the sellers. Only when the price clearly breaks above 4145, the current bearish structure can be broken and the new buying trend is confirmed.
📊 Trading Strategy:
SELL now at 4110
Target: 4022 – 3946
BUY setup: When the price breaks decisively above 4145
Xauusdlong

XAU/USD 10-23-25After the recent runup with gold it has pulled back to the 23.6 fib level on the daily timeframe and actually pushed below showing strong support in the 3975 - 4040 daily zone.
I would like to think that price will run right back up to retest the recent ATH of about 4382Gbut if I know gold in all her trickiness she will coast along at this 23.6 level then perhaps dip to the 38.2 or even the 50 then get a strong push back up to retest the high and from there probably come back down or push thru depending on macro economic and political events at that time.
Going back a few months to May of this year you can kind of see how price experienced similar behavior when it was breaking thru the 3430 - 3505 daily zone which obviously is that real push thru the previous psychological ATH level of 3500. Now history is repeating itself as we push to stay above the recent psychological ATH of 4000 towards 4500.
We shall see...

XAUUSD:Keep an eye on the 4,000 support mark📈The current price of London gold is 4,116.87 per ounce, up 28.36 from the previous trading day, with a percentage increase of 0.64%. So far today, the highest price has reached 4,137.35 per ounce, and the lowest is 4,065.47 per ounce. Currently, the price is in a state of fluctuating increase.
📝Market sentiment and fund flow:
Judging from the recent market performance, the price of London gold has fluctuated violently. On October 21st, the price of London gold once dropped by more than 6%, and the decline continued on the 22nd, with the lowest reaching 4,002.89 per ounce during the Asian session.
The significant decline in these two days was mainly due to the weakening of risk - off sentiment. The joint statement by the relevant parties in the Russia - Ukraine conflict in support of a cease - fire and the easing signals in Sino - US relations have weakened the safe - haven demand for gold.
At the same time, the previous large increase in the price of gold had accumulated a large number of profit - taking positions, and the pressure on investors to take profits was relatively high. However, the price rebounded on the 23rd, indicating that market sentiment has recovered to some extent, but overall it is still relatively cautious.
📝Technical analysis:
From the perspective of the 4 - hour cycle trend, the gold shows a trend of shifting from a bullish to a bearish rhythm in the short and medium term, forming a typical M - top pattern, which indicates that there may still be room for the price of gold to decline in the near future. However, the large - integer - level support of 4,000 per ounce is currently relatively clear, and in the short term, it may fluctuate within the range of 4,000 - 4,150. In terms of operation, it is mainly advisable to go short on rallies. The upper resistance level is in the range of 4,135 - 4,150, and the short-term support around the 4,065-4,070 range,then the key support level is in the range of 4,010 - 4,000.
💡In conclusion, the price has rebounded today, but due to the impact of the previous significant decline, it may fluctuate within the range of 4,000 - 4,150 per ounce in the short term, and the trend is uncertain. Investors need to closely pay attention to the changes in factors such as the geopolitical situation, Sino - US relations, and the Federal Reserve's policy.
💎Trading Strategy:
BUY 4010 - 4015
SL 4000
TP 4030 - 4020 - 4070
Sell 4120 - 4125
SL 4130
TP 4100 - 4080 - 4060
Daily-updated accurate signals are at your disposal. If you run into any problems while trading, these signals serve as a reliable reference—don’t hesitate to use them! I truly hope they bring you significant assistance

Price still in upwards channelAlright, here's the thing with gold. Recently, the price dropped sharply, almost 6%, which might sound alarming. But when we look at the bigger picture, gold is still in an upward channel or a rising trend. What does that mean? It shows that, despite this dip, gold still holds its value in the long run. Think of it like a staircase—sometimes you step down a bit, but you're still climbing higher overall. This is good news for investors because it means gold continues to act as a safe haven and a reliable hedge against things like inflation or economic uncertainty. The short-term drop could be due to temporary factors, but the long-term trend gives confidence that gold remains strong.
Price still in upwards channelAlright, here's the thing with gold. Recently, the price dropped sharply, which might look alarming. But when we look at the bigger picture, gold is still in an upward channel or a rising trend. What does that mean? It shows that, despite this dip, gold still holds its value in the long run. Think of it like a staircase—sometimes you step down a bit, but you're still climbing higher overall. This is good news for investors because it means gold continues to act as a safe haven and a reliable hedge against things like inflation or economic uncertainty. The short-term drop could be due to temporary factors, but the long-term trend gives confidence that gold remains strong.

GOLD REBOUNDS AS INVESTORS BUY THE DIP AFTER ETF SELL-OFFGOLD | Prices Rebound Despite ETF Outflows 💰
Gold prices recovered after an earlier dip triggered by the largest single-day ETF outflow in five months, signaling profit-taking and a technical correction.
Despite investor caution, the metal maintains bullish momentum while trading above 4101, supported by safe-haven demand amid uncertainty ahead of U.S.–China trade talks.
Technically, as long as gold trades above 4101, upside targets remain 4124 → 4163 → 4189.
A clean 1H close below 4075 would shift momentum bearish, opening room toward 4053 and 4011.
Pivot Line: 4101
Resistance: 4124 – 4163 – 4190
Support: 4075 – 4053 – 4011

Gold Rebounds from Extreme POI – Bullish Move Building UpGold?Analysis:
Gold (XAU/USD) has shown a strong recovery after tapping into the Extreme Point of Interest (POI) zone, signaling the potential start of a bullish reversal.
The chart indicates an SMC Trap (Smart Money Concept Trap), where liquidity was swept below previous lows to trigger sell stops before reversing upward — a classic smart money accumulation pattern.
Price reacted sharply from the Extreme POI, forming higher lows, which confirms renewed buyer interest.
The immediate target area lies around $4,180 – $4,200, aligning with the projected bullish arrow.
Below, the High Probability POI remains as a deeper demand zone — a strong confluence area if price retests.
📊 Conclusion:
Gold is showing signs of bullish structure recovery after liquidity sweep. Holding above the Extreme POI zone strengthens the case for continued upside movement toward $4,200 and possibly higher.

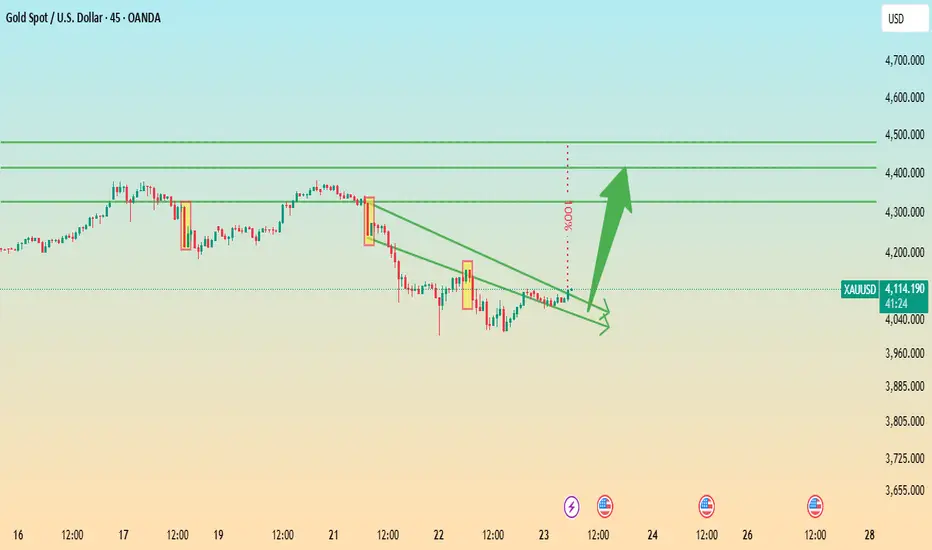
Gold Breakout Potential: Descending Wedge Signals Bullish ReversAnalysis:
The XAU/USD (Gold vs. USD) chart on the 45-minute timeframe shows price action forming a descending wedge pattern, a typically bullish reversal formation. The price has been compressing between lower highs and lower lows but is now testing the upper trendline resistance, indicating a possible breakout.
Key observations:
Trendline Breakout Zone: The narrowing wedge suggests weakening bearish momentum. A confirmed breakout above the trendline could trigger strong upward momentum.
Targets: The projected upside targets are around 4,300, 4,400, and 4,500, aligning with previous resistance zones.
Support Zone: Immediate support remains near 4,050–4,000, where the lower wedge boundary provides buying interest.
Momentum Indicator: Gradual bullish recovery and decreasing downside pressure indicate renewed buyer strength.
GOLD (XAU/USD) – FINAL GRAND CYCLE ANALYSIS🟡 GOLD (XAU/USD) – FINAL GRAND CYCLE ANALYSIS
“The Rise of Real Money in a Failing Fiat World”
Elliott Waves | Fibonacci | Smart Money | Macro Fundamentals | Market Psychology
📅 Date: October 22, 2025
📍 Current Price: ~$4,039/oz
⏳ Time Horizon: 1970s to post-2050
🎯 Focus: Multi-decade Elliott Wave structure signaling the endgame for fiat currencies
🌐 SUPER CYCLE NARRATIVE – GOLD’S MONETARY METAMORPHOSIS
🔵 Wave I (1971–1980): The Rebirth of Real Money
Gold's first major secular rally began when the Bretton Woods system collapsed and President Nixon ended the U.S. dollar’s convertibility to gold in 1971. Gold soared from around $35 to nearly $875 by 1980. This wave was driven by runaway inflation, the oil embargo, and shattered confidence in fiat money.
🔴 Wave II (1980–1999): The Great Fiat Illusion
Following the 1980 peak, gold entered a brutal 19-year corrective phase, falling to the $250 zone. During this time, the U.S. dollar gained strength, Volcker’s interest rate hikes reined in inflation, and a new era of debt-based prosperity and stock market euphoria unfolded. Gold was dismissed, even by central banks who sold reserves. Structurally, this corrective phase formed a complex WXYXZ pattern , setting the groundwork for the massive Wave III rally.
🟢 Wave III (1999–~2033): The Fiat Reckoning Has Begun
This is the longest and most powerful supercycle wave and the one we are currently in. It is subdivided into five impulsive macro waves. As of now, gold is deep within Wave iii of III , the most explosive phase of the entire structure. The current rally is no longer driven by inflation fears but by existential doubts about the long-term viability of fiat currencies.
📈 Wave I of III (1999–2011): The Institutional Accumulation
Gold rose from around $250 to $1,920 over this period. Triggers included the dot-com bust, 9/11, the 2008 global financial crisis, and the launch of the first gold ETFs like GLD. This wave marked the beginning of institutional interest in gold as a systemic hedge.
📉 Wave II of III (2011–2015): The Disbelief Correction
Gold corrected nearly 45%, bottoming near $1,050. The narrative shifted — QE hadn't caused hyperinflation, the stock market was booming again, and faith in the dollar resurged. Retail abandoned gold, but institutional buyers quietly accumulated from newly created demand zones.
🚀 Wave iii of III (2015–~2026): The True Price Discovery Phase
This is where we are now. Since 2015, gold has exploded upward, driven by COVID-era QE, negative real interest rates, geopolitical instability, and major central banks accumulating gold for cross-border settlements outside the dollar system.
We are currently in the middle of this wave — micro wave (3) of iii — with price around $4,039. According to Fibonacci projections, this wave is expected to peak near $6,552 , corresponding to the 2.618 extension level . If bullish momentum continues, gold could overshoot toward $22,744 , matching the 3.618 Fibonacci extension and marking the likely top of macro Wave III.
In an extreme scenario where fiat trust collapses entirely, the 4.618 extension projects a possible target of $78,940 . All of these levels align with the upper bounds of the long-term logarithmic channel, validating both structure and projections. But most likely this target is for Wave V TOP .
🟣 Wave IV (Projected: 2026–2033): The Great Shakeout
After the parabolic run of Wave iii, a deep multi-year correction is likely. This correction — Wave IV — may retrace toward the long-term red trendline and could coincide with a temporary return to “faith” in fiat through reforms like CBDC rollouts or aggressive fiscal pivots.
This wave could resemble a WXY pattern or large ABC structure and may unfold alongside capital controls, deflationary pressure, and a resurgent tech or dollar narrative. However, this will likely be the last major buying opportunity before gold enters its final, euphoric revaluation.
🟢 Wave V (2033–2045+): The Final Blow-Off Top
Wave V is expected to be driven by an overt crisis of confidence in the global fiat system. Scenarios could include:
Mass adoption of gold-backed or commodity-tied digital currencies
Loss of global trust in the USD as the reserve currency
BRICS or emerging alliances introducing gold into cross-border settlements
Global central banks returning to physical gold as a monetary base
The upside potential here is monumental. The 4.618 Fibonacci extension already targets $78,940 , but under full systemic collapse or monetary reset conditions, gold could reprice toward $100,000–$250,000 per ounce — not as a bubble, but as a return to its role as sound, base-layer money.
📐 Fibonacci Milestones and Structure Alignment
Each major wave has closely respected its corresponding Fibonacci extension. Wave I topped around the 1.618 level ($1,887) . The ongoing Wave iii appears on track to reach the 2.618 level ($6,552) . From there, macro Wave III could stretch toward 3.618 ($22,744) . If Wave V extends fully, a 4.618 projection leads to $78,940 — all within the bounds of the established logarithmic trend channel. In a full-blown systemic reset, price could break even higher.
These levels are not speculative but grounded in structural alignment with Elliott wave geometry , Fibonacci mathematic s, and long-term institutional order flow .
🧠 Smart Money Concepts & Technical Validations
Smart money activity has left clear fingerprints across this cycle. Each break of market structure (in 2016, 2020, and 2023) confirmed higher time-frame bullish continuation. Institutional demand zones — especially during the 2018–2019 consolidation and 2022 pullback — were respected to the dollar.
This cycle isn’t retail-driven mania — it's a stealth institutional accumulation that’s now evolving into price discovery.
📊 Market Psychology Across the Cycle
Investor sentiment has followed classic psychology stages:
From 1999 to 2004, disbelief reigned: “Gold is dead.”
Between 2005 and 2011 came growing awareness: “Gold might work again.”
The 2011–2015 correction brought denial: “It was just a bubble.”
Hope returned in 2016–2020 as price quietly rallied.
From 2022 to 2026, euphoria dominates: “Gold will never go down.”
Wave IV will likely bring fear and capitulation between 2026 and 2033.
Finally, Wave V will ignite mania: “Gold to the moon!”
🚨 Final Synthesis: What This All Means
We are living through the largest repricing of monetary value in modern financial history. Gold is no longer just an inflation hedge — it’s becoming a hedge against the system itself . The structure on the chart doesn't just map price — it maps the collapse of fiat trust and the return of monetary sanity.
Gold is transitioning from:
A commodity hedge →
To a central bank hedge →
To a currency hedge →
And finally, to a system hedge
The current leg — Wave iii of III — is nearing its climax. After a correction in Wave IV, Wave V could take gold into previously unthinkable territory, not because gold changed — but because everything else did.
📌 Final Position Summary
We are currently in wave (5) of iii of III — the most powerful segment of the bull run
The next Fibonacci target is $6,552
The broader Wave III could peak near $22,744
After a correction (Wave IV), the final wave could send gold toward $78,940 , or even into the $100,000–$250,000 zone under extreme monetary reset conditions
This is not a mere forecast — it’s a macro-monetary blueprint for the coming decades.
🌊 "Those who understand the waves will ride them. Those who don’t will be swallowed by the tide." – FIBCOS
📘 Disclaimer: This is an educational market outlook based on technical and macroeconomic structure. It is not financial advice. Always do your own due diligence and risk management.
#XAUUSD #Gold #GoldAnalysis #ElliottWave #Fibonacci #SmartMoneyConcepts #PriceAction #TechnicalAnalysis #MarketStructure #Commodities #InflationHedge #MacroEconomics #CentralBanks #BRICS #MonetaryReset

GoldXAUUSD
- Change of Characteristics
- Strong Bullish Trend Line
- Completed " 12345 " Impulsive Waves and " ABC " Corrective Waves
- Order Block
- RSI - Divergence

COULD GOLD (XAU/USD) BOUNCE TO THE UPSIDE OR DROP?GOLD (XAUUSD) is currently being held by a strong support trend line which is is struggling to breakthrough.. however, it is currently in a new downtrend and could continue to fall to the downside.
If The support trendline has been broken, this will be a great sell opportunity.. if it struggles to break, then it will be a great buy opportunity. Keep an eye!

gold on short reverse#XAUUSD price have been trading between price correction and continuation, now we await for 2 times breakout above 4034 to sell.
2 times breakout at 4034 sell, target 3998, stop loss 4050.
Below the 3998 holds bullish reverse which will target 4070.

mrmoney limited XAU/USD swing trading ideaprice approached our 4hours QMR and daily timeframe engulfing candle/trendline

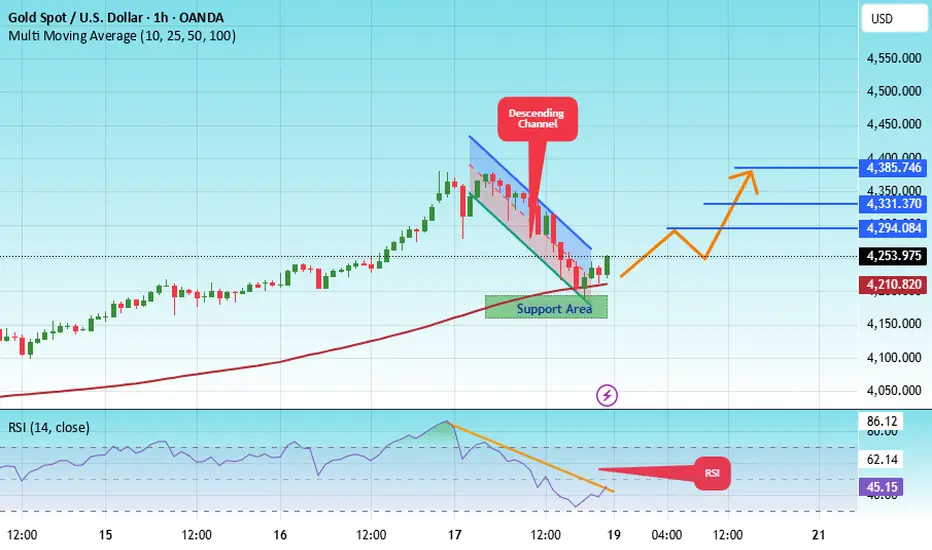
#XAU/USDT Bullish Reversal from Key Support Zone Targeting 4,3#XAU
The price is moving within a descending channel on the 1-hour frame, adhering well to it, and heading for a strong breakout and retest.
We have a bearish trend on the RSI indicator that is about to be broken and retested, which supports the upward move.
There is a major support area in green at 4150, which represents a strong support point.
We are heading for consolidation above the 100 moving average.
Entry price: 4253
First target: 4294
Second target: 4331
Third target: 4385
Don't forget a simple matter: capital management.
When you reach the first target, save some money and then change your stop-loss order to an entry order.
For inquiries, please leave a comment.
Thank you.
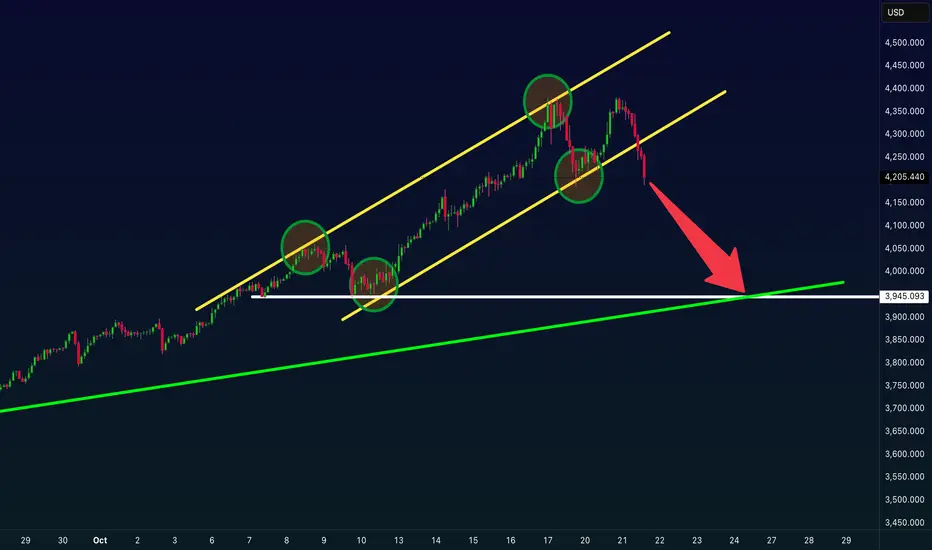
Time for GOLD To DROP! (is XAUUSD heading to the downside?)For weeks gold (XAUUSD) has been sky rocketing to the upside, however there have been many new signals indicating that it could be a bearish move to the downside. Nothing keeps going up forever! Gold has broken major support levels + trend line and channel breakout. Time to sell!
Gold tests below $4,300 amid strengthening USD October 21Joint statement Ukraine – EU – Trump – Europe:
=> Call for an immediate ceasefire and start peace negotiations.
=> The market reacts risk-on, money flows out of gold => gold drops sharply.
echnical analysis: H1 is in the process of correction after continuously setting the ATH peak, gradually forming a head and shoulders pattern, buyers right at the 4178-4180 area are quite clear.
BUY GOLD : 4180 - 4178
SL: 4172
TP: 50 - 200 - 400PIPS
SELL GOLD : 4320 - 4322
SL: 4330
TP: 50 - 200 - 400PIPS
Trade according to price trends, do not trade predictions, manage and be responsible for your account !

gold on reverse#XAUUSD we wait price on M15 closure above 4265 to buy.
Entry 4265 M15 closure short target 4278, second target 4302 and last 4320. Stop loss 4250
Below the 4246 on one time breakout will drop the pair till 4206 limit.
4278 holds reverse but breakout above 4283 will continue bullish.

GOLD HIGH PROBABILITY SETUP SOON!!!🚨 XAUUSD HIGH PROBABILITY BUY SETUP 🚨
* Here We Can See Clearly The Next Potential Moves For GOLD Coming Hours.
* Keep Your Eyes Close On Your Trading Positions.
* Happy PIP Hunting Traders.
FXKILLA.

Correct projection for GoldAfter breaking through 4280, gold has continued to rise and shows no signs of peaking so far. This fully aligns with our prediction that a breakthrough above 4280 would form bottom support and further test 4362. If it breaks through the previous high of 4379, it will open the channel for further upward movement.

4365 Achieved Excellent profits Booked [1350 PIPS Gained]Thanks to traders who followed and stay Active with me on bullish rally
As highlighted in yesterday’s session update:
My Position:
The ongoing bull rally has played out perfectly, with both of my targets achieved ahead of schedule. I identified strong support around $4,220 & 4190 along condition H4 Candle for bullish rally. Iinitiated aggressive swing buys from that zone. When $4,190 was retested, I held off for a healthy pullback before re-entering.
At $4205& $4,225, I scaled in aggressively (four entries) aiming for $4,345, which was reached — locking in solid overnight gains.
I’m pleased with the overall performance during this multi-month bullish phase and plan to keep accumulating on dips until the $4,490 level is reached from my main re-entry zones.
Additional Tip:
Once again, I caution traders — avoid counter-trend selling.
Many get trapped trying to short Gold in a strong uptrend. Stay aligned with the trend — it’s still firmly bullish.🚀

Gold has now broken through the resistance level at 4280As our mentioned before, Gold has now broken through the resistance level at 4280 and continues to rise,It may form a short-term bottom structure and further test the 4362 level. A break above the previous high of 4379 would open the door to further upside.
Buy 4280 - 4285
TP 4300 - 4310 - 4320
SL 4270
Daily-updated accurate signals are at your disposal. If you run into any problems while trading, these signals serve as a reliable reference—don’t hesitate to use them! I truly hope they bring you significant assistance

Gold Price Analysis - Gold Showing Strong Reversal SignsGold is currently trading around $4,230, showing a mild pullback after making an all-time high near $4,380. The market has corrected toward its main support zone around $4,120–$4,166 (Fib 0.5–0.618 region). This zone is acting as a crucial demand area, aligning with the ascending trendline, which suggests potential for bullish continuation if price holds above it.
In the short term, a retest of the support is likely before a possible bounce toward the resistance at $4,401–$4,420. If bulls regain strength above $4,250, momentum could quickly shift upward, targeting new highs. However, a confirmed 4H candle close below $4,110 may open the door for deeper correction toward $4,050–$3,950.
🔑 Key Levels to Watch
Resistance: $4,379 → $4,401 → $4,541
Main Support: $4,120–$4,166
Trendline Support: $4,100 area
🔹 Buy Zone:
- Primary Buy Zone: $4,120–$4,166 (Fib 0.5–0.618 area + trendline support)
🔹 Buy Trigger:
- Buy Trigger: Break and 4H close above $4,250
- Upside Target: $4,379 → $4,401 → $4,450
Summary
Gold remains bullish in the bigger picture but is currently in a retracement phase.
- Holding above $4,120 keeps buyers in control.
- Breaking below $4,100 turns the short-term trend bearish, opening room for a deeper correction.
Note
Please risk management in trading is a Key so use your money accordingly. If you like the idea then please like and boost. Thank you and Good Luck!

BUY GOLD - XAUUSD- Amazing low risk high reward trade!Based on our deep analysis we can see that XAU/USD (gold) will head to the upside. Great time to BUY - it has broken all major resistance levels and has nowhere else to go except upwards. It is also struggling to break past powerful support levels. Buy gold!
