Gold Breaks Key Support Zone — Bearish Momentum Builds Below $4,Analysis:
The XAU/USD (Gold vs. USD) 45-minute chart shows a clear breakdown below the established support zone, indicating a shift in market sentiment from consolidation to bearish momentum.
The support zone around $4,050 – $4,000 had previously held multiple times, acting as a strong demand area.
The recent breakout below this zone confirms a potential trend continuation to the downside.
Price action suggests a bearish pattern with lower highs and lower lows forming before the breakout.
A retest of the broken support (now resistance) may occur before the next leg lower.
The next major target lies near $3,900 – $3,850, aligning with the projected measured move.
Technical Outlook:
If gold fails to reclaim the $4,050 level, further downside pressure remains likely. However, a close back above this level could invalidate the bearish breakout and signal a possible false break.
Xauusdlong

ANFIBO | XAUUSD - Bullish Head & Shoulder [10.29.2025]Hi traders, Anfibo's back!
XAUUSD Analysis – Daily Trading Plan
Overall Picture:
OANDA:XAUUSD recently reached a new ATH near $4,400/oz, before undergoing a healthy correction back to the $3,890 support level following an exceptionally strong rally fueled by geopolitical tensions. After this retracement, gold is now consolidating around the $4,000 zone, showing signs of breaking above the descending trendline on the H1 timeframe — a signal that short-term bullish momentum may be reemerging.
From a structural standpoint, this pullback appears to be part of a technical correction within an ongoing uptrend, not a trend reversal. Currently, the market is stabilizing and setting up for a potential new wave upward. I’m personally watching for a Head & Shoulders (H&S) formation to develop — this could offer optimal Buy and Sell opportunities depending on which neckline breaks first.
I still believe gold is likely to revisit the $4,200 area soon , as long as the $3,890 support holds firm and global risk sentiment continues to favor safe-haven assets.
Trading Plan for Today:
>>> SELL ZONE:
ENTRY: 4135 - 4150
SL: 4165
TP: 4045 - 4010 - 4000
>>> BUY ZONE:
ENTRY: 4000 - 4010
SL: 3990
TP: 4135 - 4150 - 4200
Risk Management:
- Prioritize Buy setups following the higher-timeframe trend; Sell only for intraday scalps.
- Maintain a minimum Risk:Reward ratio of 1:2.
- Avoid entries during major geopolitical or economic announcements.
- Monitor the Head & Shoulders pattern closely — confirmation will guide the next major move.
Conclusion:
Gold has completed a healthy correction after its parabolic surge to $4,400, and the market is now regrouping around the $4,000 zone, with early signs of renewed bullish momentum. As long as $3,890 remains intact, the broader trend remains bullish, and I expect a potential rebound toward $4,200 in the near term.
Patience and precision are key here — waiting for the Head & Shoulders formation to confirm will provide the best entry signals for both sides of the market. Until then, the bias remains bullish with a short-term recovery underway.
GOODLUCK, LOVE U GUYS!

LiamTrading - XAUUSD: Dual Strategy Ahead of FOMCLiamTrading - XAUUSD: Dual Strategy Ahead of FOMC - Prioritise Buying the Retracement at $3914
Hello trading community,
Following a significant sell-off, Gold is showing signs of a slight uplift, forming an upward structure. We continue to prioritise buying the recovery, viewing this as an intermediate correction within the larger downtrend. High volatility is imminent as the FOMC decision approaches.
📰 MACRO CONTEXT & FUNDAMENTAL FLOW
The market is displaying clear hesitation before the FED announcement:
Technical Recovery 🟢: Gold reversed its decline during Asian trading, recovering slightly from a three-week low as traders anticipate the FOMC interest rate decision.
Headwinds 🔴: Despite the recovery, optimism over US-China trade and a slight lift in the USD are acting as a barrier, limiting further buying momentum.
📊 TECHNICAL ANALYSIS & ACTION PLAN
Based on the current market structure, the strategy involves trading high-probability liquidity zones:
🟢 Primary BUY Recovery Scenario (BUY Primary)
We are looking for price to test the crucial Buy zone Liquidity to initiate the recovery wave.
Entry Zone (BUY): $3914
Stop Loss (SL): $3906 (Tight SL required)
Take Profit (TP): TP1: $3933 | TP2: $3956
🔴 SELL Continuation Scenario (SELL Retest/Scalping)
Using the broken trend area for short-term selling opportunities:
Entry Zone (SELL): $4048
Stop Loss (SL): $4056
Take Profit (TP): TP1: $4035 | TP2: $4022
SUMMARY & DISCIPLINE (Liam's Note)
Gold is in a decision zone. This is the time to apply a disciplined strategy: only enter at identified liquidity areas, and Always adhere to your Stop Loss (SL). Capital management is the number one priority before the FOMC event.
Wishing all traders a successful and disciplined trading session!

Gold price recovers - resistance zone 4000⭐️GOLDEN INFORMATION:
Gold (XAU/USD) bounces from an Asian session low near $3,916, edging away from a three-week trough hit on Monday. The metal’s pullback from record highs appears to pause, though gains remain limited as traders await the Fed’s policy decision, with a rate cut widely expected on Wednesday.
⭐️Personal comments NOVA:
Gold prices are recovering, as the market is looking forward to today's FED interest rate cut, regaining the 4000 mark.
⭐️SET UP GOLD PRICE:
🔥SELL GOLD zone: 4050 - 4052 SL 4057
TP1: $4040
TP2: $4030
TP3: $4020
🔥BUY GOLD zone: 3886 - 3884 SL 3879
TP1: $3900
TP2: $3910
TP3: $3925
⭐️Technical analysis:
Based on technical indicators EMA 34, EMA89 and support resistance areas to set up a reasonable BUY order.
⭐️NOTE:
Note: Nova wishes traders to manage their capital well
- take the number of lots that match your capital
- Takeprofit equal to 4-6% of capital account
- Stoplose equal to 2-3% of capital account

GoldXAUUSD
- Bearish Channel as an corrective pattern in Short Time Frame
- Break of Structure
- Completed " 12345 " Impulsive Waves
- Order Block
- Change of Characteristics

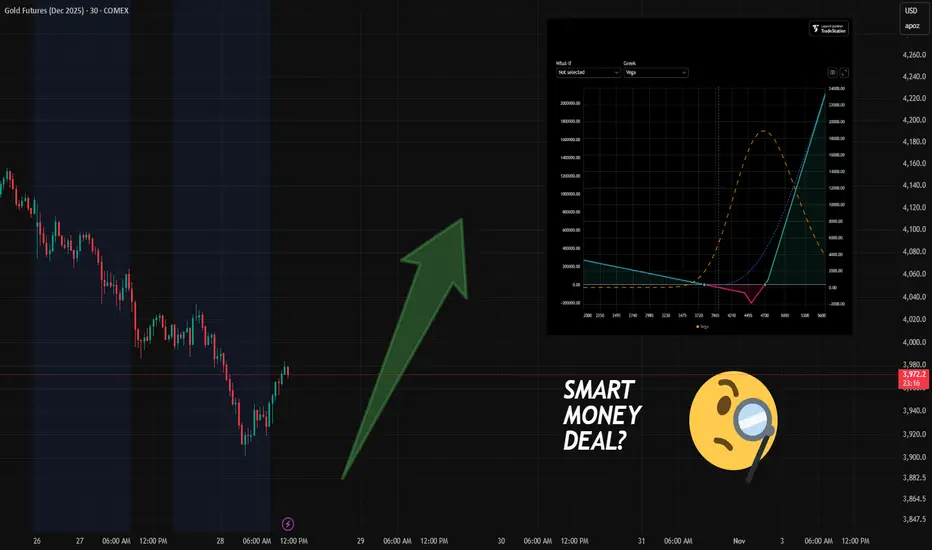
Quiet in FX Options — But Gold Is Heating Up
Over the past 24 hours, major currency options saw little of interest.
In contrast, precious metals — especially Gold — are attracting serious attention.
Let’s break down the key developments:
🔹 Observation #1: A New Bullish (But Hedged) Portfolio Appears
(See risk profile on screenshot.)
A new SMART option portfolio has entered the market:
Bullish bias, but with a built-in hedge — which reduces its predictive value.
If price drops below $3,800, the portfolio starts generating profit for its owner (via the hedge).
Built on the February 2025 futures contract, under an option series expiring in December 2025.
📌 Yes, it sounds confusing — and it is.
Option series expire, but futures live on.
This creates what we call "expiry risk" — a topic for another deep-dive article.
🔹 Observation #2: Put Activity at 3900 (Dec Series)
There’s growing activity in puts at the 3900 strike — moderate bullish positioning or support.
The bullish structure is hedged — not a pure directional bet.
Bearish positioning remains active.
Price has not yet shown signs of moving toward the main long setup.
I’d recommend at least 2–7 days of observation before considering any reversal trades.
📌 And here's why:
It’s rare for price to move immediately toward the target of a large, long-dated portfolio.
More often, there’s a delay of several days — especially when expiry is still far out.
Watch the flow.
Trade only when the edge is clear.
May the data-driven approach be with you!
“Gold Rebounds from Demand Zone — Short-Term Recovery Ahead”Analysis:
Gold (XAU/USD) on the 4-hour chart shows a strong corrective decline after forming an SMC trap near the 4,250–4,300 zone, where liquidity was swept before a sharp selloff. Price has now reached the High Probability POI (Point of Interest) around the 3,850–3,880 region, showing early signs of a bullish reaction.
The recent candle structure indicates buyers are stepping in from this demand zone, confirming a potential short-term reversal. If momentum sustains, the first target zone lies around 3,950–3,980, aligning with minor resistance and previous imbalance fill.
Outlook:
📈 Bias: Bullish correction (short-term)
🧭 Key Support: 3,850 – 3,880
🎯 Target: 3,950 – 3,980
⚠️ Invalidation: Break below 3,840 may reopen bearish continuation toward 3,780

LONG ON GOLD XAU/USDGOLD Has swept sell side liquidity at a major support zone.
It also has bullish divergence on the lower timeframes.
Additionally there is conflict between Iran and Israel which leads investors to safe havens like gold and silver.
I am looking to catch over 300 points on GOLD which is over 3000 pips.

XAU/USD: Bullish Rally to 4225?OANDA:XAUUSD is priming for a bullish rally on the 1-hour chart , with price pulling back to a critical support zone after a sharp decline, forming a potential reversal point as buyers defend against further downside amid overall uptrend signals. This setup highlights a classic dip-buy opportunity near the confluence of support and recent lows.
Entry zone between 4007-4037 for a long position. Target at 4225 near the resistance zone for attractive upside potential. 📊 Set a stop loss on a close below 3991 to manage risk effectively. 🌟 Keep an eye on confirmation through a bullish engulfing pattern or increased volume pushing above the entry, leveraging gold's volatility in response to USD movements.
Fundamentally , today's US Initial Jobless Claims and Existing Home Sales data could introduce volatility to gold and the dollar—Jobless Claims are forecasted at around 233K, while Existing Home Sales are expected near 4.00M, potentially strengthening USD if figures beat expectations and pressuring gold prices. 💡
📝 Trade Plan:
✅ Entry Zone: $4,007 – $4,037 (buy zone near support)
❌ Stop Loss: Close below $3,991
🎯 Target: $4,225 (resistance zone / take-profit area)
💎 Risk-to-Reward: More than 1:4, offering a strong technical edge.
What's your outlook on this trade? Share below! 👇

gold on sideway until breakout#XAUUSD now price have break new week low 3886, we await for breakout between the 3910 or 3932 2 times breakout to take new trade.
Below 3910 breakout sell, target 3876, stop loss 3926.
Above 3932 on 2 times breakout buy, target 3970, stop loss 3921.
The move needs to form strong pivot before possible selling.

Xau/usdXau/usd long term idea if the political situation is like this
dont forget capital management
dont forget the SL

analysis for Gold (XAU/USD) based on your 15-minute chart:he chart shows a descending channel (marked by “TRADE LINE”) that recently broke to the upside, suggesting a possible short-term bullish reversal.
A strong resistance zone is visible near 4140–4160, where price has previously rejected multiple times.
The target zone below is marked around 4042.57, which aligns with prior swing support.
Key Levels
Resistance: 4140 – 4160
Support: 4080 – 4060
Target (Downside): 4042
Upside Break Zone: Above 4160 could lead toward 4180+
Analysis Summary
The price broke out of a short-term bearish channel, indicating potential for a bullish correction toward resistance (4140–4160).
However, this zone is critical resistance; rejection here may trigger a pullback back toward 4080 or even the target at 4042.
Momentum indicators suggest the move is reactive (short-term retracement), not yet a trend reversal.
⚙️ Trading Outlook
Bearish Bias: Below 4140 → potential retest toward 4060–4040.
Bullish Confirmation: Only above 4160 → continuation to 4180–4200. MIL:RACE MIL:LDO MIL:STLAM MIL:ENI MIL:STMMI MIL:STMMI MIL:ENEL MIL:MONC MIL:PRY MIL:TIT MIL:FCT MIL:AZM MIL:WBD

Gold Price Analysis - Gold Breakout Levels 4200 vs 4040Gold is trading inside a tightening rising channel after forming a strong higher timeframe rejection from the ATH which pushed price into a corrective phase. Buyers have repeatedly defended the strong support zone near 4000-3980 creating a false breakout low followed by a controlled recovery showing that demand remains active.
However, each rally into the weak-high resistance at 4160-4200 has shown fading momentum meaning sellers are still protecting this zone aggressively. Until price breaks out with a clean close and retest above this resistance gold will remain in a neutral to slightly bullish consolidation phase driven by stop hunts and choppy movements inside the channel.
A successful breakout above 4200 can trigger a bullish continuation toward 4240 then 4320-4360 and possibly back to the ATH zone while a breakdown below 4040 rising support would shift the structure bearish again exposing the 3980 demand and potentially a deeper drop to 3900 if buyers fail there.
In simple terms buyers still control support, sellers still control resistance and the next big move will come once one of these critical levels breaks with strength.
✅ Option 1-Strong Bullish Bias
Gold is still respecting the rising channel and defending the strong support zone around 4000-3980. As long as price stays above the rising trendline bullish structure remains valid. A clean breakout above 4160-4200 will confirm continuation toward 4240 → 4320 → ATH retest. Buyers are still in the game, waiting for the breakout.
✅ Option 2-Neutral to Bullish
Gold is consolidating inside a rising channel after rejecting the ATH. Support remains strong around 4000-3980 while sellers continue to defend 4160-4200. A breakout on either side will define the next major move. Above 4200 bullish continuation toward 4240 and 4320+. Below 4040 deeper pullback toward 3980 and possibly 3900.
✅ Option 3-Neutral to Bearish
Gold is struggling to break above 4160-4200 showing seller strength at the top of the range. If price fails again and breaks below the rising channel near 4040 downside can accelerate toward 3980 and 3900 for liquidity. Bulls must hold support to avoid a deeper correction.
Gold remains trapped between 4040 support and 4200 resistance inside a rising wedge. Buyers holding strong at the bottom but sellers still defending the top. Break above 4200 bullish continuation toward 4320. Break below 4040 bearish move to 3980-3900. Still a range waiting for breakout confirmation.
Note
Please risk management in trading is a Key so use your money accordingly. If you like the idea then please like and boost. Thank you and Good Luck!

Gold price accumulation - sideways range⭐️GOLDEN INFORMATION:
Gold (XAU/USD) starts the week slightly lower but holds above Friday’s low during the Asian session. Easing US-China trade tensions lift risk appetite and weigh on the safe-haven metal, as reflected in stronger global equities. Still, dovish Fed expectations and a softer US Dollar help limit further losses.
⭐️Personal comments NOVA:
The US and ASEAN weekend tariff policy has a negative impact on gold prices, mainly accumulating buying power waiting for interest rate cuts.
⭐️SET UP GOLD PRICE:
🔥SELL GOLD zone: 4236 - 4238 SL 4243
TP1: $4220
TP2: $4200
TP3: $4185
🔥BUY GOLD zone: 3987 - 3985 SL 3980
TP1: $3998
TP2: $4010
TP3: $4030
⭐️Technical analysis:
Based on technical indicators EMA 34, EMA89 and support resistance areas to set up a reasonable SELL order.
⭐️NOTE:
Note: Nova wishes traders to manage their capital well
- take the number of lots that match your capital
- Takeprofit equal to 4-6% of capital account
- Stoplose equal to 2-3% of capital account

technical analysis for Gold (XAU/USD) based on your provided chaPrice: Around $4,112.53
Timeframe: 30-minute
Trend Structure: Gold is trading within a rising channel, suggesting short-term bullish momentum after rebounding from a support level.
🧭 Key Technical Zones
Support Level: $4,060 – $4,080
→ This zone has held price multiple times and aligns with the channel’s lower boundary.
Immediate Resistance: $4,125
→ Minor horizontal resistance, currently being retested.
Mid-term Resistance: $4,175 – $4,200
→ The upper boundary of the short-term consolidation range.
Main Target Zone: $4,381
→ Marked as the projected bullish target; aligns with the top of the ascending channel.
📊 Pattern & Projections
The chart shows a bullish continuation setup (possibly a flag or channel breakout in progress).
Price recently bounced from support and is respecting the ascending trendline, hinting at a possible push toward higher resistance levels.
A break above $4,125 could trigger momentum toward $4,175, then $4,225, and finally the target at $4,381.
⚠️ Risk Management
Invalidation: A close below $4,075 (support zone) would invalidate the bullish scenario and could push price back toward $4,025 – $4,000.
Stop-Loss (for buyers): Below $4,070.
Take-Profit Levels:
1️⃣ $4,175
2️⃣ $4,225
3️⃣ $4,381
🟢 Summary Signal
Bias: Bullish
Entry Zone: Around $4,100 – $4,115 (after confirmation of support hold)
Target: $4,381
Stop-Loss: $4,070 NASDAQ:TSLA NASDAQ:AAPL CME_MINI:NQ1! CME_MINI:ES1! COMEX:GC1! CBOT_MINI:YM1! COMEX_MINI:MGC1! NYMEX:CL1! COMEX:SI1! CME_MINI:RTY1! CBOT_MINI:MYM1!

GOLD ON SELL#XAUUSD price will continue bearish on 2 times breakout below 4058, we expect price to multiple break there before more dropping.
Entry 4058 2 times breakout, target 4022, stop loss 4075.
Price can sell from Market price also. The bullish depends on the cpi data release.

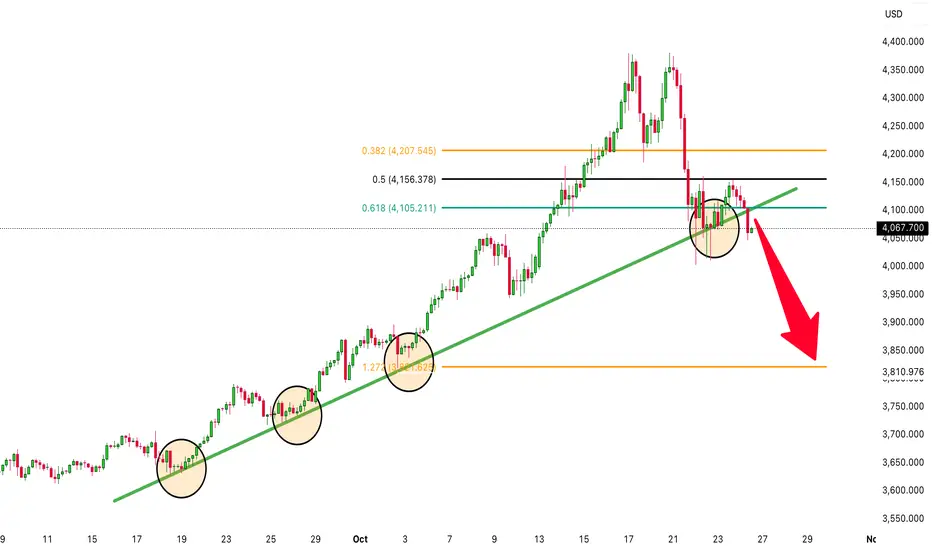
Time for GOLD To DROP! (XAUUSD is heading to the downside!)For many weeks gold (XAUUSD) has been sky rocketing to the upside, however there have been many new signals indicating that it could be a bearish move to the downside. Nothing keeps going up forever! Gold has broken major support levels including the trendline that has been holding it up for weeks. It has also been struggling to break above the fibonacci level of 0.50! Time to sell!
XAUUSD on consolidation ready for again upside XAUUSD is cool down & captured the consolidation zone from 4090-4140 .
What are my conditions For Today's session?
Currently i m looking for buy trade from 4085-4175 zone ,I'm expecting H4 and H1 Candle closing will be above 4100 .
Targets: 4145- 4175.
✳️Secondly if H4-H1 candle closes below 4070
our buying will be postpond and market will test 4045.

Gold price analysis on March 24XAUUSD – Bears Still in Control
Gold is trading sideways around the key resistance zone of 4145, indicating a strong struggle between buyers and sellers. However, the price has been repeatedly rejected at this zone, indicating that the bearish pressure is still dominant.
If the current trend is maintained, the support zone of 3946 will be the next potential target for the sellers. Only when the price clearly breaks above 4145, the current bearish structure can be broken and the new buying trend is confirmed.
📊 Trading Strategy:
SELL now at 4110
Target: 4022 – 3946
BUY setup: When the price breaks decisively above 4145

XAU/USD 10-23-25After the recent runup with gold it has pulled back to the 23.6 fib level on the daily timeframe and actually pushed below showing strong support in the 3975 - 4040 daily zone.
I would like to think that price will run right back up to retest the recent ATH of about 4382Gbut if I know gold in all her trickiness she will coast along at this 23.6 level then perhaps dip to the 38.2 or even the 50 then get a strong push back up to retest the high and from there probably come back down or push thru depending on macro economic and political events at that time.
Going back a few months to May of this year you can kind of see how price experienced similar behavior when it was breaking thru the 3430 - 3505 daily zone which obviously is that real push thru the previous psychological ATH level of 3500. Now history is repeating itself as we push to stay above the recent psychological ATH of 4000 towards 4500.
We shall see...

XAUUSD:Keep an eye on the 4,000 support mark📈The current price of London gold is 4,116.87 per ounce, up 28.36 from the previous trading day, with a percentage increase of 0.64%. So far today, the highest price has reached 4,137.35 per ounce, and the lowest is 4,065.47 per ounce. Currently, the price is in a state of fluctuating increase.
📝Market sentiment and fund flow:
Judging from the recent market performance, the price of London gold has fluctuated violently. On October 21st, the price of London gold once dropped by more than 6%, and the decline continued on the 22nd, with the lowest reaching 4,002.89 per ounce during the Asian session.
The significant decline in these two days was mainly due to the weakening of risk - off sentiment. The joint statement by the relevant parties in the Russia - Ukraine conflict in support of a cease - fire and the easing signals in Sino - US relations have weakened the safe - haven demand for gold.
At the same time, the previous large increase in the price of gold had accumulated a large number of profit - taking positions, and the pressure on investors to take profits was relatively high. However, the price rebounded on the 23rd, indicating that market sentiment has recovered to some extent, but overall it is still relatively cautious.
📝Technical analysis:
From the perspective of the 4 - hour cycle trend, the gold shows a trend of shifting from a bullish to a bearish rhythm in the short and medium term, forming a typical M - top pattern, which indicates that there may still be room for the price of gold to decline in the near future. However, the large - integer - level support of 4,000 per ounce is currently relatively clear, and in the short term, it may fluctuate within the range of 4,000 - 4,150. In terms of operation, it is mainly advisable to go short on rallies. The upper resistance level is in the range of 4,135 - 4,150, and the short-term support around the 4,065-4,070 range,then the key support level is in the range of 4,010 - 4,000.
💡In conclusion, the price has rebounded today, but due to the impact of the previous significant decline, it may fluctuate within the range of 4,000 - 4,150 per ounce in the short term, and the trend is uncertain. Investors need to closely pay attention to the changes in factors such as the geopolitical situation, Sino - US relations, and the Federal Reserve's policy.
💎Trading Strategy:
BUY 4010 - 4015
SL 4000
TP 4030 - 4020 - 4070
Sell 4120 - 4125
SL 4130
TP 4100 - 4080 - 4060
Daily-updated accurate signals are at your disposal. If you run into any problems while trading, these signals serve as a reliable reference—don’t hesitate to use them! I truly hope they bring you significant assistance

Price still in upwards channelAlright, here's the thing with gold. Recently, the price dropped sharply, almost 6%, which might sound alarming. But when we look at the bigger picture, gold is still in an upward channel or a rising trend. What does that mean? It shows that, despite this dip, gold still holds its value in the long run. Think of it like a staircase—sometimes you step down a bit, but you're still climbing higher overall. This is good news for investors because it means gold continues to act as a safe haven and a reliable hedge against things like inflation or economic uncertainty. The short-term drop could be due to temporary factors, but the long-term trend gives confidence that gold remains strong.
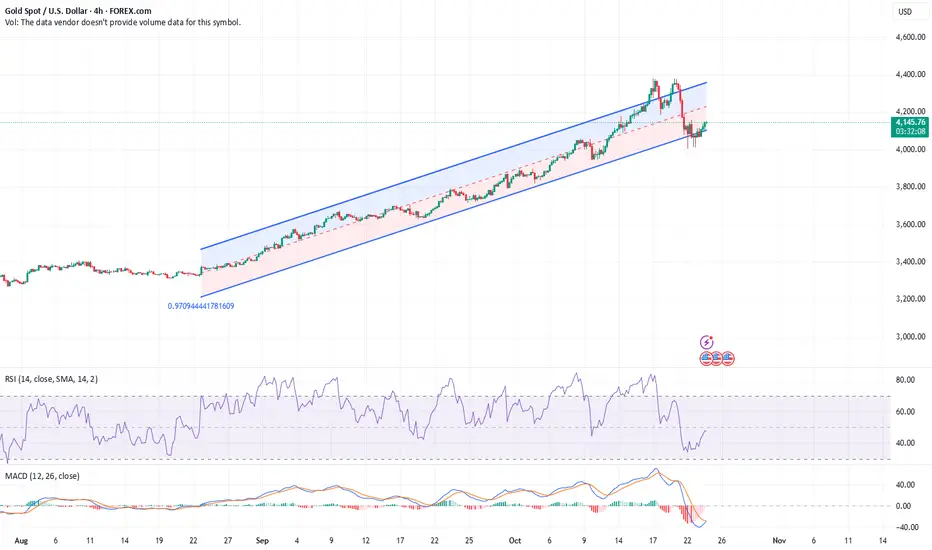
Price still in upwards channelAlright, here's the thing with gold. Recently, the price dropped sharply, which might look alarming. But when we look at the bigger picture, gold is still in an upward channel or a rising trend. What does that mean? It shows that, despite this dip, gold still holds its value in the long run. Think of it like a staircase—sometimes you step down a bit, but you're still climbing higher overall. This is good news for investors because it means gold continues to act as a safe haven and a reliable hedge against things like inflation or economic uncertainty. The short-term drop could be due to temporary factors, but the long-term trend gives confidence that gold remains strong.
