Bears Overstretched! Gold Ready to Strike Back Toward 4040!During the decline, gold once lost the 4000 mark and continued to fall to around 3971, then stopped falling and rebounded. It is now above 4000 again. It can be seen that after the bears vented their emotions and released space, there is still some buying funds quietly accumulating shares at low levels during the pullback.
After gold fell below 4000, market sentiment dropped to freezing point and was in a strong bearish atmosphere; however, after the bears vented their emotions and released space, the bearish force was calmed down, and gold may show mainly shock corrections, and may start to rebound with 3980-3970 area as support; that is to say, in the short term, as long as gold can hold the 3980-3970 area, gold still has a certain rebound potential; on the upside, we first focus on the 4030-4040 resistance area; the second is the 4070-4080 resistance area. However, according to the current market atmosphere and sentiment, it is expected that gold may find it difficult to reach the 4070-4080 area in the short term.
Therefore, it's crucial to accurately time short-term trading.
1.Based on the above considerations, the first priority is to short gold after it rebounds to the 4030-4040 area.
2. After gold retreats to the 3980-3970 area, as long as it holds above this area, there's still room for a rebound, so consider going long on gold based on support in this area!
Xauusdprediction

XAU/USD 27 October 2025 Intraday AnalysisH4 Analysis:
-> Swing: Bullish.
-> Internal: Bullish.
Analysis and bias remains the same as analysis dated 20 October 2025.
Price has printed as per previous intraday expectation by printing a bearish CHoCH which indicates, but not confirms, bullish pullback phase initiation.
Price is currently trading within an established internal range, however, I will continue to monitor price with regards to depth of pullback.
Intraday expectation:
Price to continue bearish, react at either discount of 50% internal EQ, or H4 supply zone before targeting weak internal high priced at 4,380. 990.
Note:
The Federal Reserve’s sustained dovish stance, coupled with ongoing geopolitical uncertainties, is likely to prolong heightened volatility in the gold market. Given this elevated risk environment, traders should exercise caution and recalibrate risk management strategies to navigate potential price fluctuations effectively.
Additionally, gold pricing remains sensitive to broader macroeconomic developments, including policy decisions under President Trump. Shifts in geopolitical strategy and economic directives could further amplify uncertainty, contributing to market repricing dynamics.
H4 Chart:
M15 Analysis:
-> Swing: Bullish.
-> Internal: Bearish.
Analysis and bias remains the same as yesterday's analysis dated 22 October 2025.
Price has printed according to my analysis dated 20 October 2025 where I mention that price is to continue bullish, react at either premium of 50% internal EQ, or M15 demand zone, before targeting weak internal low priced at 4,185.910.
Price has printed a bearish iBOS and subsequently a bullish CHoCH to indicate, but not confirm bullish pullback phase initiation.
Price is now trading within an established internal range.
Intraday expectation:
Price to react at either premium of 50% internal EQ, or M15 demand zone, before targeting weak internal low priced at 4,004.280.
Note:
Gold remains highly volatile amid the Federal Reserve's continued dovish stance, persistent and escalating geopolitical uncertainties. Traders should implement robust risk management strategies and remain vigilant, as price swings may become more pronounced in this elevated volatility environment.
Additionally, President Trump’s tariff announcements, particularly against China, are expected to further amplify market turbulence, potentially triggering sharp price fluctuations and whipsaws.
M15 Chart:

XAU/USD | Gold Under Pressure, Support & Resistance to WatchGold continues to trade under pressure, holding below both the MA50 and MA200, keeping short-term momentum firmly tilted to the downside. Price is currently hovering just below the 4,095 support level, with the market remaining range-bound within a broader corrective structure.
Buyers will need a confirmed break above 4,137 to trigger a potential recovery toward 4,178 and 4,234.
On the downside, the 4,042–3,987 Support Zone serves as an intermediate area to monitor for short-term reactions. A failure to hold this zone could extend the decline toward the Deeper Support Zone, which remains a major reaction area where dip-buyers are expected to re-enter the market.
📌 Key levels to watch:
Resistance:
4095
4136
4178
4234
4285
Support:
4042
3987
3944
🔎 Fundamental focus:
Gold remains under pressure as traders weigh ongoing U.S. government shutdown risks and delayed economic data, which have limited visibility into the real state of the economy.
While short-term price action remains corrective, safe-haven demand and macro uncertainty are still expected to support gold on deeper dips toward key demand zones.

XAU/USD Technical Setup ‖ Bullish Momentum or Smart Trap?🏆 XAU/USD: The Golden Heist Blueprint | Swing & Scalp Strategy 💰
📊 Market Overview
Asset: XAU/USD (Gold vs U.S. Dollar)
Market: Precious Metals
Strategy Type: Dual Setup - Swing Trading (Bullish) & Day Trading/Scalping (Bearish)
Risk Level: High Volatility Zone ⚠️
🎯 The Master Plan
🚀 Bullish Scenario: "To The Moon" Setup
Breakout Level: $4,400.00
Action: Direct long entry on confirmed breakout above resistance
Logic: Clean break = institutional momentum shift
🔻 Bearish Scenario: Scalping/Day Trade Setup
Breakdown Level: $4,050.00
Action: Short positions on confirmed break below support
⚠️ Trap Alert: Any pullback above $4,050.00 post-breakdown = potential smart money trap. Watch for false breakouts!
🛡️ Risk Management Zone
Stop Loss (Pullback Buy Plan): $3,950.00
⚠️ Disclaimer: This SL is based on my analysis for the bullish pullback scenario. You're the captain of your own ship! Adjust stops according to your risk tolerance, account size, and trading style. Never risk more than you can afford to lose.
🎖️ Profit Targets
Buy Side Target: $4,600.00
Exit Strategy Notes:
Strong resistance confluence at this level
Overbought conditions likely
Potential trap zone for late entries
Recommendation: Scale out profits gradually rather than waiting for the full target
Sell Side Target: $4,050.00
Exit Strategy Notes:
Major support level - expect bounces
High probability of liquidity grab at this zone
Consider partial profit taking before reaching full target
Recommendation: Trail stops as price moves in your favor
⚠️ Disclaimer: These targets are MY analysis, not financial advice. Take profits when YOUR strategy signals, not mine. Trail stops, scale out, or exit based on YOUR plan. Your money, your rules! 💪
🔗 Related Markets to Watch
Correlated Assets:
DXY (U.S. Dollar Index): Inverse correlation - Dollar strength = Gold weakness
GC (Gold Futures): Direct correlation - Institutional positioning indicator
XAUEUR (Gold vs Euro): Alternative safe-haven flow gauge
US10Y (10-Year Treasury Yield): Inverse correlation - Rising yields pressure Gold
BTCUSD (Bitcoin): Risk-on/risk-off sentiment indicator
Key Fundamental Drivers:
Fed monetary policy & interest rate decisions
Inflation data (CPI/PCE reports)
Geopolitical tensions (safe-haven demand)
Real yields & opportunity cost
🔑 Key Technical Points
✅ Breakout Confirmation: Wait for candle close above/below key levels
✅ Volume Analysis: High volume breakouts = higher probability
✅ Smart Money Traps: Watch for failed breakouts and liquidity grabs
✅ Risk-Reward Ratio: Calculate before entry - minimum 1:2 recommended
✅ Market Structure: Respect higher timeframe trends
🎭 Trading Psychology Reminder
This strategy has a playful "heist" theme for entertainment, but make no mistake — treat your capital with serious respect. The market doesn't care about our plans. Adapt, manage risk, and preserve capital above all else.
Remember:
No setup is guaranteed
Always use stop losses
Never risk your rent money
Emotions are the enemy
The market pays patient traders
✨ If you find value in my analysis, a 👍 and 🚀 boost is much appreciated — it helps me share more setups with the community!
#XAUUSD #Gold #GoldTrading #ForexTrading #SwingTrading #DayTrading #Scalping #TechnicalAnalysis #PreciousMetals #TradingStrategy #RiskManagement #Forex #GoldAnalysis #TradingIdeas #MarketAnalysis #PriceAction #Breakout #SupportAndResistance #TradingView #ForexSignals
Happy trading, and may the pips be ever in your favor! 🎯💎

ElDoradoFx PREMIUM – GOLD ANALYSIS (28/10/2025, LONDON SESSIONGold extended its bearish continuation during Asia, breaking below 3,940, confirming dominance of sellers. London opens with price sitting near 3,935–3,940, still within the bearish structure that began at 4,106.
Momentum is strongly negative, with EMAs (50/100/200) aligned downward and RSI below 40 across all intraday frames. The market remains inside a descending channel — each recovery is being sold aggressively.
⸻
2️⃣ Technical Breakdown
🔹 Daily (D1)
• Fourth consecutive bearish candle confirms strong downside momentum.
• RSI (46) still neutral but leaning bearish; MACD histogram fully red.
• Price approaching potential higher-timeframe support near 3,900–3,880.
Bias: Bearish correction still in play until 3,880 or D1 reversal candle appears.
🔸 H1
• Structure: clean lower highs (4,106 → 4,048 → 3,997) and lower lows (3,971 → 3,935).
• RSI (27) deeply oversold, signaling possible micro bounce but no reversal yet.
• 100/200 EMA above at 3,990–4,040 acting as strong resistance.
Bias: Bearish below 4,000, corrective pullback likely capped at 3,995–4,010.
🔹 M15
• Extended downtrend channel remains active.
• Every minor pullback rejected under 3,950–3,960.
• MACD shows no bullish divergence yet; sellers still in control.
Bias: Sell pullbacks near resistance levels.
🔹 M5
• Micro CHoCH confirmed lower highs.
• RSI near 30 with weak attempt to rebound.
• Short-term liquidity zone forming 3,930–3,940, potential area for retest before continuation.
Bias: Bearish to neutral; short rallies only if confirmed rejection on M5–M15.
⸻
3️⃣ Fibonacci Analysis (Golden Zone)
Last H1 swing: High 4,106 → Low 3,935
• 🔸 38.2% → 3,990
• 🔸 50% → 4,009
• 🔸 61.8% → 4,028
✅ Golden Zone = 3,990 – 4,028
This zone aligns with the H1 supply area and EMA confluence, making it the optimal retracement level to rejoin the bearish trend.
⸻
4️⃣ High-Probability Trade Scenarios
📉 SELL SCENARIO (High Probability)
• Entry: 3,990 – 4,028 (Golden Zone)
• Stop-Loss: 4,035 – 4,045
• Targets: 3,955 → 3,935 → 3,910 → 3,885
• Confluence: EMA cluster, Fib 61.8%, trendline resistance
• Bias: Strong short continuation if rejection occurs inside Golden Zone
⸻
⚡ BREAKDOWN SELL
• Trigger: Clean H1 candle close below 3,930
• Entry: 3,928 – 3,935 on retest
• Stop-Loss: Above 3,945
• Targets: 3,912 → 3,900 → 3,885
• Bias: Follows continuation of bearish momentum below weak low.
⸻
🟢 COUNTERTREND BUY (Low Probability)
• Trigger: Bullish BOS + strong engulfing candle above 3,960
• Entry: 3,960 – 3,965
• Stop-Loss: 3,940
• Targets: 3,985 → 3,995 → 4,009
• Bias: Only if London forms a liquidity sweep under 3,930 with strong reclaim.
⸻
5️⃣ Fundamental Watch
• No major Asia data; London expected to move with USD Index (DXY) flows.
• DXY above 106 favors continued gold weakness.
• Traders monitoring US GDP & PCE later this week, meaning liquidity could tighten today.
• Expect volatility spikes near London–NY overlap as large players position early.
⸻
6️⃣ Key Technical Levels
Type Price Levels
Resistance 3,960 / 3,975 / 3,990 / 4,009 / 4,028
Support 3,935 / 3,924 / 3,910 / 3,885 / 3,872
Golden Zone 3,990 – 4,028
Breakdown Trigger < 3,930
Bullish Reclaim Trigger > 3,965
⸻
7️⃣ Analyst Summary
The bearish structure remains dominant across all timeframes. Momentum favors continuation toward 3,910–3,885, with the best entry region at 3,990–4,028 Golden Zone.
If London opens with liquidity sweeps below 3,930, wait for a quick retracement to sell at premium pricing.
Only strong reclaim above 3,965 could trigger a short-term intraday recovery to 3,990–4,009 before sellers step in again.
⸻
8️⃣ Final Bias Summary
📉 Primary Bias: Bearish – Sell rallies into 3,990–4,028
📈 Secondary Bias: Bullish only above 3,965 (confirmed reclaim)
🎯 Targets: 3,955 → 3,935 → 3,910 → 3,885
✨ Golden Zone: 3,990 – 4,028
🛑 Invalidation: H1 close above 4,045
⸻
— ElDoradoFx PREMIUM 2.0 Team 🚀
⸻

XAU/USD Market Structure Reveals Potential Upside Move!🥇 XAU/USD: "Gold Heist Wealth Map" - Swing/Day Trade Blueprint 🚨
🎉 Ladies & Gentlemen, Thief OGs! Welcome to the Gold Heist Wealth Map for XAU/USD (Gold vs. U.S. Dollar) — a cheeky, calculated swing/day trade plan to snatch profits from the metals market! 😎 This setup is designed with a thief-style layered entry strategy, bullish vibes, and a pro-level escape plan to dodge the "police barricades" (resistance zones). Let’s dive into this shiny opportunity with a fun yet professional edge! 💰
📈 Trade Setup: The Gold Heist Plan
Asset: XAU/USD (Gold vs. U.S. Dollar)
Outlook: Bullish 📈
Strategy: Thief-Style Layered Limit Orders — multiple buy limit entries to maximize your loot! 🕵️♂️
Entry Levels:
🔔 Buy Limit @ 3850
🔔 Buy Limit @ 3880
🔔 Buy Limit @ 3900
🔔 Buy Limit @ 3930
Pro Tip: Feel free to add more layers based on your risk appetite! Stack those entries like a master thief. 😜
Stop Loss (SL): Set at 3800 (the "Thief’s Exit Door"). 🚪
Note: This SL is my suggestion, but you’re the boss of your heist! Adjust based on your risk tolerance. 💸
Take Profit (TP): Aim for 4100 — a juicy target where a police barricade (strong resistance + overbought zone) might set a trap. Escape with profits before the market cuffs you! 👮♂️
Note: TP is my call, but take your loot when you feel the heat! Your trade, your rules. 😎
🛠️ Strategy Breakdown: Why This Setup?
Thief-Style Layering: Using multiple buy limit orders spreads your entry risk across price levels, letting you sneak into the market like a pro. 🕵️♀️
Bullish Momentum: Gold’s been shining bright with macroeconomic tailwinds (USD weakness, inflation hedges). 📡
Resistance Watch: The 4100 zone is a psychological and technical barricade. Overbought signals + potential traps mean it’s time to cash out smartly. 🏦
Risk Management: The 3800 SL keeps your downside locked, but always tailor it to your account size and risk profile. ⚖️
🔗 Related Pairs to Watch (in USD)
Keep an eye on these correlated assets to boost your market awareness:
OANDA:XAUUSD (Silver vs. U.S. Dollar): Silver often moves in tandem with gold. Watch for similar bullish setups or divergences.
USD Index ( TVC:DXY ): A weaker USD typically fuels gold rallies. Monitor DXY for inverse correlation signals. 📉
OANDA:AUDUSD : Gold prices often align with the Aussie dollar due to Australia’s gold exports. A rising AUD/USD could support our bullish XAU/USD bias. 🇦🇺
Key Correlation Insight: Gold thrives in low-rate environments or when USD weakens. Check economic calendars for Fed rate decisions or inflation data (CPI, PPI) to time your entries. 📅
⚠️ Disclaimer
This Thief-Style Trading Strategy is for fun and educational purposes only! Trading involves risks, and you’re responsible for your own decisions. Always do your own research (DYOR) and manage risk wisely. No financial advice here — just a playful map to navigate the markets! 😄
✨ If you find value in my analysis, a 👍 and 🚀 boost is much appreciated — it helps me share more setups with the community!
#XAUUSD #Gold #SwingTrading #DayTrading #ThiefStrategy #Bullish #Forex #MetalsMarket

Gold Breakdown Alert! Bears Aiming $3980 NextGold is currently showing a descending triangle / bearish channel pattern on the 15-minute chart. After testing the upper trendline resistance around 4113–4115, price has started to reject, indicating potential downward pressure.
The trendlines show clear lower highs and lower lows, confirming a short-term bearish structure. Volume is also decreasing on upward moves, suggesting weakening buying momentum.
📉 Trade Setup (Scalping / Intraday)
Signal: 🔻 SELL XAU/USD below 4105
Entry Zone: 4105 – 4110
Target 1: 4050
Target 2: 3980
Stop Loss: 4135
Risk/Reward Ratio: ~1:2
⚙️ Technical Indicators
Trendline Resistance: 4115
Support Zone: 4050 / 3980
Momentum: Bearish bias
Structure: Lower highs forming under descending resistance
💬 Analyst View
Gold may continue its short-term correction phase if it fails to hold above the 4110 resistance zone. A breakout below 4100 could trigger a fresh wave of selling pressure targeting the 4050 area initially.
If bulls reclaim 4135, this analysis becomes invalid and could shift bias to neutral.

Last trading day. Watch for resistance levels.After the CPI data was released as expected, while the results appear bullish for gold, the market reaction was muted, and the price rebound was relatively weak. This is likely because the current gains may have already overdrawn all positive expectations, and the market needs a period of cooling off.
On the 4-hour chart, gold prices rose on the data, returning to a range of fluctuations. The moving averages are showing a relatively flat trend. The 5-, 10-, and 20-minute moving averages intersect with the middle Bollinger Band in the 4100-4110 range, which also represents a significant short-term support level. The 30-minute moving average is nearing its intersection with the upper Bollinger Band in the 4170-4180 range.
Based on technical indicators, watch for resistance at 4160 in the short term, with a breakout at 4180. Focus on support at 4100-4110 below.
Quaid believes that as the last trading day of the week, the price may also fluctuate slightly around 4130. But if it suddenly starts to break upward, then we need to pay attention to the suppression situation above. When the price first hits around 4160 and fails to break upward effectively, short sell with a light position at this position and make a profit of 30-40 points.
A happy weekend is coming, Quaid hopes everyone reaches their profit targets this week.

XAU/USD Intraday Plan | Support & Resistance to WatchGold remains under downside pressure after failing to hold above the 4151 resistance yesterday, with price now trading around 4104. The metal continues to trade below both the MA50 and MA200, confirming that short-term momentum remains bearish within a broader corrective phase.
If buyers can reclaim 4117 and 4151, a corrective bounce toward 4192 and 4227 may follow. However, failure to defend 4075 could trigger another wave of selling toward 4020, and potentially deeper into the 3984-3953 zone, where fresh demand could start building up.
📌 Key levels to watch:
Resistance:
4117
4151
4192
4227
Support:
4075
4044
4020
3984
🔎 Fundamental focus:
Gold continues to trade under macro uncertainty as the U.S. government shutdown drags on, delaying major data releases and weighing on investor confidence. The lack of economic transparency has led to erratic price swings, while persistent U.S.–China trade tensions and weaker manufacturing sentiment add further risk aversion.

ElDoradoFx PREMIUM – GOLD ANALYSIS (22/10/2025, ASIA SESSION)Gold (XAUUSD) is currently trading around 4,125, attempting a minor recovery after a strong bearish breakdown during the US session. Price found near-term liquidity around 4,106–4,100, where a short-term bounce is unfolding. Despite this pullback attempt, the overall structure remains bearish unless key resistance levels are reclaimed.
⸻
🔍 Technical Outlook
Daily Chart (D1)
• Strong bearish candle formed after rejection from 4,381.
• Price still above 20EMA and well above 50EMA, confirming a corrective move within a broader bullish trend.
• RSI cooling from overbought; now around mid-level, room for either further correction or bounce.
• MACD still positive but histogram weakening, suggesting potential retracement or pause.
Bias: Corrective bearish inside macro bullish trend.
⸻
1H Chart (H1)
• Clear bearish shift with BOS confirmed below 4,254 and 4,229.
• Rejection from 20EMA and 50EMA above (4,170–4,249) confirms intraday bearish bias.
• RSI recovering from oversold (26→38) indicating a potential pullback leg.
• If gold climbs into 4,160–4,198 zone and rejects, bearish continuation likely.
Intraday Bias: Bearish until H1 closes above 4,200–4,210.
⸻
15M Chart (M15)
• Minor CHoCH formed after bounce at 4,106, with price entering a corrective channel.
• RSI around 55 → short-term recovery phase.
• MACD histogram green but still shallow → possible retracement only.
• Price approaching first resistance around 4,140–4,150.
Short-term View: Pullback phase inside bearish structure.
⸻
5M Chart (M5)
• Series of higher lows forming → bullish momentum attempt.
• MACD positive with expanding green bars.
• RSI above 55 suggests buyers in short control, but nearing resistance.
⸻
✨ Fibonacci Golden Zone
Recent impulse: High 4,254 → Low 4,106
🔹 38.2% Fib = 4,160
🔹 50% Fib = 4,180
🔹 61.8% Fib = 4,198
✅ Golden Zone: 4,160 – 4,198
This zone aligns with intraday EMA resistance and H1 supply, making it a key sell area if rejection occurs.
⸻
🎯 High Probability Scenarios
✅ Bearish Continuation Setup (Preferred)
⚠️ Sell in the 4,160–4,198 Golden Zone upon bearish rejection.
🎯 Targets → 4,140 → 4,120 → 4,106 → 4,080
🛑 SL above 4,210
✅ Breakout Sell (Momentum Play)
⚠️ Sell below 4,106 (Break & Retest)
🎯 Targets → 4,080 → 4,060 → 4,040
🛑 SL above 4,120
⸻
🟢 Bullish Countertrend Setup (Lower Probability)
✅ Buy from 4,106–4,100 only if strong bullish engulfing + MACD flip appear.
🎯 Targets → 4,140 → 4,160 → 4,180
🛑 SL below 4,090
🟢 Bullish Breakout Setup (Structure Shift Only)
✅ Buy above 4,200 (Break & Retest)
🎯 Targets → 4,229 → 4,254
🛑 SL below 4,180
⸻
📅 Fundamental Outlook – Asia Session
• No major Asian economic catalysts early session → market may retrace or range.
• Traders likely positioning for NY session after heavy US selling.
• USD Index holding firm; any DXY weakness could extend pullback.
• Focus shifts to US jobless data and Fed sentiment later today.
⸻
⚠ Key Levels to Watch
Type Level Description
Resistance 4,140 / 4,160 First intraday rejection zones
Resistance 4,180 / 4,198 Fibonacci Golden Zone
Support 4,120 Minor intraday support
Support 4,106–4,100 Liquidity shelf
Support 4,080 Deep corrective target
⸻
✅ Summary
Gold is undergoing a corrective bounce within a bearish intraday trend. The Golden Zone (4,160–4,198) is the critical area for potential continuation sells if rejection is confirmed. A failure to clear 4,200 keeps sellers in control. Buyers only gain momentum above 4,200, or at deep retests near 4,106 with bullish confirmation.
🟢 Reversal Buy only if 4,106 holds with strength.
🔻 Main Scenario: Sell rallies from 4,160–4,198 zone.
📉 Break Confirmation: Sell below 4,106.
✨ Golden Zone: 4,160 – 4,198.
⸻
🥇 ElDoradoFx PREMIUM 2.0 – PERFORMANCE 21/10/2025 🥇
📊 GOLD TRADE RESULTS:
🔻 SELL +210 pips
🟢 BUY LIMIT +20 pips
❌ BUY –40 pips (SL)
🟢 BUY +70 pips
🟢 BUY +100 pips
🔻 SELL +210 pips
🟢 BUY +270 pips
---
💰 TOTAL GOLD PIPS WON: ✅ +840 pips
📈 RESULT: 7 Signals → 6 Wins | 1 SL
🎯 ACCURACY: 86%
---
🔥 Solid upward momentum and precision in reversals — swing continuation played out beautifully 📈💎
👏 Congratulations if you profited! ✅✅✅🚀🚀🚀

XAU/USD Intraday Plan | Support & Resistance to WatchGold attempted another run-up yesterday but failed to sustain momentum, leading to a renewed pullback this session. Price is currently trading around 4259, slipping below the MA50 as short-term momentum softens after repeated rejections from the 4362 resistance zone.
Despite the rejection the broader trend remains bullish above the MA200, though short-term momentum has clearly weakened. If buyers manage to reclaim 4321, gold could reattempt the upside toward 4362 and 4406.
However, a break below 4,279 would expose the First Reaction Zone (4,227–4,192), where buyers will likely defend to maintain trend structure. A deeper breakdown beneath this area could open the way toward 4,151–4,117 near the MA200.
📌 Key levels to watch:
Resistance:
4321
4362
4406
Support:
4279
4227
4192
4151
4117
🔎 Fundamental focus:
The U.S. government shutdown continues to pressure risk sentiment, with political negotiations showing little progress. Several key data releases this week, including PMI and durable goods orders, remain uncertain due to the data blackout, adding to market caution.

XAU/USD Intraday Plan | Support & Resistance to WatchGold had a strong pullback on Friday following last week’s sharp rally and is now consolidating between 4,279 and 4,227. The retracement has allowed the market to cool off after consecutive all-time highs, while buyers are still defending the First Reaction Zone (4,227–4,192).
Price remains above the MA200, maintaining the broader bullish structure, but continues to struggle reclaiming the MA50, which now acts as short-term resistance. A break above 4,279 could re-ignite bullish momentum toward 4,321 and 4,362, while a failure to hold 4,227 may invite deeper correction toward 4,151–4,117.
📌 Key levels to watch:
Resistance:
4279
4321
4362
4406
Support:
4227
4192
4151
4117
🔎 Fundamental focus:
This week’s calendar features key U.S. data releases, including Flash PMIs, Durable Goods Orders, and Consumer Sentiment, though many reports risk delay due to the ongoing government shutdown. The blackout continues to cloud market visibility and reinforce safe-haven demand for gold.

XAU/USD 16 October 2025 Intraday AnalysisH4 Analysis:
-> Swing: Bullish.
-> Internal: Bullish.
Analysis and bias remains the same as yesterday's analysis, however CHoCH positioning has moved closer to more recent price action.
Price has printed a further bullish iBOS, however, I will apply discretion and not classify it as such due to the insignificant depth of pullback relative to recent price action.
At the time of this analysis price is continuing to print bullish without pause, which, as a result, I am unable to confirm a fractal high.
Current bearish CHoCH positioning is denoted with a blue horizontal dotted line.
Intraday expectation:
Price to print bearish CHoCH to indicate bearish pullback phase initiation.
Note:
The Federal Reserve’s sustained dovish stance, coupled with ongoing geopolitical uncertainties, is likely to prolong heightened volatility in the gold market. Given this elevated risk environment, traders should exercise caution and recalibrate risk management strategies to navigate potential price fluctuations effectively.
Additionally, gold pricing remains sensitive to broader macroeconomic developments, including policy decisions under President Trump. Shifts in geopolitical strategy and economic directives could further amplify uncertainty, contributing to market repricing dynamics.
H4 Chart:
M15 Analysis:
-> Swing: Bullish.
-> Internal: Bullish.
Price has continued bullish printing further ATH's.
Price has printed a bullish iBOS and has reacted from discount of 50% EQ.
Intraday expectation:
Price to target weak internal high, priced at 4,242.380.
Alternative scenario: As all higher timeframes are requiring a pullback, and we are seeing a narrowing of internal structure, price could target strong internal low.
Note:
Gold remains highly volatile amid the Federal Reserve's continued dovish stance, persistent and escalating geopolitical uncertainties. Traders should implement robust risk management strategies and remain vigilant, as price swings may become more pronounced in this elevated volatility environment.
Additionally, President Trump’s tariff announcements, particularly against China, are expected to further amplify market turbulence, potentially triggering sharp price fluctuations and whipsaws.
M15 Chart:

XAU/USD 14 October 2025 Intraday AnalysisH4 Analysis:
-> Swing: Bullish.
-> Internal: Bullish.
Price has printed according to yesterday's intraday expectation by printing a bearish CHoCH.
We are now trading within an established internal range.
Intraday expectation:
Price to continue bearish, react at either discount of internal 50% EQ, or H4 supply zone before targeting weak internal high priced at 4,179.935
Note:
The Federal Reserve’s sustained dovish stance, coupled with ongoing geopolitical uncertainties, is likely to prolong heightened volatility in the gold market. Given this elevated risk environment, traders should exercise caution and recalibrate risk management strategies to navigate potential price fluctuations effectively.
Additionally, gold pricing remains sensitive to broader macroeconomic developments, including policy decisions under President Trump. Shifts in geopolitical strategy and economic directives could further amplify uncertainty, contributing to market repricing dynamics.
H4 Chart:
M15 Analysis:
-> Swing: Bullish.
-> Internal: Bullish.
Price has continued bullish printing further ATH's.
During the bullish run, price has printed two very insignificant bearish CHoCH's before price continued bullish.
Due to the insignificance of the bearish CHoCH's I have left them unmarked.
Price has since printed a further bearish CHoCH which is denoted with a blue horizontal dotted line.
We are now trading within an established internal range, however, I shall continue to monitor price with regards to depth of pullback.
Intraday expectation:
Price to continue bearish, react at either discount of internal 50% EQ, or M15 supply zone before targeting weak internal high priced at 4,179.135.
Note:
Gold remains highly volatile amid the Federal Reserve's continued dovish stance, persistent and escalating geopolitical uncertainties. Traders should implement robust risk management strategies and remain vigilant, as price swings may become more pronounced in this elevated volatility environment.
Additionally, President Trump’s tariff announcements, particularly against China, are expected to further amplify market turbulence, potentially triggering sharp price fluctuations and whipsaws.
M15 Chart:

XAU/USD Intraday Plan | Support & Resistance to WatchGold continues to extend its bullish move, currently trading around 4070 after reclaiming the 4051 resistance. Next resistance sits at 4082 — a clean break above this level could open the path toward 4112, aligning with the rising channel’s upper trendline.
If price fails to sustain momentum above 4082, a pullback toward lower support levels is likely.
The first support lies near 4020–3984, where the 50MA may offer dynamic support.
A deeper retracement could extend into the First Reaction Zone, which aligns closely with the channel’s lower trendline and may attract renewed buyer interest.
📌Key levels to watch:
Resistance:
4082
4112
Support:
4051
4020
3984
3953
3924
🔎Fundamental Focus – Week of Oct 13, 2025
The focus this week shifts to Fed Chair Powell’s speech on Tuesday, which could shape expectations for the next policy move.
⚠️ US Government Shutdown Update:
Shutdown risks remain elevated as negotiations in Congress continue to stall. The impasse threatens to delay the release of key economic data, adding uncertainty and volatility to markets. Any sign of progress or breakdown in talks could trigger sharp moves in USD and gold.

XAU/USD 10 October 2025 Intraday AnalysisH4 Analysis:
-> Swing: Bullish.
-> Internal: Bullish.
Price printed according to yesterday's analysis where I mentioned price to indicate bearish pullback phase initiation by printing bearish CHoCH.
Price is currently trading within an established internal range.
Intraday Expectation:
Price to continue bearish, react at either discount of 50% EQ or H4 supply zone before targeting weak internal high priced at 4059.350
Note:
The Federal Reserve’s sustained dovish stance, coupled with ongoing geopolitical uncertainties, is likely to prolong heightened volatility in the gold market. Given this elevated risk environment, traders should exercise caution and recalibrate risk management strategies to navigate potential price fluctuations effectively.
Additionally, gold pricing remains sensitive to broader macroeconomic developments, including policy decisions under President Trump. Shifts in geopolitical strategy and economic directives could further amplify uncertainty, contributing to market repricing dynamics.
H4 Chart:
M15 Analysis:
-> Swing: Bullish.
-> Internal: Bullish.
Analysis and bias remains the same as yesterday's analysis dated 09 October 2025.
Price continued bullish, printing further ATH's.
Price has printed a bearish CHoCH, however, as mentioned in yesterday's analysis, I will be monitoring depth of pullback. Pullback is insignificant, therefore, I will again apply discretion and not classify as such. I have however marked this in red.
Price has since printed a further bearish CHOCH which means that price is now trading within an established internal range. However, I shall, again, be monitoring depth of pullback.
Intraday expectation: Price to trade down to either discount of 50% EQ, or M15 supply zone before targeting weak internal high priced at 4,059.350.
Alternative Scenario: Price could potentially target strong internal low as H4 TF enters it's bearish pullback phase.
Note:
Gold remains highly volatile amid the Federal Reserve's continued dovish stance, persistent and escalating geopolitical uncertainties. Traders should implement robust risk management strategies and remain vigilant, as price swings may become more pronounced in this elevated volatility environment.
Additionally, President Trump’s tariff announcements are expected to further amplify market turbulence, potentially triggering sharp price fluctuations and whipsaws.
M15 Chart:

Gold Daily Bullish FVG Reaction with Upside Targetsa bullish setup on Gold (XAU/USD) in the daily timeframe. After a sharp decline, price has entered a highlighted “Daily Fair Value Gap (FVG)” zone, suggesting a potential area of demand or price imbalance. From this zone, a possible bullish reaction is indicated with an upward arrow, projecting a retracement toward three target levels: Target 1 at 3,970, Target 2 at 3,980, and Target 3 at 3,990. The chart implies that if the price maintains support within the FVG area, a move toward these targets could follow, signaling a short-term bullish correction in the broader market structure.

Gold’s Pullbacks Reveal Bearish Strength — 3960 in Sight!After gold retreated from around 4060, it encountered resistance and fell back frequently during the rebound. Although gold still maintained an overall bullish trend, the bullish momentum has obviously weakened, and the short-term gold market has entered a high-level fluctuation stage. Currently, the highest level of gold has reached around 4060. According to the current structure and rebound momentum, if gold cannot effectively break through the recent high of 4060, then gold is likely to form a secondary high point during the oscillation process and form an M-shaped double top structure with the recent high point.
Therefore, although gold is in an overall bullish trend, we still cannot ignore the considerable risk of a pullback in the short term before it effectively breaks through the high of 4060. At present, gold is testing the 4000 mark under the pressure of technical patterns. If the 4000 mark cannot withstand the test, gold may continue to retreat to the area around 3960.
Therefore, in short-term trading, we can still consider waiting for gold to rebound to the 4030-4040 area and try to short gold, first aiming at the retracement target area: 3990-3980; followed by 3960-3950!

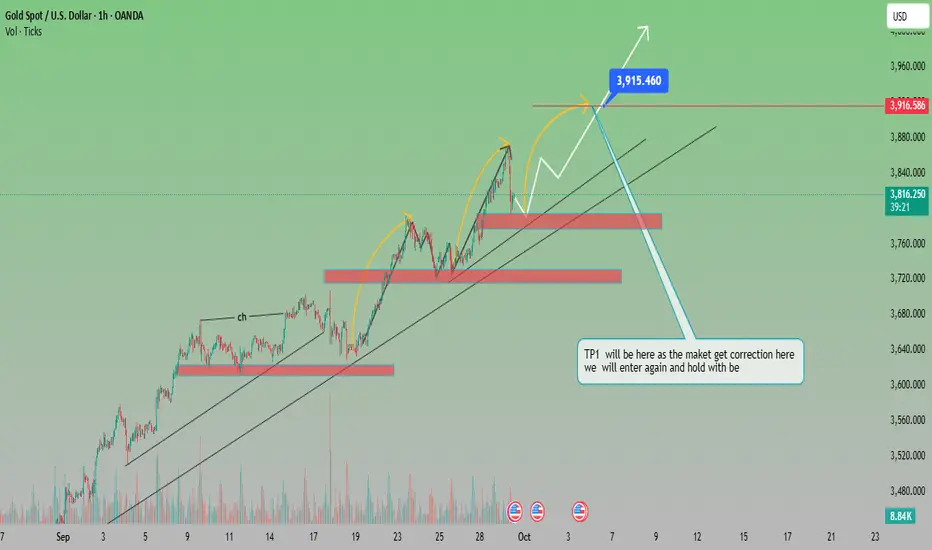
“Gold Price Action: Bullish Momentum with Key Correction Zones
Analysis of XAU/USD (Gold Spot)
The chart shows a clear uptrend channel, supported by higher highs and higher lows.
Price recently pulled back after testing the $3,915 zone, which is acting as a short-term resistance.
Multiple support zones are highlighted (around $3,760 and $3,700), which can provide strong buying opportunities on retracement.
The structure suggests impulse–correction–impulse movement, aligning with bullish continuation patterns.
Bullish Scenario
If price holds above the $3,760–$3,780 support, continuation towards $3,915 (previous high) is expected.
A breakout above $3,915–$3,920 will open the door for further upside, targeting $3,960–$3,980.
Bearish Scenario
If price breaks below the trendline support (~$3,760), deeper correction is possible toward $3,680–$3,640 (TP1 zone).
That zone is mentioned on the chart as a strong re-entry point for long positions.
✅ Suitable Target (Bullish):
Immediate Target: $3,915 (previous high)
Extended Target: $3,960 – $3,980
⚠️ Correction Target (Bearish Pullback):
$3,680 – $3,640 (strong buy zone for re-entry)
Bulls on Fire! The 4000 Challenge BeginsWhen summarizing the trading on Sunday, it was clearly pointed out that gold would inevitably hit 3900 or even 3930 this week. However, it was unexpected that gold had reached 3920 so early. Although it retreated slightly after reaching around 3920, according to the current structure and trend, the bull trend has not ended yet and there is still room for growth.
Since gold has once again broken through the recent high of 3895, the double top structure constructed in this horizontal area has become invalid and temporarily has no resistance effect. In fact, after the top and bottom conversion, this position area may play a supporting role to a certain extent in the future. As gold breaks through 3900, market bullish confidence may expand unprecedentedly, and the enthusiasm for buying will be pushed to another level. As the center of gravity of gold moves up, the current technical structural support has moved up to 3880-3870; and the strong support is located in the 3850-3840 area.
If gold cannot effectively fall below these two key support areas during the retracement. Gold will continue to maintain its bullish trend and continue its strong upward trend. It is even expected to continue to set new highs and reach around 3930 or even 3950. Once gold rises and breaks through 3950, the 4000 mark will follow!
So in terms of short-term trading, we can first try to start buying gold in small batches in the area around 3880-3870. After all, the entry price is relatively high, so we must control the lot of transactions and set up protection.
If you want to continue to follow and pay attention to my trading strategies and signals, be sure to follow me!

XAU/USD – Buy Setup from Support Zone Targeting 39451. Trend Direction:
Price is moving inside an ascending channel (bullish structure).
Higher highs and higher lows confirm the uptrend.
2. Support Zone:
Marked between 3820 – 3800 USD, a strong demand area where buyers previously stepped in.
3. Entry Point:
Suggested Entry: ~3821 USD
This aligns with the support retest inside the channel.
4. Stop Loss:
Around 3794 USD, just below the support zone.
This protects against false breakouts to the downside.
5. Target Point:
3945 USD (channel resistance).
This gives nearly +120 pips potential upside.
---
Risk/Reward Analysis
Risk: ~27 points (3821 → 3794).
Reward: ~124 points (3821 → 3945).
R:R Ratio: ≈ 1:4.5 → very favorable.
---
Overall Analysis
Market is bullish inside the channel.
Best trade setup: Wait for price to retest support (3820–3800) and then buy.
As long as support holds, price has high probability to reach the target zone (3945).
If support breaks, trend may weaken, and gold could move lower outside the channel.
📌 Conclusion:
This is a buy-the-dip setup with strong reward-to-risk. Patience is key → wait for confirmation bounce from support before entering.

Gold XAUUSD Weekly Analysis 28 Sept to 2 Oct 2025Gold is currently trading at a decisive level where the weekly structure is hinting at a potential shift. After a strong bullish run, price tested the 3785–3800 zone but failed to sustain, forming a double top/M pattern and rejecting strongly from this supply area. The rejection has now pushed gold back into the crucial support zone of 3725–3733, which is a make-or-break level for the next swing move. If this support holds firm and we get a strong H4 close above it, buyers could regain momentum, opening the door for a bullish continuation towards 3780–3800, where the previous rejection zone lies. This would keep the broader bullish structure intact. On the flip side, if the market fails to hold this level and breaks below 3725 decisively, we can expect further downside towards the next demand zone at 3650–3660, which served as an earlier accumulation area. Overall, swing traders should treat 3725/33 as the key inflection point: above it, gold looks poised to retest the highs, while a breakdown could trigger a deeper correction into lower support levels.

Gold Record Highs Under the Lens of ATAI VPA & VPRCGold Analysis Report
In recent days, as gold has reached new historical highs, two analytical tools have been used to assess the market conditions:
- ATAI Volume analysis with price action V 1.03
- ATAI Volume Pressure Analyzer (VPA)
It is important to emphasize that the gold market is heavily influenced by global economic and political events, and precise volume data is not publicly available. The only volume data considered here comes from OANDA. For this evaluation, a 70-day period has been chosen to study the broader behavioral and volume pattern of gold over the past two months.
Bull Trap Risk Detection (ATAI Volume analysis with price action V 1.03)
In this indicator, Bull Trap detection is based on the interaction of price behavior and order-flow volume. The logic is as follows:
1. Bull Sweep (False Breakout with Long Wick)
- If price exceeds the recent high (`high_level`) but closes back below it, and the upper wick of the candle makes up a sufficiently large fraction of the total range, then a Bull Sweep is detected.
- Formula:
upper_wick_ratio = (high - max(open, close)) / (high - low)
Condition: upper_wick_ratio >= trap_wick_threshold (e.g., 0.6)
2. Bull Break
- If the close is above the breakout level without a long wick, it is treated as a Bull Break.
3. Mismatch Condition
- If the candle is bullish (close > open) but delta ≤ 0 or seller ratio > 50%, then there is a mismatch between price action and order flow.
- Formula (simplified):
mismatchBull = (close > open) and (delta <= 0 or seller_ratio > 0.5)
4. Dominance Inversion
- If buyer volume ranks highest in the lookback window, but cumulative seller volume is greater than buyer volume while the candle is bullish, a dominance inversion occurs.
- Condition:
domInvBull = (rank_buy == 1) and (sum_sell > sum_buy) and (close > open)
5. Low Volume Breakout
- If a bullish breakout occurs with total volume less than the average total volume, then the breakout is flagged as low-volume.
- Condition:
lowVolBull = isBullBreak and (TF_tot < avg_tot)
The module assigns scores to these conditions:
- Sweep: +2
- Break: +1
- Mismatch: +2
- Dominance Inversion: +2
- Low-volume Break: +1
If total score ≥ trap_score_risk (default = 3), then a Bull Trap Risk is flagged. If, within `trap_confirm_bars`, price reverses and closes back below the breakout level, then Bull Trap Risk Confirmed is displayed.
Complementary View (ATAI Volume Pressure Analyzer – VPA)
The VPA indicator, with its left (C→B) and right (B→A) wings and offset capability, allows a parallel evaluation of flow balance. In the current gold chart, the right wing (B→A) reflects weakness on the buyers' side, reinforcing the Bull Trap risk detected by the previous indicator. This alignment strengthens the probability of a bearish scenario.
However, the extent of any downward path will depend on the pivotal price levels where the largest buy and sell volumes were registered over the past 70 days. These are represented by points B1 and S1, clustered around the 3409 USD level.
Notes
- On lower timeframes, accuracy in buy/sell volume calculation depends on the data window. Here, a 1-minute timeframe was selected, which provides ~74 days of buy/sell flow data.
- Gold remains highly sensitive to political and economic news globally.
- This analysis is based solely on mathematical calculations and volume/behavioral pattern recognition. It must not be interpreted as investment advice of any kind.
