Gold XAUUSD Intraday Setup 23 Sept 2025Gold has shown strong bullish momentum, breaking above multiple resistance zones and forming a clean rally on the 15-minute chart. After this impulsive move, price is currently retracing, and a key support area lies around 3757–3759, which was previously resistance and may now act as support. A potential long setup forms if price taps into this level, offering a buying opportunity with a target at 3800, aligning with the next psychological resistance, while maintaining a protective stop loss around 3747. This setup reflects a classic resistance-turned-support trade with favorable risk-to-reward.
Xauusdprediction

Gold XAUUSD Intraday Setup 22.09.2025Gold has recently broken its all-time high and is currently trading at 3711, signaling continued bullish momentum in the market. However, after such a strong breakout, a short-term retracement is likely as price action tends to revisit previous consolidation zones to gather liquidity. I'm now watching the 3693–3696 area closely—a key level where gold previously consolidated before the breakout. This zone is expected to act as a liquidity pocket, where the market may dip briefly to shake out early long positions and trap impatient sellers before resuming its upward trajectory. This kind of move is typical in strong trending markets, where price pulls back to retest former resistance turned support and collect orders before the next leg higher. My plan is to go long in the 3693–96 range, with a tight stop-loss placed at 3685, just below the liquidity sweep zone, minimizing downside risk. The target for this trade is 3725, anticipating that momentum will carry gold to fresh highs once the pullback completes and institutional buying steps back in.

XAU/USD Bullish Channel Breakout Setup – Buy from Support 3685, Chart Analysis
Trend & Structure
Price is moving inside an ascending channel (highlighted in red and blue trendlines).
Currently, the market is near the upper boundary of the channel, showing bullish momentum.
A support level is marked around 3685–3690, where the price has previously respected.
Trade Setup (Long Position)
Entry Point: 3685.79
Stop Loss: 3671.88 (below support, giving space in case of a false breakout).
Target Point: 3745.80
Risk-to-Reward Ratio (RRR)
Risk: ~14 points (3685 → 3671).
Reward: ~60 points (3685 → 3745).
RRR ≈ 1:4.3, which is very favorable.
Expected Price Action
Chart shows a possible retest of support (3685) before bouncing upward.
If the support holds, price is expected to rally toward 3745 resistance/target zone.
If the support breaks, SL will protect from further downside.
📊 Summary
Bias: Bullish continuation.
Reason: Price respecting ascending channel + strong support level + bullish structure.
Setup: Buy near 3685 with SL at 3671 and TP at 3745 (RRR > 1:4).
⚠️ Note: If price closes strongly below 3680 (support), this setup becomes invalid.

Gold Lures Bulls In — But Correction LoomsAfter the start of the Asian session, gold continued its upward momentum to around 3692. However, it is obvious that after touching this horizontal area, the upward momentum of gold has converged, and there are obvious signs of stagflation. Moreover, judging from the trading volume, the current trading volume is not enough to support the continued rise of gold. So I think gold may usher in a good wave of pullback at any time after the rise.
From a technical perspective, gold has formed a "double-needle bottoming" structure in combination with the areas near 3628 and 3632. However, since the correction near 3707, gold has shown a clear downward trend. Therefore, according to time and space, under normal circumstances, gold is still in an oscillating structure and may find it difficult to break through the resistance of the 3675-3680 area in a short period of time. But the fact is that on Friday, stimulated by the news, gold not only broke the volatile pattern that should have appeared, but also broke through the resistance of 3675-3680 in one fell swoop; when the time and space are not yet in place, the intention of gold's sharp rise may be to eliminate the short chips that have been recently arranged before gold really starts to pull back, and there is also suspicion of luring the bulls who follow the trend.
Based on space calculations, it is expected that the maximum rise in gold this time will not exceed the 3710-3715 area, and it may even start to pull back again before reaching this area. Therefore, we should not be excessively bullish on gold at this point. On the contrary, we can still short gold in batches above 3680, and the retracement target will first target the 3665-3655-3645 area.

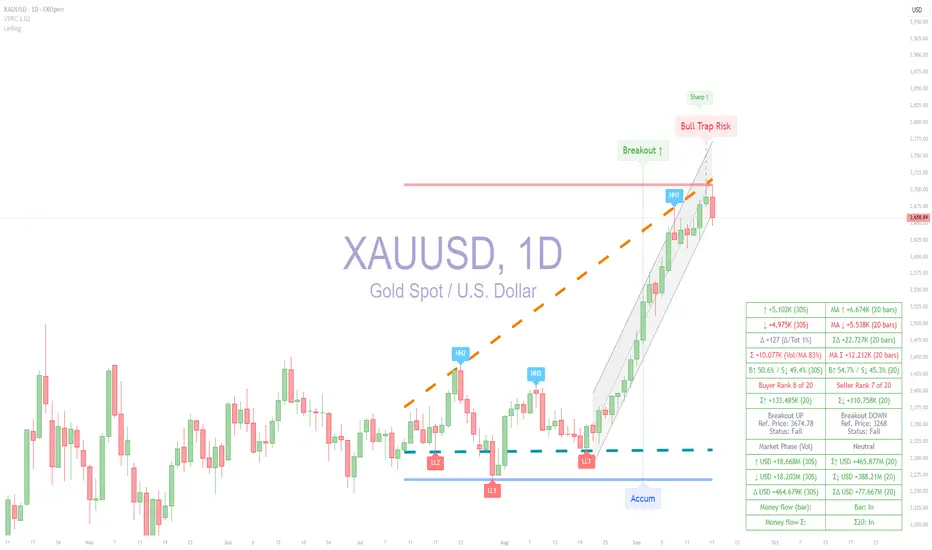
Gold Analysis using ATAI Volume Pressure AnalyzerIntroduction:
In this analysis, we use the ATAI Volume Pressure Analyzer indicator , which is based on the logic of separating buy/sell volume. The indicator retrieves volume data from a lower timeframe and reconstructs it on the host timeframe. This is achieved using the internal function, TradingView/ta/10 → tvta.requestUpAndDownVolume(lowerTF) , which extracts Up Volume, Down Volume, and Delta from the selected lower timeframe, enabling aggregation and evaluation of market pressure. One-tick data provides the highest precision but is limited in historical coverage; conversely, higher timeframes provide more historical depth but with relative accuracy.
In this daily chart, to calculate 20-period volume averages, the lowest timeframe that both preserved relative accuracy and provided sufficient historical data for 20 candles was 30 seconds , which was selected. This choice is reflected in the corresponding rows of the left and right columns of the HUD panel. It should be noted that in the gold market, the actual traded contract volume is not centrally available; therefore, the volume used in this method is based on tick volume (the count of price changes within each bar) . This serves as a proxy for activity and order flow intensity rather than absolute turnover. Accordingly, aggregates and deltas are interpreted on a relative basis and used to identify acceleration, volume spikes, and breakouts alongside price structure.
Trendlines and Market Direction
Beyond volume-based calculations, the indicator also visualizes directional bias through adaptive trendlines. The dotted orange and turquoise lines are drawn from successive pivot highs and lows over a 50-bar window, effectively capturing the slope of price movement. In the chart, these diagonals clearly reveal the transition: price has broken out of a mid-range accumulation zone and established a sequence of higher highs and higher lows, confirming a structural uptrend.
Complementing this, the blue horizontal line marks the base of the prior accumulation (support), while the red line highlights the resistance level at the top. The breakout above this framework, supported by bullish volume ratios shown in the HUD, validates that the market has shifted from neutrality into a sustained upward trend.
Labels and Market Conditions
The labels displayed on the chart — such as Accum, Breakout ↑, Sharp ↑, and Bull Trap Risk — are derived from explicit quantitative rules inside the indicator. These rules combine price levels, buy/sell volume deltas, and moving aggregates. Below, each label is explained with both its coding logic and its mathematical interpretation in plain language.
Accum (Accumulation)
Logic: |Δ| < ε ∧ Var(ΣV) → min
Meaning: The difference between buy and sell volume (Δ) is close to zero, and the variance of total volume ΣV is minimal over the chosen window. In simple terms, this marks a balanced market where buyers and sellers are matched, forming a neutral accumulation zone.
Breakout ↑
Logic: Pt > max(Pacc) ∧ Δ > 0 ∧ ΣV20 ↑
Meaning: The closing price Pt breaks above the maximum price of the accumulation zone (Pacc), while buy volume is greater than sell volume (Δ > 0), and the 20-bar aggregate volume ΣV20 is increasing. In simple terms, this confirms that buyers dominate and the market is breaking upward with sufficient volume support.
Sharp ↑
Logic: ΔP / Δt > θ
Meaning: The slope of price change (ΔP per unit time) exceeds a defined threshold θ. In simple terms, this indicates an accelerated move upward — a breakout with unusually strong momentum.
Bull Trap Risk
Logic: Pt < Pbreakout ∧ Δ ↓ ∧ ΣV20 ↓
Meaning: After an initial breakout, the price Pt falls back below the breakout level, while buy volume weakens (Δ decreases) and the 20-bar aggregate volume ΣV20 declines. In simple terms, this signals that the breakout has lost support and may have trapped buyers — hence the label Bull Trap Risk.
Trendlines and Guidance
The dotted trendlines are constructed from the slope of price and aligned with recent pivot highs (HH) and lows (LL). Mathematically, the slope is defined as:
m = (P_pivot2 − P_pivot1) / (t2 − t1)
where P_pivot are the price levels at successive pivots, and t are their bar indices. A positive slope (m > 0) indicates an upward trend, while m < 0 indicates a downward trend.
In this chart, the slope of the mid-band is clearly positive, and the label HH1 is printed at the breakout of the upper boundary. This confirms that the market has transitioned out of a ranging phase and into a structural uptrend characterized by higher highs and higher lows.
Horizontal Lines
The horizontal guidance lines (support and resistance) are calculated from the extremes over the last N = 50 bars:
S = min(P_t), R = max(P_t) for t ∈
The blue line marks support at the lowest low, and the red line marks resistance at the highest high. Together, these dynamic references highlight where order flow has historically concentrated and provide anchors for interpreting future price reactions.
Each of these labels therefore reflects a mathematical condition expressed both in code and in statistical terms. Together they describe a sequence of phases: balanced accumulation, directional breakout, acceleration, and potential failure traps. This structured approach translates raw volume and price data into actionable signals.
Conclusion: XAUUSD Market Outlook
The recent chart action combines signals from the ATAI Volume Pressure Analyzer with a secondary tool, the 20-period Linear Regression channel. This multi-tool perspective highlights the importance of cross-validation in market analysis.
Key Observations
- Volume Pressure Analyzer Signals: After a strong breakout and sharp upward momentum, the indicator has now triggered the label Bull Trap Risk . This label reflects weakening buy-side dominance, declining delta values, and a potential failure of the breakout to sustain order-flow support.
- Linear Regression (20-period): The regression channel illustrates a clear ascending path starting from the former accumulation zone. The latest red candle has closed outside the channel to the downside, confirming a loss of alignment with the prior uptrend.
- Structural Divergence: The combination of volume weakness (as flagged by VPRC) and structural channel break creates a divergence. Price remains elevated but lacks the necessary buy-side reinforcement, raising the probability of a correction or a full trend reversal.
Interpretation
This scenario indicates a transition risk: from a sharp bullish phase into either a corrective pullback or a potential distribution phase. The decisive factor remains the behavior of buyers and sellers in the next candles — whether buyers can reclaim the channel or sellers consolidate control.
Disclaimer
This XAUUSD analysis has been conducted using the ATAI Volume Pressure Analyzer indicator in conjunction with the supporting Linear Regression (20-period) tool. It does not constitute any form of financial advice regarding buying, selling, or holding positions. The analysis solely illustrates the dynamics of buyer and seller behavior in the market.
Gold Not Bottomed Yet:Selling Rallies Remains Key After a deep V-shaped rebound to near 3673, gold fell sharply again, hitting a new low near 3627. Clearly, after the rate cut, most investors took profits, driving gold prices down. As gold's center of gravity shifts downward, the current short-term resistance area has shifted to 3660-3670.
From the current structural perspective, gold is shifting from strength to weakness, with bears gradually recovering and taking control. Following the sharp rally, there is also a need for a technical pullback. While gold has rebounded slightly, there are no clear bottoming signals. I believe gold has not yet reached a low and is likely to continue to test the 3625-3615 area. If this area is broken, it will open up further downside potential, potentially extending the downward trend to around 3580.

Bull Fever Cools:The Market Still Owes Us a WaterfallAs I expected, the Fed cut interest rates by 25 basis points, and Powell did not show a clear dovish tone in his speech. Gold fell from 3707 to around 3646, with a drop of $610. Our short positions at 3685 and 3700 that we had ambushed overnight won as expected, and we successfully locked in a profit of 750 pips in the news market.
Although the Federal Reserve is inclined to take a hawkish approach to rate cuts, gold has rebounded from around 3646. Although it has performed relatively weakly, the downward momentum has slowed down and a unilateral downward trend has not formed. Overall, it is still in the high-level fluctuation range. So we can't rush to short gold at the moment. Because gold still has the possibility of rebounding back to the 3675-3685 area, and may even be expected to rebound back to the 3690-3700 area. After all, gold did not effectively fall below 3650 during the decline.
Although the decline in gold prices did not change the overall structure, it weakened the market's enthusiastic bullish sentiment in the short term, and the technical resistance also moved down to the 3675-3685 area, followed by the 3695-3705 resistance area. If gold rebounds to the resistance area, we can try to short gold, and the short-term retracement target is set in the 3655-3645 area. Once gold falls below this area, it is expected to continue the downward trend to the 3635-3625 area. Of course, it is not ruled out that gold will fluctuate widely in the 3690-3650 area.
Therefore, we can still make very good profits from the perspective of profit margin by shorting gold at the resistance areas of 3675-3685 .

Fed Catalyst: The Bear AwakensGold rebounded after touching 3660 and is currently fluctuating in a narrow range around 3685. Gold is currently trading relatively cautiously, apparently waiting for the Federal Reserve's interest rate decision to indicate its short-term direction.
How to formulate a trading plan for the Federal Reserve interest rate decision market? In fact, in the short term, I think there will not be much room for gold to continue to rise, and the short-term peak may be in the 3705-3715 area; in addition, regarding the expectation of interest rate cuts, I think the Federal Reserve will adopt a step-by-step approach to announce a 25 basis point interest rate cut, and as for Powell’s attitude, I think it may rely more on the feedback from US employment data and inflation data to decide whether to continue to cut interest rates within the year. The attitude may not be obviously dovish, so I think there is limited room for short-term increases.
Since I think the short-term peak of gold is in the 3705-3715 area, and the short-term resistance area is around 3690. Therefore, I will definitely ambush and short gold before the news is announced. Of course, the transaction needs to be set up in combination with the risk resistance ability of my account.
At present, I tend to divide the upper space into two areas, namely 3685-3695 and 3705-3715. I will mainly short gold in batches around these two areas. Once gold falls as expected, I think it will first test the intraday low around 3660. Once it falls below this area, I think gold is likely to continue to test the area around 3635-3625.
As for whether gold can take advantage of this opportunity to test the area around 3600. I believe I will overcome my greed and will not take risks to gamble for gains beyond my cognition. I will need to make a secondary judgment based on market fluctuations at that time.In any case, I would favor a short gold setup, so let’s hope for a bearish recovery!

Gold XAUUSD Intraday Setup 17 SeptI am looking for a bullish setup on Gold ahead of FOMC, with my buy zone placed at 3669–3671, which aligns with previous support and a liquidity grab area. My stop-loss is set just below the recent swing low at 3658, keeping risk contained. If data comes in favor, I expect price to rally toward the 3703+ zone, with potential extension toward all-time highs as momentum builds. The setup offers a strong risk-to-reward profile, and given the rejection from lower levels, I’ll be watching closely for fundamentals to confirm continuation to the upside.

Gold Facing Strong Resistance – Bearish Move Towards Support ?Analysis:
Resistance Zone: Price is struggling to break above the $3,645–$3,650 area, which has acted as a strong resistance multiple times.
Support Levels: Immediate support lies around $3,620 and $3,614, with the major support zone at $3,580.
Price Action: Repeated rejections from resistance indicate weakening bullish momentum. Sellers are gaining control near the resistance zone.
Bearish Outlook: A potential downward move is projected, with price likely to test $3,580 support if resistance continues to hold.
Risk Management: A break and close above $3,650 would invalidate the bearish scenario and could trigger a bullish continuation.
✅ Bias: Bearish below $3,650
🎯 Targets: $3,620 → $3,614 → $3,580
🛑 Invalidation: Above $3,650

Gold XAUUSD Intraday Move 15 Sept 2025Gold continues to show resilience within a bullish structure, and the current setup highlights two potential aggressive buying opportunities. The first lies between 3637–3639, while a deeper retracement toward 3630–3633 also offers an attractive entry point, with both setups well-protected by a stop loss at 3622. These zones align with key demand levels and trendline support, suggesting strong buying interest on dips. Upside targets remain at 3657 initially and extend toward the 3674 region, reflecting a continuation of the broader bullish trend. The reasoning behind this bias stems from both technical and fundamental factors — technically, the market continues to form higher lows, signaling strength, while fundamentally, expectations of potential rate cuts this week could weaken the dollar and further support gold prices. Together, these elements create a favorable environment for buyers, offering strong risk-to-reward opportunities in anticipation of continued bullish momentum.

Gold (XAU/USD) Forex SignalGold (XAU/USD) has been showing strong bullish momentum recently, but the latest Zig Zag pattern and RSI (Relative Strength Index) suggest a potential correction in the short term. Let’s analyze and provide a clear forex trading signal.
Market Overview
| Pair | Gold (XAU/USD) |
| -------------- | ------------------------------- |
| Current Price | \$3,680.7 |
| Trend | Bullish with minor pullback |
| Key Indicators | Zig Zag (5,10), RSI (14, close) |
| Volatility | High |
| Market Session | US Session |
Technical Analysis
Zig Zag Indicator: The last leg shows a peak around **\$3,679.3** followed by a small correction, signaling possible short-term weakness.
RSI (14): Currently near the **55 level**, coming down from overbought territory (>70). This indicates the bullish rally may be slowing, and sellers could test the downside.
Support Levels: \$3,650 – \$3,620
Resistance Levels: \$3,720 – \$3,750
Gold Trading Signal (September 14, 2025)
| Signal Type | Sell (Short-term) |
| ------------- | --------------------- |
| Entry Zone | \$3,680 – \$3,690 |
| Stop Loss | \$3,720 |
| Take Profit 1 | \$3,650 |
| Take Profit 2 | \$3,620 |
Analysis: Since RSI has cooled off from overbought levels and Zig Zag shows a minor top formation, a short-term selling opportunity is expected. However, the long-term trend remains bullish, so aggressive traders may wait for dips to re-enter long positions.
Alternate Scenario
If gold breaks above \$3,720, the bearish setup becomes invalid, and bulls may drive the price toward \$3,750 – \$3,800.
FAQs on Gold Forex Signals
Q1: Is gold still a good buy in September 2025?
Yes, gold remains in a long-term uptrend, but short-term pullbacks are expected.
Q2: What is the best strategy for XAU/USD now?
Swing traders can short near resistance with tight SL, while long-term investors can buy on dips.
Q3: Which indicators are most useful for gold trading?
RSI, Zig Zag, Moving Averages, and Fibonacci retracements work well with gold volatility.
Conclusion
Gold (XAU/USD) is consolidating after a strong bullish move. Short-term traders can look for sell opportunities near \$3,680 with targets at \$3,650 – \$3,620, while long-term traders should stay bullish and buy dips.

XAUUSD Gold Intraday Move 12.09.2025Intraday Analysis
The market has recently broken out of a descending trendline, showing signs of bullish momentum. After the breakout, price retraced toward previous supply turned demand zones, creating potential buying opportunities at key levels.
Key Observations:
Trendline Breakout:
The downward trendline has been broken, indicating a possible shift in momentum from bearish to bullish. Retests of the broken structure often provide high-probability entries.
Demand Zones:
Zone 1 (3630–3633): This level aligns with a prior consolidation area and trendline retest. A bounce here could trigger continuation toward higher resistance.
Zone 2 (3612–3616): This is a deeper support zone and serves as a secondary buying opportunity if the first level fails.
Targets and Risk Management:
For Zone 1, the upside target is 3657 with a protective stop below 3622.
For Zone 2, the upside target is 3640 with a stop below 3606.
Both setups provide a favorable risk-to-reward ratio.
Confirmation Requirement:
Entries should only be considered once at least two confirmations are present. Possible confirmations include:
Bullish candlestick patterns (engulfing, pin bar, or strong rejection wicks).
Break of minor intraday structure to the upside.
Volume spike or momentum divergence supporting the bullish bias.
Conclusion:
The bias remains bullish while above 3612. The first area of interest is 3630–3633 for a potential long entry toward 3657. If price dips deeper, the 3612–3616 zone provides the next opportunity for a bounce targeting 3640. Proper confirmation is essential before committing to trades, and stops should be respected to manage risk effectively.

Gold Bulls vs Bears! Who Will Win the $XAUUSD Battle?🏆 "The Golden Layer Cake Strategy" - XAU/USD Bullish Swing Plan 🎯
✨ Calling all savvy traders! ✨
Ready to layer into a potential Gold breakout? This systematic approach is designed to capitalize on bullish momentum while managing risk through strategic entry layers.
Here’s the detailed blueprint: 📜
🔑 Key Details:
Asset: XAU/USD (Gold)
Bias: Bullish
Style: Swing Trading / Position Building
Strategy: Multi-Layer Limit Order Entry
⚡ Entry Strategy (The Layering Method):
To optimize your average entry price, consider using multiple BUY LIMIT orders at key support levels:
Layer 1: 3420.00
Layer 2: 3440.00
Layer 3: 3460.00
Layer 4: 3480.00
You can adjust the number of layers and prices based on your personal risk management and market conditions.
🛑 Stop Loss:
A conservative stop loss can be placed below a significant support zone at 3370.00.
Disclaimer: Always adjust your stop loss based on your individual risk tolerance, account size, and trading strategy.
🎯 Take Profit:
We are targeting a strong resistance zone around 3600.00. A more ambitious target sits at 3650.00 for those who wish to trail their stops. Secure profits on the way up!
📊 Market Context & Rationale:
This plan is based on identifying potential value areas on the pullback for a continued bullish move. The layered entry allows us to build a position gracefully without chasing the market.
📊 XAU/USD Real-Time Data Report
🤝 Retail & Institutional Sentiment
Retail Traders
Long (Bullish): 28% 😊
Short (Bearish): 72% 😟
Institutional Traders
Bullish positions increasing, showing confidence in gold as a safe-haven asset. 🏦
😨💸 Fear & Greed Index
Mood: Neutral → leaning Greedy
Markets expect Fed rate cuts, boosting gold demand.
🌍 Fundamental Score
Rating: 7/10 (Positive)
Key Drivers:
Weakening US Dollar from expected Fed cuts 📉
Geopolitical tensions supporting safe-haven demand ⚠️
Ongoing central bank gold buying 🏦
📈 Macro Score
Rating: 6.5/10 (Moderately Bullish)
Factors:
High probability of US rate cut in September (~85%) 📅
Rising bond yields may cap gains 📈
Global economic uncertainty 🌎
🐂🐻 Overall Market Outlook
Bias: Bullish (Long) 🚀
Gold remains in a strong uptrend, supported by fundamentals, macro drivers, and institutional flows.
✨ Summary
Gold is bullish 📈 with strong support from fundamentals and macro conditions. Retail traders lean bearish 😟, but institutions and sentiment favor upward momentum. Any dips are seen as buying opportunities 🤑
⚠️ Risk Warning & Disclaimer:
This is not financial advice. Always do your own research (DYOR).
High-impact news events can cause increased volatility—manage your risk accordingly.
Past performance is not indicative of future results.
Only risk capital you are willing to lose.

Gold Price Analysis (XAU/USD): Key Levels and Market OutlookThe price of Gold (XAU/USD) has shown strong upward momentum in recent sessions, crossing above the $3,600 mark and briefly touching the $3,674 level, which represents a strong bullish push supported by significant trading volume (over 581K at that peak).
Current Market Overview
Current Price: $3,646.74 (as of the latest 4H candle)
Resistance Level: $3,674 (recent swing high)
Support Level: $3,640 (recent pullback low)
RSI Indicator: Around mid-range (60), showing neither overbought nor oversold conditions.
The Zig Zag indicator highlights the recent correction after reaching $3,674, where the price retraced slightly to $3,640 before consolidating. The market now trades sideways between these two levels, indicating a short-term indecision.
1. Resistance Zone:
Gold needs to break and sustain above $3,674 to confirm the continuation of the bullish trend. If this happens, the next target could be around $3,700 – $3,750.
2. Support Zone:
On the downside, if the price fails to hold the $3,640 level, a deeper correction towards $3,600 – $3,550 cannot be ruled out.
3. Momentum Indicators:
The RSI is currently neutral, suggesting room for both upside and downside moves. Traders should watch for RSI crossing above 70 (bullish continuation) or dropping below 50 (bearish pressure).
Trading Strategy
Bullish Bias: If Gold holds above $3,640 and breaks $3,674, traders may look for long positions targeting $3,700 and above.
Bearish Bias: A break below $3,640 could trigger short positions, with downside targets near $3,600 and $3,550.
Conclusion
Gold remains in a bullish structure but faces short-term resistance at $3,674. Traders should watch closely for a breakout or breakdown from this consolidation range to determine the next major move.

GOLD: Bulls Continue To Bully Their Way ThroughI'm looking for a dip to buy...
(H4)
Gold has extended higher and is now trading firmly inside the 3630–3645 area.
Structure remains bullish, but price is reaching into premium levels so we could get a pull back.
Buyside liquidity sits around 3650
(H1)
A strong push from 3585 to 3634 left some imbalance behind:
3610–3618 FVG (fresh demand)
3588–3595 (deeper OB if price pulls back more aggressively)
(M15)
Bullish but candles at 3634 are showing some exhaustion.
Liquidity has been swept at 3630–3635, so we may see a correction to fill imbalances before continuation.
As long as price holds above 3610, bulls are still in control.

Gold’s Power Play: Bubble or Break?After gold touched around 3659 during the day, it retreated to our primary target area as expected: 3640-3630 area. In this short transaction, we actually made a profit of 200pips, which is a relatively good trade.
There is no doubt that gold is still in a unilateral upward trend and may continue to around 3670 in the short term, but at the current stage, I would rather wait and see on the sidelines than rush to chase the rise in gold, because I really don’t want to be hanging on a tree and swinging.
What is unstoppable is that I will still try to short gold by touching the top in the high area along the current trend line. Judging from the recent fluctuations, since I don’t have the courage to chase the rise of gold, in order to participate in market transactions, I will try to short gold based on the principle of touching the high point of the trend line. It is not too difficult to earn a profit margin of 100-200 pips in short trading. According to the current trend line constructed, the current upward extension space is around 3670, while the intraday high is around 3660.
Therefore, in short-term trading, we can still continue to try to short gold by using the short-term high point area of 3660-3670 as resistance. The primary short-term target is still the 3640-3630 area. Once gold falls below this area, the target area will be moved to the 3610-3600 area.

XAU/USD Bullish Trade Setup Buy from POI Zone towards 3668TargetXAU/USD (Gold) – 1H Analysis
✅ Trend: The market is in a clear bullish trend with higher highs & higher lows. Price is trading above both EMA 70 (3,547) and EMA 200 (3,486), confirming strong upward momentum.
📌 Key Levels:
POI Buying Zone: 3,554 – 3,576 (strong support area)
Target Point: 3,668 – 3,669
Support Line: Still respected, adding confluence to the bullish setup.
📈 Strategies Applied:
Trend Following: Bullish as long as price stays above EMAs.
Support & Resistance: Buying zone aligns with strong support.
EMA Strategy: Price above EMAs = buy signal.
Price Action: Retest of POI zone before moving up.mm
🎯 Trade Idea:
Entry: Around 3,555 – 3,576 (buying zone)
Stop Loss: Below 3,547 (EMA 70 / zone invalidation)
Target: 3,668 – 3,670
⚡ Summary: Market remains bullish, correction into the POI zone is a good buying opportunity aiming for new highs.

XAU/USD Bullish Setup – OB Zone to $3,590 TargetChart Overview (XAU/USD – 30m):
Current price: $3,534
Price is in a strong bullish channel (higher highs & higher lows).
Market forming an ATH (All-Time High) and consolidating.
📌 Strategies Applied:
1. Trendline Strategy:
Price respecting support & rejection lines inside ascending channel.
Trend remains bullish as long as price holds above support.
2. Order Block (OB) Zone:
Identified buying zone at $3,501 – $3,514.
Strong support + liquidity area → possible rebound point.
3. Moving Averages (EMA):
EMA 70 (3,508) and EMA 200 (3,464) both acting as dynamic support.
EMA alignment confirms bullish momentum.
4. Risk–Reward Setup:
Entry near OB Zone: $3,501 – $3,514
Stop-loss: below $3,500
Target: $3,590 (R:R ~ 1:3).
✅ Summary:
Gold is in a strong bullish trend 🚀. The OB Buying Zone aligns with EMA support, offering a low-risk long entry. As long as $3,500 holds, price likely pushes towards the target zone $3,589 – $3,590.

Gold Price Analysis (XAUUSD 4H): Bulls Eye $3,600 but ResistanceGold has continued its impressive rally, pushing higher on the 4-hour timeframe and reaching the $3,587 zone. With momentum on the bulls’ side, the big question remains: Can XAUUSD break above the $3,600 resistance, or is a pullback on the horizon?
The 4-hour chart shows a clear uptrend, with price action forming higher highs and higher lows. The recent surge took gold from the $3,250 level all the way to nearly $3,600, a gain of more than $300 within weeks.
This bullish momentum is supported by strong buying volume, indicating that traders continue to see gold as a safe-haven asset in the current global environment.
Key Technical Levels
Resistance Zone: $3,600 – $3,620
Support Zone: $3,500 – $3,520
Next Upside Target: $3,700 and $3,750 if resistance breaks
Potential Downside Target: $3,520 if price fails to sustain above $3,550
RSI Indicator
The Relative Strength Index (RSI) is trading near the 70 level, signaling that gold is approaching the overbought territory. While this confirms strong bullish momentum, it also raises the likelihood of a short-term correction or consolidation before the next big move.
Market Sentiment
Currently, gold is at a critical juncture. Buyers are attempting to break the $3,600 barrier, but selling pressure has been visible with upper candle wicks forming near this level.
A decisive breakout above $3,600 could open the path toward $3,700+.
A rejection from resistance may trigger a pullback toward $3,520–$3,500 support.
Trading Outlook
For swing traders, the strategy remains straightforward:
Bullish Bias: Stay long as long as price holds above $3,500. Watch for confirmation above $3,600 to target $3,700 – $3,750.
Bearish Bias: Short-term traders may look for pullback opportunities if price fails to hold above $3,550, aiming for $3,520 support.
Conclusion
Gold (XAUUSD) remains firmly in a bullish trend, but immediate resistance near $3,600 could determine the next move. Traders should closely monitor price action around this key level—either a breakout to new highs or a pullback to reset momentum.
✨ Gold’s next move could set the tone for September trading. Stay alert and manage risk carefully.

Gold/XAUUSD Intrday Move 04.09.2025Gold is currently trading near 3539, after retracing into yesterday’s demand zone at 3526–3531. This zone has shown strong reactions previously and continues to hold as a key level for buyers.
🔑 Key Reasoning
Demand Zone: Price is retesting 3526–3531, a strong support area where buyers previously stepped in.
Bullish Continuation Bias: The broader structure remains bullish, and as long as this zone holds, the outlook favors continuation to the upside.
Confirmation Level: A decisive close above 3542 would confirm bullish momentum and open the way for further upside.
Invalidation: A break below 3511 (recent low) would invalidate the bullish setup and shift bias to neutral/short-term bearish.
🎯 Trade Plan
Entry: Buy from 3526–3531 demand zone.
Confirmation: Add positions if price closes clearly above 3542.
Stop-Loss: Below 3511 (recent low).
Targets:
First target: 3578 (recent swing high).
👉 Summary: Bias stays bullish above 3526–31 demand zone. A clean break above 3542 strengthens the case for continuation toward 3578, with invalidation below 3511.

Gold XAUUSD Intraday Move 3.9.2025🔹 Bias: Bullish Continuation After Liquidity Sweep
Gold remains in a bullish structure overall, consolidating around 3538 after failing to clear 3547, which suggests liquidity engineering beneath current levels before continuation higher.
🔹 Key Demand Zone (3526–3531)
This zone marks prior accumulation and the origin of the last bullish impulse. A controlled dip into this area would allow liquidity sweep and re-entry of buyers, making it the critical zone to watch.
🔹 Liquidity Above 3547
Equal highs have formed near 3547, indicating liquidity resting above this level. A breakout here, once demand is respected, can provide fuel for a strong push toward the 3567 objective.
🔹 Risk Management (3515 Invalidation)
The invalidation point sits at 3515. A sustained break below this level would indicate absorption of demand and shift bias away from buyers. Until then, risk-to-reward strongly favors longs.
🔹 Trade Plan
Entry: Scale in within 3526–3531 after confirmation of order flow shift (CHOCH or strong bullish displacement).
Stop-Loss: Below 3515.
Take Profits: Partial at 3544/3547, trail stop to breakeven above 3547, final target at 3567.
👉 This breakdown balances structure, liquidity, and execution plan—giving traders both reasoning and a clear actionable path.

XAUUSD Gold Intraday Setup 02.09.2025Gold is currently trading at 3473, after hitting new ATH around 3508, now testing into a key demand zone. Price has shown a corrective move after the recent bullish impulse and is reacting from a consolidation order block.
Key Levels:
First buy zone: 3469–3473 → aligns with immediate demand and prior accumulation.
Second buy zone (deeper retracement): 3449–3454 → lower demand zone + strong support base.
Structure & Bias:
Market structure remains bullish with higher highs and higher lows intact.
Current pullback is corrective in nature, tapping into demand zones.
Liquidity below minor lows (around 3470 and 3450) could be swept before a strong bullish continuation.
Targets:
First target: 3492 (recent high/intraday resistance).
Second target: 3508 (swing high, liquidity pool).
Trade Plan:
Look for bullish confirmation (rejection wick, engulfing, or structure shift) in the 3469–3473 zone for a buy entry.
If price breaks below decisively, next long entry should be considered from the 3449–3454 zone.
Stop-loss ideally below 3460 for the first zone, and below 3435 for the second zone.
👉 In short: Bias is bullish; buy dips into 3469–73 or 3449–54, aiming for 3492 & 3508.
