Selena | XAUUSD · 30M – Bullish Structure Inside Rising ChannelFOREXCOM:XAUUSD PEPPERSTONE:XAUUSD
After the aggressive sell-side sweep, buyers regained control and pushed price back into a structured bullish channel. The current strong consolidation under 5,100 suggests accumulation before a potential expansion move. As long as price holds above the internal demand at 4,960–4,980, upside liquidity remains the primary objective.
Key Scenarios
✅ Bullish Case 🚀
• Hold above 5060
• 🎯 Target 1: 5,120
• 🎯 Target 2: 5,180
• 🎯 Target 3: 5,240+
❌ Bearish Case 📉
• Breakdown below 4,960
Current Levels to Watch
Resistance 🔴: 5,100–5,120
Support 🟢: 4,960–4,980
⚠️ Disclaimer: This analysis is for educational purposes only. Not financial advice.
Xauusdsell

Eliana | XAUUSD · 15M – Rising Structure | Breakdown Risk PEPPERSTONE:XAUUSD OANDA:XAUUSD
After a strong recovery from the sell-side liquidity sweep, XAUUSD formed a controlled bullish leg. However, repeated rejections from the supply zone and failure to impulsively break higher suggest potential distribution. The current structure favors a corrective move if trendline support fails.
Key Scenarios
✅ Bullish Case 🚀 →
• Strong hold above 4,980 + trendline
• 🎯 Target 1: 5,070
• 🎯 Target 2: 5,120
❌ Bearish Case 📉 →
• Breakdown below 4,980 demand + trendline
• 🎯 Downside Target 1: 4,900
• 🎯 Downside Target 2: 4,800 (liquidity zone)
Current Levels to Watch
Resistance 🔴: 5,070 – 5,100
Support 🟢: 4,995 → 4,980
⚠️ Disclaimer: This analysis is for educational purposes only. Not financial advice.

XAUUSD/GOLD 4H & 1H SELL PROJECTION 11.02.26Today we are analyzing Gold (XAUUSD) on the 4-hour and 1-hour timeframe, and I’m looking for a sell limit opportunity based on a bearish continuation pattern.
Let’s break this down clearly.
On the 4H timeframe, price is forming a descending triangle structure with a clear lower high trendline. The market is respecting this downtrend line consistently, which indicates strong bearish pressure.
We also have a Resistance R1 zone around 5080–5085. This area aligns perfectly with the descending trendline and creates a confluence zone for a potential liquidity sweep.
Now here is the important part:
Before the drop, price may push slightly higher to sweep liquidity above the trendline and resistance. This is a typical smart money move — grabbing buy-side liquidity before continuing downward.
After the liquidity sweep, I’m expecting a bearish continuation move.
📉 Entry Plan:
Sell Limit near the trendline resistance zone (around 5080 area).
🛑 Stop Loss:
Above the recent swing high and above the liquidity sweep zone.
🎯 Target:
Support S1 area around 5045.
This is a strong demand/support zone where price previously reacted.
Risk-to-reward on this setup looks very attractive because we are trading:
With the higher timeframe trend
At a strong resistance
With liquidity confirmation
Inside a bearish continuation structure

Gold continues to fall - CPI newsRelated Information:!!! ( XAU / USD )
Here is a more financial-market–oriented paraphrase:
Meanwhile, the stronger-than-expected US Nonfarm Payrolls (NFP) report released on Wednesday prompted investors to dial back expectations for a Federal Reserve rate cut as early as March. As a result, the US Dollar Index (DXY), which measures the greenback against a basket of major currencies, has stabilized above a two-week low—contributing to the overnight pullback in gold prices.
That said, market participants continue to price in the likelihood of two additional Fed rate cuts in 2026. Moreover, softer-than-anticipated US Jobless Claims data released on Thursday has limited the upside in the US Dollar, preventing a more pronounced recovery.
personal opinion:!!!
Gold prices are consolidating below 4985, awaiting CPI news which is under selling pressure at the end of the week, and CPI and DXY data are recovering.
Important price zone to consider : !!!
Resistance zone point: 4985, 5040 zone
Support zone point : 4944 , 4890 zone
Follow us for the most accurate gold price trends.

Gold Trade Set Up Feb 12 2026Price is in a range and just swept London highs but making HL on the 1h and 15m. If price breaks and closes above London highs i will expect price to trade higher to PDH and 15m supply but if price closes under and makes internal 5m bearish structure i will take sells to Asia Lows

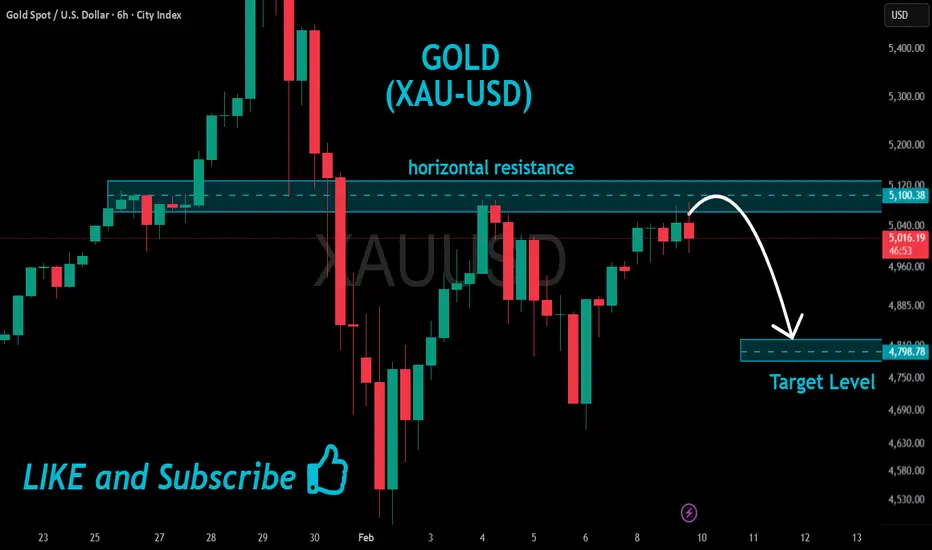
GOLD Short From Resistance!
HI,Traders !
#GOLD is once again
About to retest a horizontal
Resistance level of 5100.38
Which is a strong supply
Area from where a local
Bearish pullback is to
Be expected ! xauusd
Comment and subscribe to help us grow !
#XAU/USD Sell Trade Scenario.Here’s an up-to-date XAU/USD Sell trade outlook (technical + fundamental) to help you assess whether positioning for a Downside makes sense right now.
Thank You......

A rebound correction. Sell at the 5000 resistance level.On Thursday, gold prices experienced a dramatic rollercoaster ride after a brief surge. In early Asian trading, prices briefly rose to around 5100, with bulls showing strong momentum. The European session was relatively calm, remaining within a range.
During the US session, gold prices plummeted due to stronger-than-expected US employment data, falling sharply by $240 to a low of around $4,878 before finding support and closing near the low. The day's volatility was extreme and caught the market off guard.
As we mentioned on Thursday, a calm market often conceals a larger trend, and a breakout from the trading range could lead to a sudden shift in market direction.
Currently, the trend remains in a corrective rebound pattern, with upward movement proving difficult. The 5000 level forms a strong resistance zone, while 4880 provides short-term support. A break below this level would likely lead to even lower lows.
For short-term trading, it is recommended to short at the 5000 level, with a profit target of around 4950-4920. The strategy remains unchanged until the release of the US January CPI data; please pay attention to the trading hours.
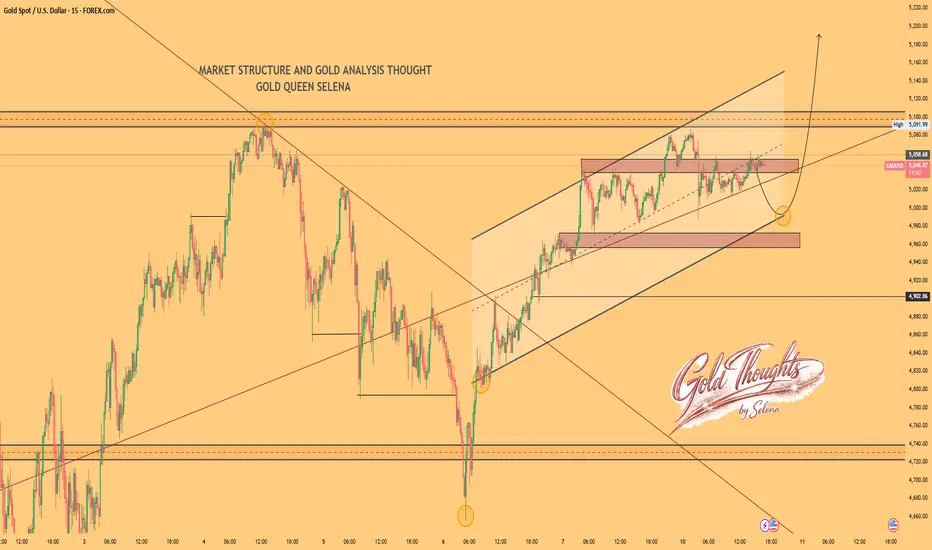
Selena | XAUUSD · 15M – Ascending Channel | Compression FOREXCOM:XAUUSD PEPPERSTONE:XAUUSD
After a strong bullish reversal from the sell-side liquidity sweep near the lower demand, XAUUSD transitioned into a controlled bullish channel. The market is now consolidating below resistance, which typically precedes either a continuation breakout or a corrective pullback toward demand before the next leg.
Key Scenarios
✅ Bullish Case 🚀 →
• Acceptance above 5,100 resistance
• 🎯 Target 1: 5,150
• 🎯 Target 2: 5,200
❌ Bearish Case 📉 →
• Rejection from resistance + channel breakdown
• 🎯 Downside Target 1: 4,980
• 🎯 Downside Target 2: 4,950
• 🎯 Downside Target 3: 4,900
Current Levels to Watch
Resistance 🔴: 5,090 – 5,120
Support 🟢: 5,000 → 4,950
⚠️ Disclaimer: This analysis is for educational purposes only. It is not financial advice.
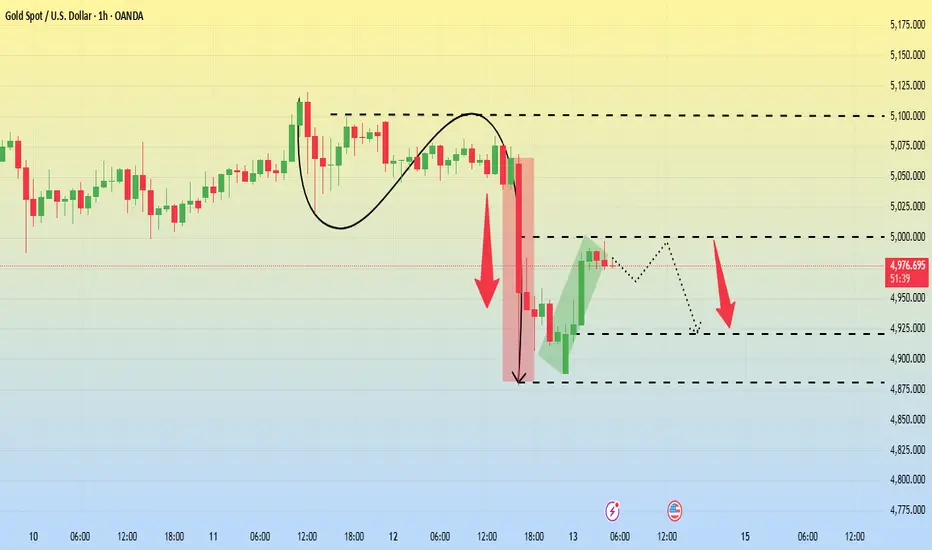
XAUUSD/GOLD 1H SELL LIMIT PROJECTION 13.02.26In today’s analysis, we are looking at XAUUSD on the 1-hour timeframe, and the market is clearly preparing for a potential downside move.
Let’s break it down step by step.
First, price previously respected the day high as resistance. That zone acted as strong supply, and we saw a massive impulsive bearish candle from that level. This confirms institutional selling pressure.
After that sharp drop, the market formed a retracement.
Now pay attention here 👇
Price has pulled back into the 0.5 – 0.618 Fibonacci retracement zone, which is a premium area for sell entries in a bearish trend.
At the same time:
• The market left a Fair Value Gap (FVG) above
• Stop-loss liquidity is resting above recent highs
• Price is retracing into imbalance
This is a classic smart money sell setup.
Now let’s confirm with indicators:
🔹 Stochastic Oscillator is above 80 – indicating overbought conditions.
🔹 RSI is below 50 on the 1H timeframe – which confirms bearish momentum overall.
So what does this mean?
Even though price is pulling back, the higher timeframe momentum remains bearish. This retracement looks like a liquidity grab before continuation.
📌 Trade Plan:
Entry Zone: Around 0.5 – 0.618 Fibonacci area
Stop Loss: Above the Fair Value Gap / recent swing high
Target: Yesterday’s low / key support zone

xauusd/gold 4h sell projection 12.02.26On the 4-hour timeframe, Gold has formed a Double Top near resistance, and we clearly saw a Liquidity Sweep above the previous high. That means smart money grabbed buy-side liquidity… and now the market is showing weakness.
Right after that, we got an Evening Star pattern — a strong bearish reversal confirmation.
🔥 What does this mean?
Buyers tried to push higher…
Liquidity was taken…
But price failed to continue up.
Now sellers are stepping in.
📍 Entry Zone
We are looking for sell positions below the resistance zone around 5085–5100 area.
📍 Stop Loss
Above the recent high near 5126.
📍 Targets
TP1 – First intraday support
TP2 – Psychological level near 5000
TP3 – Major support around 4910
If momentum increases, we can expect a strong bearish continuation towards the lower support zone.

Prepare for volatility - NFP impact gold prices below 5000Related Information:!!! ( XAU / USD )
Data released by the US Census Bureau on Tuesday showed that Retail Sales were flat in December, following a revised 0.6% increase in November and falling short of market expectations for a 0.4% gain. The softer-than-anticipated reading adds to recent indications of cooling momentum in the US labor market, prompting economists to revise down their fourth-quarter growth forecasts and reinforcing expectations of further monetary easing by the Federal Reserve.
Reflecting this shift, money markets are now pricing in approximately 58 basis points of cumulative Fed rate cuts in 2026, a reassessment that continues to exert downward pressure on the US Dollar.
personal opinion:!!!
Accumulation zone: 5000 - 5090, continued competition between buyers and sellers. Awaiting NFP news.
Important price zone to consider : !!!
Resistance zone point: 5084, 5145, 5236 zone
Support zone point : 4970 , 4902 zone
Follow us for the most accurate gold price trends.

Gold Trade Set Up Feb 11 2026Price is making LH/LL on the 4h, inverted a 15m FVG, swept PDH and broke structure to the downside on the 15m so i will expect gold to continue its downtrend towards PDL

Selena | XAUUSD – 30M | Intraday Recovery From DemandFOREXCOM:XAUUSD PEPPERSTONE:XAUUSD
After a strong bearish impulse, XAUUSD reached a major intraday demand zone and printed a sharp rejection. Price is now attempting a corrective recovery, but upside remains capped by a descending trendline and supply zone around 4,900–4,930. The move currently looks like a pullback within a broader corrective phase.
Key Scenarios
✅ Bullish Case 🚀 (Intraday)
Holding above 4,760–4,780 support
🎯 Target 1: 4,900
🎯 Target 2: 4,930–4,960 (trendline + supply zone)
❌ Bearish Case 📉 (Failure Scenario)
Breakdown below 4,760
🎯 Downside target: 4,640–4,600 demand zone retest
Current Levels to Watch
Resistance 🔴: 4,900 – 4,960
Support 🟢: 4,760 → 4,640
⚠️ Disclaimer: This analysis is for educational purposes only. It is not financial advice.

XAUUSD/GOLD 1H SELL PROJECTION 11.02.26In today’s analysis, we are looking at XAUUSD on the 1-hour timeframe, and the market is showing a strong potential sell setup.
First, the market has been moving sideways this week, forming a clear range structure. Price is respecting both resistance and support levels.
Now, look at the top area — we can clearly see a Double Top formation near the resistance zone. This is a strong bearish reversal pattern, especially when it forms at a key resistance level.
Not only that…
We also have an Evening Star pattern, which is another powerful bearish confirmation signal. This increases the probability of a downward move.
📌 Current Situation:
Price is reacting from Resistance R1
Rejection candles are forming
Bearish structure is building
If price respects this resistance zone and fails to break above it, we can expect a strong downward movement.
🎯 Target Levels:
First target: Support S1
Final target: Support S2
As shown in the projection, the market may drop strongly toward the lower support zone if sellers take control.

Gold Trade Set Up Feb 10 2026Price is making LH/LL on the the 1h and 15m so as long as price continue its bearish market structure i will look to take sells either after a London high sweep or 1m-5m CISD/IFVG to target Asia lows

Core Retail Sales m/m XAUUSD/GOLD FORCAST PROJECTION 10.02.26A negative reading indicates economic weakness, which puts pressure on the US Dollar and supports Gold.
Trade Plan:
Look for buy confirmation above the support zone
Expect higher highs and higher lows
Targets are placed near Resistance R1 and Resistance R2
Risk Management:
Risk–Reward Ratio: 1:4
Stop-loss below the support zone
Partial profit booking is advised near the first resistance
🔴 Scenario 2: If Core Retail Sales is POSITIVE – SELL GOLD
A positive reading strengthens the US Dollar, creating downside pressure on Gold.
Trade Plan:
Look for sell confirmation near resistance
Expect lower highs and strong bearish momentum
Targets are placed below Support S1, towards the lower demand zone
Risk Management:
Risk–Reward Ratio: 1:3
Stop-loss above resistance
Trail stop-loss after the first impulse move

Gold is at a very crucial point (Gold market cap vs US debt)
Is the market crash starting?
What are the parameters that you look for?
a- RSI (3M) = 92 ----> Overbought (the outlook is bearish)
b- Gold market cap vs US debt --- > a top is in place (Bearish)
Date: 10 Feb 2026
Price: $ 5050
Target-1: $ 4271
Target-2: $ 3455
Short Term (Elliott Waves)

Eliana | XAUUSD – 15M – Intraday Market StructureOANDA:XAUUSD PEPPERSTONE:XAUUSD
After the sharp sell-off, XAUUSD formed a solid base near the 4600 liquidity zone, followed by a structured recovery. Price pushed into supply and got rejected, pulling back toward demand while still holding higher lows. As long as the demand zone holds, upside continuation toward higher resistance remains valid. A breakdown below demand would expose deeper liquidity before any continuation.
Key Scenarios
✅ Bullish Case 🚀 →
Holding above 4800–4850 keeps buyers in control.
🎯 Target 1: 5050
🎯 Target 2: 5140
🎯 Target 3: 5200+
❌ Bearish Case 📉 →
Failure to hold 4800 opens sell-side liquidity.
🎯 Downside Target 1: 4600
🎯 Downside Target 2: 4400
Current Levels to Watch
Resistance 🔴: 5050 – 5140
Support 🟢: 4850 – 4800 / 4600
⚠️ Disclaimer: This analysis is for educational purposes only. Not financial advice.

Selena | XAUUSD – 30M – Intraday Bullish CorrectionFOREXCOM:XAUUSD PEPPERSTONE:XAUUSD
After the aggressive sell-off, XAUUSD found strong demand near the 4720–4750 zone, triggering a corrective bullish structure. Price is respecting the ascending channel, printing higher lows, but remains below the higher-timeframe descending trendline. A clean hold above intraday support could push price toward the next resistance, while rejection from the trendline may lead to another pullback.
Key Scenarios
✅ Bullish Case 🚀 →
If price holds above 4950–4970, bullish continuation is expected.
🎯 Target 1: 5050 – 5070
🎯 Target 2: 5150 – 5180 (Major Resistance Zone)
❌ Bearish Case 📉 →
Failure below 4950 would invalidate the bullish correction.
🎯 Downside Target: 4850 → 4750
Current Levels to Watch
Resistance 🔴: 5050 / 5150 – 5180
Support 🟢: 4950 / 4750
⚠️ Disclaimer: This analysis is for educational purposes only. Not financial advice.

XAUUSD/GOLD ASCENDING TRIANGLE BUY PROJECTION 09.02.26In this chart, we can clearly see an Ascending Triangle formation.
Price is making higher lows, while the resistance level on top remains flat.
This shows that buyers are getting stronger and pushing the market upward step by step.
Each time price pulls back, it respects the ascending trendline, confirming bullish pressure.
At the same time, sellers are unable to break below this support.
Once price breaks and closes above the resistance, it confirms a bullish breakout.
This is where we look for buy entries.
Entry: After the breakout or a small pullback to the trendline
Stop Loss: Below the ascending trendline
Take Profit: Measured move toward the next resistance zone
This pattern usually acts as a bullish continuation, especially when it forms after a strong move.
Risk management is key — never risk more than a small percentage per trade.
Follow the structure, wait for confirmation, and trade with discipline. 📈🔥

XAUUSD/GOLD 1H BUY PROJECTION 09.02.26This is Gold on the 1-hour timeframe.
First, we can see a clear rounding bottom pattern, which shows that selling pressure is weakening and buyers are slowly entering the market.
After this, price broke a key resistance level and then came back to retest the same area.
This retest was successful, confirming that resistance has now turned into strong support.
Price is currently moving inside an ascending channel, which indicates a healthy bullish trend with higher highs and higher lows.
Near the support zone, we can also see a liquidity sweep, where the market briefly moved down to trap sellers before pushing higher.
The price is now holding above the support area, and as long as this level is respected, the buy bias remains valid.
The upside target is placed near Resistance R1, as marked on the chart.
The green zone shows the profit target, and the red zone represents the risk or invalidation area.
Overall, the market structure is bullish, and buy setups are favored.
Always trade with proper risk management and never risk more than a small percentage of your capital.

The best sell you can make in GOLD before the end of the weekAfter careful observation of the gold chart, I see a strong decline from the area shown in the image, where there is strong resistance from which gold is reversing.
