Gold Price Outlook – Trade Setup (XAU/USD)📊 Technical Structure
OANDA:XAUUSD Gold extended losses, trading near $4,060–$4,070 after its biggest one-day drop in five years.
Immediate support zone is around $4,060–$4,070, while the resistance zone lies at $4,132–$4,141.
The current chart suggests a potential rebound scenario from support, with upside capped at resistance.
Failure to hold $4,060 could expose the next leg lower toward $4,020–$4,000.
📌 Trade Setup
Entry (Long): $4,070 (near support zone)
Stop Loss: $4,053 (below support)
Take Profit: $4,132 (resistance zone retest)
Risk-to-Reward (R:R): ≈ 1 : 4.26
🌍 Macro Background
Gold remains under heavy pressure after two days of sharp selloff, even as the US Dollar Index (DXY) weakened slightly near 98.80. The move reflects profit-taking following gold’s record rally, while traders are cautious ahead of Friday’s US CPI data (Core CPI expected at 3.1% YoY).
At the same time, Reuters reported that the White House is weighing new export curbs on China’s tech sector, intensifying trade uncertainty. Despite near-term weakness, gold is still up 54% YTD, supported by market bets that the Fed will cut rates by 50 bps at its final two policy meetings this year, with additional easing priced in for 2026.
Thus, while short-term volatility may persist, macro drivers still favor dip-buying strategies.
🔑 Key Technical Levels
Resistance: $4,132 / $4,141
Support: $4,060 / $4,070
Upside Target: $4,132
Downside Risk: $4,020 / $4,000
📋 Trade Summary
Gold is consolidating near $4,060–$4,070 support, with technicals hinting at a short-term rebound opportunity toward $4,132 resistance. However, the broader tone remains cautious ahead of the US CPI release and potential new US-China tech trade restrictions.
⚠️ Disclaimer
This analysis is for reference only and does not constitute trading advice. Trading involves significant risk, and proper risk management is essential.
Xauusdsetup

GOLD Rising Support!
HI,Traders !
#GOLD is trading along
The rising support and is already
making a Local rebound so we are
Locally bullish biased and
We will be expecting a
Further bullish move up !
Comment and subscribe to help us grow !

ElDoradoFx PREMIUM – GOLD ANALYSIS (23/10/2025, ASIA SESSION)Gold (XAUUSD) closed NY around 4,098–4,102 after a constructive rebound from the 4,004–4,024 liquidity shelf. Into Asia, price is coiling just under 4,110–4,113 (intraday high / weak high on 5–15M) with rising short-term MAs beneath (4,083–4,085 cluster), while higher-timeframe EMAs remain overhead on H1/H4. Expect Asia to decide between a continuation leg toward 4,140/4,148 or a controlled pullback into the intraday fib zones before any further move.
⸻
🔍 Technical Outlook
Daily Chart (D1)
• Strong two-day correction off 4,38x followed by attempt to print a rejection tail from 4,00x; macro uptrend still intact above 20/50-DMA.
• RSI cooled to the mid-50s; room either side.
• MACD histogram shrinking but still above baseline → corrective, not trend break.
Bias: Corrective rebound inside a broader bullish trend.
⸻
1H Chart (H1)
• Clear rebound structure: swing L 4,004 → H ~4,113 then consolidation.
• Price is testing a descending trendline and sits below H1 100/200 EMA band ~4,147–4,16x (yellow/white on your chart) → overhead supply remains.
• RSI ~50 with positive slope; MACD turning up from deep negative, confirming recovery but not yet a trend flip.
Intraday Bias: Mildly bullish while 4,083–4,085 holds; watch rejections near 4,113/4,140/4,148.
⸻
15M Chart (M15)
• BOS to the upside from the 4,024–4,030 base; pullbacks bought at 4,096–4,100.
• Current range: 4,096–4,113 with overhead liquidity beacons 4,130 → 4,140.
• MACD green, RSI ~60 → momentum positive but slowing under trendline.
Short-term View: Bullish bias to resistance; pullback likely if 4,113 fails.
⸻
5M Chart (M5)
• Micro down-sloping resistance from the 4,110 peak; price holding above MA cluster 4,083–4,085 and the 5M mid-band ~4,098.
• MACD recently crossed down on 5M (loss of pace), but not yet a structural break.
• A clean 5M close >4,112 typically runs stops to 4,130+.
⸻
✨ Fibonacci Golden Zone
Last confirmed H1 impulse: Low 4,004 → High 4,113
• 38.2% = 4,071
• 50% = 4,058
• 61.8% = 4,046
✅ Golden Zone = 4,058 – 4,046 (prime buy zone)
Confluence: prior NY mid-range, lower channel support, and below the 5M/15M MA cluster (first catch at 4,083–4,071, core at 4,058–4,046).
⸻
🎯 High Probability Scenarios
Bullish Continuation Setup (Preferred if pullback forms)
✅ Buy 4,071–4,058 (scale to 4,046 if swept) on bullish rejection/engulfing.
🎯 Targets → 4,098 (fill) → 4,113 (weak high) → 4,130 → 4,140/4,148
🛑 SL: below 4,040–4,045 (outside 61.8%/structure)
Bullish Breakout Setup (Momentum)
✅ Buy on break & 5–15M retest above 4,113.
🎯 Targets → 4,130 → 4,140 → 4,148 (H1 supply/EMA band)
🛑 SL: back inside 4,103–4,105
⸻
Bearish Correction Setup (Fade resistance)
⚠️ Sell 4,140–4,148 if clear rejection (upper channel / H1 EMA band).
🎯 Targets → 4,113 → 4,098 → 4,083 → 4,071
🛑 SL: above 4,152/4,156
Bearish Breakdown (Continuation lower)
⚠️ Sell below 4,046 (clean break of 61.8% + retest).
🎯 Targets → 4,030 → 4,024 → 4,011 → 4,004
🛑 SL: back above 4,058
⸻
📅 Fundamental Outlook – Asia Session
• No major Asia data on deck; flow-driven session likely.
• Watch DXY drift after NY close; soft DXY favors the pullback-then-buy path.
• Headline risk (Fed speakers later) could cap rallies near 4,14x–4,15x ahead of EU/US hours.
⸻
⚠️ Key Levels to Watch
Resistance: 4,113 (breakout line) / 4,130 / 4,140–4,148 (H1 EMA/supply)
Support: 4,098–4,096 (intraday) / 4,085–4,083 (MA cluster) / 4,071 / 4,058–4,046 (Fib Golden Zone) / 4,024–4,011 / 4,004
⸻
✅ Summary
Asia opens with constructive bullish structure on the intraday, but capped by the H1 EMA/supply overhead. Best-quality long is buying the pullback into 4,071 → 4,058 (core 4,058–4,046 Golden Zone) with confirmation, aiming for 4,113 → 4,130 → 4,140/4,148. If price breaks and holds above 4,113, momentum longs are valid. A hard rejection at 4,140–4,148 or a break below 4,046 shifts bias to corrective sells back into 4,030 → 4,011/4,004.
Break Confirmation:
• Buy above 4,113 (retest)
• Sell below 4,046 (retest)
Golden Zone: 4,058 – 4,046 (with first support catch 4,071)
⸻
🥇 ElDoradoFx PREMIUM 2.0 – PERFORMANCE 22/10/2025 🥇
📊 GOLD TRADE RESULTS:
⚖️ BUY – BE
🟢 BUY +130 pips
🟢 BUY +70 pips
🔻 SELL +220 pips
🔻 SELL +40 pips
🟢 BUY LIMIT +60 pips
⚪️ SELL LIMIT – Deleted (No Entry)
❌ SELL LIMIT –60 pips (SL)
🔻 SELL +40 pips
---
💰 TOTAL GOLD PIPS WON: ✅ +500 pips
📈 RESULT (Executed trades):
8 Active Trades → 6 Wins | 1 SL | 1 BE
🎯 WIN RATE (on active trades): 75%
---
🔥 Consistent upside momentum caught — clean intraday reversals & disciplined exits kept us in control 💎
👏 Congratulations if you profited! ✅✅✅🚀🚀🚀

When Everyone Was Hyped, We Warned We called the bearish turn on gold right on time:
After we posted the analysis, gold printed one of its sharpest daily drops in years—momentum the market hadn’t seen in a long time. The core view stands: after brief, counter-trend bounces, the primary path remains down. Revisit the previous analysis; the expectation is continued downside after in-trend corrections.
---------------------------------------------------------------------------------------------
🚀 Who am I?
I'm Mahdi, a prop firm trader with 7+ years of experience in technical analysis, mainly focusing on Smart Money Concepts and Elliott Wave theory.
I specialize in delivering high-quality trading signals, market insights, and educational content tailored for serious traders and investors.
📊 My Tools: SMC, Elliott Wave, Fibonacci, Liquidity Grabs, Order Blocks
💼 Prop Challenge Passed: Yes | Funded Account: In Progress
🔗 Follow for consistent updates and trading insights.

ElDoradoFx PREMIUM – GOLD ANALYSIS (22/10/2025, US SESSION)Gold (XAUUSD) is currently trading around 4,025, showing bearish continuation after failing to hold earlier London recovery attempts. Price was rejected strongly near the 4,114–4,125 supply zone, leading to a fresh break lower. The pair is now sitting above the 4,004–4,011 liquidity zone, which is a critical decision area for US volume—either to fuel another push lower or trigger a corrective bounce before continuation.
⸻
🔍 Technical Outlook
Daily Chart (D1)
• Gold continues its bearish corrective phase after multiple failed attempts to reclaim 4,381.
• Today’s candle is currently bearish, pressing toward yesterday’s lower wick region around 4,004.
• RSI has shifted downward from prior strength, signaling momentum loss from buyers.
• MACD histogram fading, indicating continued corrective pressure within macro uptrend.
Bias: Bearish corrective continuation unless 4,125 is reclaimed.
⸻
1H Chart (H1)
• Structure is clearly bearish with repeated lower highs from 4,254 → 4,170 → 4,125.
• Current price consolidating near lower support, testing the 4,004–4,011 reaction zone.
• RSI around 35 → bearish with potential for short-term relief bounce.
• EMA stack remains bearish, with 20 EMA and 50 EMA acting as resistance zones near 4,060.
Intraday Bias: Bearish; expecting either rejection on pullback or continuation through 4,004.
⸻
15M Chart (M15)
• Minor bounce attempts observed at 4,011, but structure remains lower high/lower low.
• MACD flattening, indicating possible pullback into premium areas for better sell entries.
• Price currently trapped between intraday minor support (4,011) and resistance (4,037–4,051).
Short-term View: Bearish with potential for short retracement toward resistance before next move.
⸻
5M Chart (M5)
• A small CHoCH occurred after liquidity tap at 4,011, but not enough to shift higher timeframe bias.
• RSI and MACD turning mildly bullish —early recovery anticipation, but only corrective unless key levels flip.
⸻
✨ Fibonacci Golden Zone
Recent impulse leg: High 4,125 → Low 4,011
🔹 38.2% Fib = 4,037
🔹 50% Fib = 4,048
🔹 61.8% Fib = 4,060
✅ Golden Zone = 4,037–4,060, aligning with EMA resistance and prior sell rejection zone.
➡ This is the preferred sell zone if price retraces during the US session.
⸻
🎯 High Probability Scenarios
✅ Bearish Continuation Setup (Preferred)
📍 Sell Zone: 4,037–4,060 (Golden Zone / EMA rejection)
✅ Trigger: Bearish engulfing / rejection wick from zone
🎯 Targets → 4,020 → 4,011 → 4,004 → 3,980
🛑 SL above 4,070
📉 Breakout Sell (Momentum play)
📍 Sell below 4,004 (Break & Retest)
🎯 Targets → 3,980 → 3,960 → 3,940
🛑 SL above 4,020
🟢 Bullish Countertrend Setup (Low probability unless reversal pattern appears)
📍 Buy at 4,004–4,011 (only with strong bullish engulfing + MACD shift)
🎯 Targets → 4,037 → 4,060
🛑 SL below 3,995
⚠ Bullish Breakout Buy (Only if structure flips)
📍 Buy above 4,070 (Break & Retest + H1 structure shift)
🎯 Targets → 4,095 → 4,114
🛑 SL below 4,060
⸻
📅 Fundamental Outlook – US Session
• US session may bring increased volatility, especially around labor market sentiment or Fed expectations.
• DXY remains firm, maintaining pressure on gold.
• If yields climb further, downside continuation is favored.
• If DXY retraces, a relief bounce into Golden Zone may occur before next sell wave.
⸻
⚠ Key Levels to Watch
Type Level Description
Resistance 4,037 / 4,048 Fib 38.2%–50%
Resistance 4,060 Fib 61.8% / EMA confluence
Resistance 4,070 / 4,114 Full structure invalidation
Support 4,011 Minor liquidity bounce
Support 4,004 Key psychological support
Support 3,980 Breakdown target
⸻
✅ Summary
Gold is in a bearish continuation phase, with price consolidating near support before the next move. The Golden Zone at 4,037–4,060 is crucial — rejection here favors selling back into lows. A clean break below 4,004 triggers further downside. Only a strong reclaim above 4,070 would shift sentiment toward bullish recovery.
Session Bias: Bearish – favor selling rallies.
Break Confirmation:
• ✅ Sell below 4,004
• ⚠ Buy only above 4,070
Golden Zone: 4,037 – 4,060

Gold Trade Set Up Oct 22 2025Gold is coming off a huge down move and is currently ranging on the 15m, so i want to see either a close above 15m high followed by a 5m SSL sweep to target BSL and supply areas or if price fails to close higher and pushes down creating a new 15m low, i will look for sells to lower SSL levels

Gold: The M-top pattern indicates a downward risk📈Gold’s situation today is quite complex, marked by sharp volatility. Looking at the price trend, after a rare steep drop the previous night, the Gold continued to slide following today’s opening, touching a low of 4004.5. It then staged a short-term rebound of over $100, fluctuating around 4100 and peaking at 4161.It then continued to decline.
📝In terms of influencing factors:
The cooling of safe-haven sentiment is one of the key reasons for Gold’s decline. Europe’s support for Russia-Ukraine ceasefire negotiations, the expected resolution of the U.S. government shutdown crisis, and the easing of Sino-U.S. trade tensions have all led to a significant drop in market demand for safe-haven assets.
📈Gold had risen too sharply in the earlier stage, fueling strong sentiment among investors to take profits at high levels. A large number of sell orders pushed its price down sharply.
Additionally, the strengthening of the U.S. dollar during the day has also exerted certain pressure on gold prices.
📝From a technical perspective:
The Gold closed with a long bearish candlestick on the daily chart, accompanied by a simple M-top formation. This indicates the risk of the market continuing to move downward. The upper resistance zone is between 4150 and 4180, the key lower support level is at the 4000 integer mark, and further downside support lies between 3900 and 3904.
💎Trading Strategy:
Buy 4075 - 4085
SL 4060
TP 4115 - 4125 - 4135
Sell 4150 - 4160
SL 4175
TP 4085 - 4100 - 4115
Daily-updated accurate signals are at your disposal. If you run into any problems while trading, these signals serve as a reliable reference—don’t hesitate to use them! I truly hope they bring you significant assistance

XAU/USD 22 October 2025 Intraday AnalysisH4 Analysis:
-> Swing: Bullish.
-> Internal: Bullish.
Analysis and bias remains the same as analysis dated 20 October 2025.
Price has printed as per previous intraday expectation by printing a bearish CHoCH which indicates, but not confirms, bullish pullback phase initiation.
Price is currently trading within an established internal range, however, I will continue to monitor price with regards to depth of pullback.
Intraday expectation:
Price to continue bearish, react at either discount of 50% internal EQ, or H4 supply zone before targeting weak internal high priced at 4,380. 990.
Note:
The Federal Reserve’s sustained dovish stance, coupled with ongoing geopolitical uncertainties, is likely to prolong heightened volatility in the gold market. Given this elevated risk environment, traders should exercise caution and recalibrate risk management strategies to navigate potential price fluctuations effectively.
Additionally, gold pricing remains sensitive to broader macroeconomic developments, including policy decisions under President Trump. Shifts in geopolitical strategy and economic directives could further amplify uncertainty, contributing to market repricing dynamics.
H4 Chart:
M15 Analysis:
-> Swing: Bullish.
-> Internal: Bearish.
Price has printed according to my analysis dated 20 October 2025 where I mention that price is to continue bullish, react at either premium of 50% internal EQ, or M15 demand zone, before targeting weak internal low priced at 4,185.910.
Price has printed a bearish iBOS and subsequently a bullish CHoCH to indicate, but not confirm bullish pullback phase initiation.
Price is now trading within an established internal range.
Intraday expectation:
Price to react at either premium of 50% internal EQ, or M15 demand zone, before targeting weak internal low priced at 4,004.280.
Note:
Gold remains highly volatile amid the Federal Reserve's continued dovish stance, persistent and escalating geopolitical uncertainties. Traders should implement robust risk management strategies and remain vigilant, as price swings may become more pronounced in this elevated volatility environment.
Additionally, President Trump’s tariff announcements, particularly against China, are expected to further amplify market turbulence, potentially triggering sharp price fluctuations and whipsaws.
M15 Chart:

XAU/USD Intraday Plan | Support & Resistance to WatchGold dropped like a rock yesterday, extending its sharp sell-off into the early Asian session, where price briefly touched 4,004 before bouncing back. The move marked one of the steepest single-day declines in weeks, slicing straight through multiple support zones before finding some footing just above 4075(deeper support zone).
Price is now hovering around 4,141, showing early signs of stabilization after yesterday’s flush-out. While the broader uptrend remains intact, short-term momentum has clearly shifted bearish, with the MA50 now acting as dynamic resistance. If buyers can reclaim 4,192 and the MA200, a corrective bounce toward 4,227 and 4,279 could follow.
However, failure to hold above 4,117 would likely trigger another leg lower toward the Deeper Support Zone (4,075–4,044), where stronger buying interest are expected.
📌 Key levels to watch:
Resistance:
4151
4192
4227
4279
4321
Support:
4117
4075
4044
4004
3984
🔎 Fundamental focus:
While short-term sentiment has flipped cautious, the broader macro backdrop remains gold-supportive — ongoing political risk and weak global growth continue to attract dip buyers on major corrections.

ElDoradoFx PREMIUM – GOLD ANALYSIS (22/10/2025, LONDON SESSION)Gold (XAUUSD) is trading around 4,157, rebounding aggressively from the previous sell-off low near 4,004. Buyers have stepped in with conviction, reclaiming short-term structure and driving price back above key intraday levels. London opens with bullish momentum in play, but price is now approaching early resistance zones, where the next directional decision is likely to form.
⸻
🔍 Technical Outlook
Daily Chart (D1)
• Previous daily candle shows a strong lower wick recovery after heavy bearish liquidation.
• Price remains above both 20EMA and 50EMA, suggesting the broader bullish structure is still intact.
• RSI has cooled from overbought but now points upward, indicating renewed bullish pressure.
• MACD remains in positive territory, confirming long-term buyers are still active.
Bias: Bullish corrective rebound, awaiting confirmation for continuation.
⸻
1H Chart (H1)
• Clean bullish CHoCH formed after rejection from 4,004.
• Price is approaching dynamic resistance from 200 EMA (around 4,170).
• RSI at ~46–50, suggesting room for continuation before overbought conditions.
• If price breaks and holds above 4,170, next bullish leg may target 4,200–4,225 liquidity.
Intraday Bias: Bullish toward premium zones unless rejected at 4,170.
⸻
15M Chart (M15)
• Multiple higher lows after bounce confirm controlled bullish momentum.
• RSI around 60, reflecting moderate bullish strength.
• MACD expanding upward → intraday momentum supports continuation into resistance.
• Key minor resistance near 4,160–4,170 may trigger a pullback or consolidation.
Short-term View: In bullish leg, approaching decision zone.
⸻
5M Chart (M5)
• Structure is trending upward, with each dip being bought.
• MACD strongly bullish; histogram rising.
• Any pullback into 4,140–4,135 area may provide minor intraday buy reaction before a deeper decision.
⸻
✨ Fibonacci Golden Zone
Recent impulse leg: Low 4,004 → High 4,160 (current swing)
🔹 38.2% Fib = 4,115
🔹 50% Fib = 4,082
🔹 61.8% Fib = 4,050
✅ Golden Zone = 4,115–4,050, aligning with previous breakout structure and short-term EMA confluence.
➡ If price retraces to this zone and holds, bullish continuation setups may activate.
⸻
🎯 High Probability Scenarios
✅ Bullish Continuation Setup (Preferred if pullback holds)
📍 Buy Zone: 4,115–4,082 (Golden Zone reaction)
✅ Trigger: Bullish engulfing or strong rejection wick
🎯 Targets → 4,150 → 4,170 → 4,200 → 4,225
🛑 SL below 4,050
✅ Break & Retest Buy Setup (Aggressive Momentum Entry)
📍 Buy above 4,170 (Break of EMA confluence)
🎯 Targets → 4,200 → 4,225 → 4,254
🛑 SL below 4,150
⚠️ Bearish Correction Setup (If rejection occurs at premium zone)
📍 Sell if strong rejection at 4,170–4,200
🎯 Targets → 4,140 → 4,115 → 4,082
🛑 SL above 4,209
🔻 Sell Breakout (If bearish momentum resumes)
📍 Sell below 4,050 (Break & Retest)
🎯 Targets → 4,030 → 4,004 → 3,980
🛑 SL above 4,082
⸻
📅 Fundamental Outlook – London Session
• No major European data early session; price action driven by technical flows.
• Focus remains on US data later (unemployment, Fed sentiment).
• DXY cooling slightly after yesterday’s strength, offering support to gold pullback recovery.
• US yields remain elevated — could cap upside unless risk-off intensifies.
⸻
⚠️ Key Levels to Watch
Type Level Description
Resistance 4,170 H1 200 EMA / decision point
Resistance 4,200–4,225 Liquidity target zone
Resistance 4,254 Previous key supply
Support 4,140 Minor intraday support
Support 4,115–4,082 Fibonacci Golden Zone
Support 4,050 Final retracement line
⸻
✅ Summary
Gold is staging a strong recovery rally and remains bullish in early London momentum. A controlled retracement into the Golden Zone (4,115–4,082) would provide an ideal continuation buy opportunity toward 4,170–4,200–4,225. A confirmed break above 4,170 validates continued upside. A strong rejection at 4,170–4,200 may trigger a corrective dip back into the Fib zone.
Session Bias: Bullish, with continuation favored on dips.
Break Confirmation:
• ✅ Buy above 4,170
• ⚠️ Sell below 4,050
Golden Zone: 4,115 – 4,082 – 4,050
⸻
🥇 ElDoradoFx PREMIUM 2.0 – PERFORMANCE 21/10/2025 🥇
📊 GOLD TRADE RESULTS:
🔻 SELL +210 pips
🟢 BUY LIMIT +20 pips
❌ BUY –40 pips (SL)
🟢 BUY +70 pips
🟢 BUY +100 pips
🔻 SELL +210 pips
🟢 BUY +270 pips
---
💰 TOTAL GOLD PIPS WON: ✅ +840 pips
📈 RESULT: 7 Signals → 6 Wins | 1 SL
🎯 ACCURACY: 86%
---
🔥 Solid upward momentum and precision in reversals — swing continuation played out beautifully 📈💎
👏 Congratulations if you profited! ✅✅✅🚀🚀🚀

technical analysis for XAU/USD (Gold) based on your chart:Pair: Gold (XAU/USD)
Chart Summary
Current Price: Around $4,140
Trend Lines: A descending trade line shows the overall short-term bearish trend.
Support Zone: Clearly marked between $4,080 – $4,120 (“SUPPORT BUY ZONE”).
Target: The upside target is labeled near $4,383.
Technical Outlook
🔹 Support Zone Reaction
Price recently dipped into the support buy zone, forming a potential bullish reversal wick.
This area is acting as a strong demand zone, attracting buyers around $4,100.
🔹 Downtrend Channel
The pair remains under a downward-sloping trade line, suggesting the short-term market bias is still bearish.
However, a breakout above this trendline could trigger bullish continuation toward the $4,383 target.
🔹 Short-Term Scenario
Bullish Case (Primary Plan):
If gold holds above the support zone ($4,080–$4,120) and breaks the trendline resistance (~$4,200),
→ next target area: $4,300–$4,383.
Confirmation comes with a clear candle close above $4,200.
Bearish Case (Alternative Plan):
If price fails to break the descending trade line and drops below $4,080,
→ possible continuation toward $4,040 – $4,000.
Key Levels
Type Level (USD) Description
🎯 Target 4,383 Major resistance / profit zone
⚔️ Resistance 4,200 Descending trendline zone
🛒 Support Zone 4,080–4,120 Demand / Buy zone
❌ Invalid Below 4,080 Break below = bearish continuation
Summary
📈 Gold (XAU/USD) is currently retesting its support zone, showing early signs of a bullish rebound.
A confirmed breakout above the trendline could lead to a rally toward $4,380.
However, losing support below $4,080 would invalidate the bullish setup and reintroduce downside risk. EURONEXT:IE6X2025 EURONEXT:BE8Z2025 EURONEXT:BXF1! EURONEXT:CU6X2025 EURONEXT:KB6X2025 EURONEXT:PJ6X2025 EURONEXT:PJ8Z2025 EURONEXT:UM6X2025 EURONEXT:UM8Z2025 EURONEXT:AB6X2025 EURONEXT:AB7X2025

Gold Price Outlook – Trade Setup (XAU/USD)📊 Technical Structure
Gold tumbled below $4,100, finding temporary support around $4,085–$4,093.
The chart shows a descending trendline, keeping short-term momentum bearish.
Immediate resistance lies at $4,142–$4,151, while the support zone is at $4,085–$4,093.
A break above the trendline could trigger a rebound toward resistance, but failure may open the door to deeper losses.
📌 Trade Setup
Entry: $4,093
Stop Loss: $4,080 (below support zone)
Take Profit: $4,150 (resistance retest)
Risk-to-Reward (R:R): ≈ 1 : 4.45
🌍 Macro Background
Gold is pressured by easing US-China trade tensions as both sides prepare for potential tariff negotiations ahead of November 1. This weakens safe-haven flows. At the same time, the steep profit-taking after a nine-week rally adds to selling pressure.
However, risks from the prolonged US government shutdown, concerns over global debt sustainability, and expectations of further Fed rate cuts (October and December) continue to support the medium-term bullish case for gold.
Markets now await US CPI data on Friday (YoY expected at 3.1%), which will be a crucial trigger for USD and gold direction.
🔑 Key Technical Levels
Resistance: $4,142 / $4,151
Support: $4,093 / $4,085
Upside Target (breakout): $4,150–$4,160
Downside Target (failure): $4,070 / $4,050
📋 Trade Summary
Gold faces strong downside momentum but holds above the $4,085 support zone. Short-term strategy favours a rebound trade on a breakout above the descending trendline, targeting $4,150. However, if support fails, the decline could accelerate toward $4,070–$4,050.
⚠️ Disclaimer
This analysis is for reference only and does not constitute trading advice. Trading involves significant risk, and proper risk management is essential.

ElDoradoFx PREMIUM – GOLD ANALYSIS (22/10/2025, ASIA SESSION)Gold (XAUUSD) is currently trading around 4,125, attempting a minor recovery after a strong bearish breakdown during the US session. Price found near-term liquidity around 4,106–4,100, where a short-term bounce is unfolding. Despite this pullback attempt, the overall structure remains bearish unless key resistance levels are reclaimed.
⸻
🔍 Technical Outlook
Daily Chart (D1)
• Strong bearish candle formed after rejection from 4,381.
• Price still above 20EMA and well above 50EMA, confirming a corrective move within a broader bullish trend.
• RSI cooling from overbought; now around mid-level, room for either further correction or bounce.
• MACD still positive but histogram weakening, suggesting potential retracement or pause.
Bias: Corrective bearish inside macro bullish trend.
⸻
1H Chart (H1)
• Clear bearish shift with BOS confirmed below 4,254 and 4,229.
• Rejection from 20EMA and 50EMA above (4,170–4,249) confirms intraday bearish bias.
• RSI recovering from oversold (26→38) indicating a potential pullback leg.
• If gold climbs into 4,160–4,198 zone and rejects, bearish continuation likely.
Intraday Bias: Bearish until H1 closes above 4,200–4,210.
⸻
15M Chart (M15)
• Minor CHoCH formed after bounce at 4,106, with price entering a corrective channel.
• RSI around 55 → short-term recovery phase.
• MACD histogram green but still shallow → possible retracement only.
• Price approaching first resistance around 4,140–4,150.
Short-term View: Pullback phase inside bearish structure.
⸻
5M Chart (M5)
• Series of higher lows forming → bullish momentum attempt.
• MACD positive with expanding green bars.
• RSI above 55 suggests buyers in short control, but nearing resistance.
⸻
✨ Fibonacci Golden Zone
Recent impulse: High 4,254 → Low 4,106
🔹 38.2% Fib = 4,160
🔹 50% Fib = 4,180
🔹 61.8% Fib = 4,198
✅ Golden Zone: 4,160 – 4,198
This zone aligns with intraday EMA resistance and H1 supply, making it a key sell area if rejection occurs.
⸻
🎯 High Probability Scenarios
✅ Bearish Continuation Setup (Preferred)
⚠️ Sell in the 4,160–4,198 Golden Zone upon bearish rejection.
🎯 Targets → 4,140 → 4,120 → 4,106 → 4,080
🛑 SL above 4,210
✅ Breakout Sell (Momentum Play)
⚠️ Sell below 4,106 (Break & Retest)
🎯 Targets → 4,080 → 4,060 → 4,040
🛑 SL above 4,120
⸻
🟢 Bullish Countertrend Setup (Lower Probability)
✅ Buy from 4,106–4,100 only if strong bullish engulfing + MACD flip appear.
🎯 Targets → 4,140 → 4,160 → 4,180
🛑 SL below 4,090
🟢 Bullish Breakout Setup (Structure Shift Only)
✅ Buy above 4,200 (Break & Retest)
🎯 Targets → 4,229 → 4,254
🛑 SL below 4,180
⸻
📅 Fundamental Outlook – Asia Session
• No major Asian economic catalysts early session → market may retrace or range.
• Traders likely positioning for NY session after heavy US selling.
• USD Index holding firm; any DXY weakness could extend pullback.
• Focus shifts to US jobless data and Fed sentiment later today.
⸻
⚠ Key Levels to Watch
Type Level Description
Resistance 4,140 / 4,160 First intraday rejection zones
Resistance 4,180 / 4,198 Fibonacci Golden Zone
Support 4,120 Minor intraday support
Support 4,106–4,100 Liquidity shelf
Support 4,080 Deep corrective target
⸻
✅ Summary
Gold is undergoing a corrective bounce within a bearish intraday trend. The Golden Zone (4,160–4,198) is the critical area for potential continuation sells if rejection is confirmed. A failure to clear 4,200 keeps sellers in control. Buyers only gain momentum above 4,200, or at deep retests near 4,106 with bullish confirmation.
🟢 Reversal Buy only if 4,106 holds with strength.
🔻 Main Scenario: Sell rallies from 4,160–4,198 zone.
📉 Break Confirmation: Sell below 4,106.
✨ Golden Zone: 4,160 – 4,198.
⸻
🥇 ElDoradoFx PREMIUM 2.0 – PERFORMANCE 21/10/2025 🥇
📊 GOLD TRADE RESULTS:
🔻 SELL +210 pips
🟢 BUY LIMIT +20 pips
❌ BUY –40 pips (SL)
🟢 BUY +70 pips
🟢 BUY +100 pips
🔻 SELL +210 pips
🟢 BUY +270 pips
---
💰 TOTAL GOLD PIPS WON: ✅ +840 pips
📈 RESULT: 7 Signals → 6 Wins | 1 SL
🎯 ACCURACY: 86%
---
🔥 Solid upward momentum and precision in reversals — swing continuation played out beautifully 📈💎
👏 Congratulations if you profited! ✅✅✅🚀🚀🚀

Accurately grasp every trading opportunity,do you dare to followGold prices fell sharply in the evening due to the news, with a daily drop of nearly $300. Judging from the daily chart, the large real negative line almost swallowed up all the gains last week, and the bears have absolute control over the market.
Since this morning, Allen has been reminding everyone to pay attention to the M-shaped double-top structure and be alert to the possible sharp market correction. Even if you fail to keep up with our trading rhythm, as long as you refer to my ideas and read them carefully, you can at least effectively avoid being washed out by the market.
As gold continues to fall, various voices have appeared in the market. Bros must keep their eyes open when referring to them. After all, not everyone is as brave as Allen in facing mistakes and losses.
As I said, the bears are currently dominating the market. Although the decline has stagnated slightly in the short term, the downward trend has not completely stopped. It will be difficult for the bulls to recover all their lost ground tonight. The current gold price is hovering around 4110. If it continues to fall, you can pay attention to the short-term support of 4060-4050 below. Try to go long with a light position, set a stop loss, and look for support at the 4000 integer mark if it breaks.
OANDA:XAUUSD

Correct projection for GoldThe core conclusions of today's analysis on gold have all been verified by market trends, which can be summarized in three aspects: trend prediction, key level control, and trend logic:
1-Trend prediction verification: It was clearly stated this morning that "if it breaks below the key support level of 4280, it will enter a consolidation phase and may further drop to 4150". The current gold price is completely in line with this downward range, and the prediction is highly consistent with the actual trend.
2-Key level control: The previously emphasized resistance level at 4380 and support level at 4280 have both become the core boundaries of intraday price fluctuations.
3-We accurately captured "the restrictive effect of support and resistance levels on prices", and there were no deviations in the judgments on "short-term fluctuation rhythm and long-term trend direction", effectively providing clear range and direction references for trading operations.

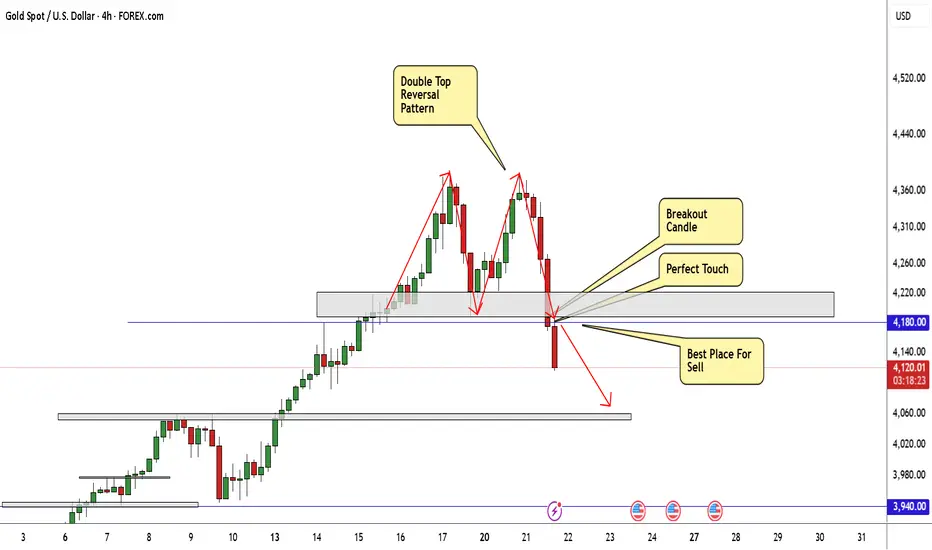
GOLD Finally Made Reversal Pattern , Short Setup To Get 400 PipsHere is my 4H Chart On GOLD , And finally the chart made a reversal pattern The price creating a very clear reversal pattern ( double top) and the price made a very good bearish price action now from good res area so we can enter a sell trade after the price back to retest the neckline to can use a small stop loss and targeting 200 to 400 pips , this is a good bearish movement after this massive movement to upside without any correction , so we will sell this pair for the next weeks .
Gold: Resistance at 4380 is significant📈Today, during the Asian session, the Gold continued its bullish trend, with the price once surging to 4375, but failed to hold steady afterward and pulled back.
📝From a technical perspective, the overall upward structure of London Gold on the daily chart remains intact, and the short-term technical pattern still shows a relatively strong momentum. However, there is certain resistance around the 4380 level, as the price failed to break through it in the previous two attempts,If the resistance at 4380 is broken, it will open the channel for further upward movement, we will focus on the resistance zone around 4400–4440; if this support 4280 fails to hold, gold prices may fall further to 4150 or even lower.
📝Looking at the 4-hour chart, the immediate focus above is on the short-term resistance zone of 4380-4383, while the support zone below is 4280-4290. If the bulls fail to achieve a sustained breakthrough, the market is likely to enter a consolidation phase later. In terms of operation, it is advisable to trade within this range. Refrain from excessive actions or chasing trades at mid-range levels; instead, wait patiently for key levels to enter positions.
💎Trading Strategy:
Buy 4290 - 4300
TP 4320 - 4330 - 4340
SL 4280
Daily-updated accurate signals are at your disposal. If you run into any problems while trading, these signals serve as a reliable reference—don’t hesitate to use them! I truly hope they bring you significant assistance

21/10/68 : XAUUSD ( US Session )Using it from US Session until 11.00AM , I'll new analysis and update at 12.00PM
Resistance
4274-4280
4264-4269
4258
Support
4247
4236-4242
4226-4231

Gold Trade Set Up Oct 21 2025Gold failed to create ATH last night during Asia session and dumped hard shifting to a bearish structure during London session. So now i will mostly be looking for sells. If we get a 15m close under most recent swing low 4214 i will want to see 5m BSl swept at at 4233 before looking for sells but if price closes above 4214 and makes HL on the 15m i will look for short term buys into 5m supply and BSL at 4260 before looking for sells again

XAU/USD Intraday Plan | Support & Resistance to WatchGold attempted another run-up yesterday but failed to sustain momentum, leading to a renewed pullback this session. Price is currently trading around 4259, slipping below the MA50 as short-term momentum softens after repeated rejections from the 4362 resistance zone.
Despite the rejection the broader trend remains bullish above the MA200, though short-term momentum has clearly weakened. If buyers manage to reclaim 4321, gold could reattempt the upside toward 4362 and 4406.
However, a break below 4,279 would expose the First Reaction Zone (4,227–4,192), where buyers will likely defend to maintain trend structure. A deeper breakdown beneath this area could open the way toward 4,151–4,117 near the MA200.
📌 Key levels to watch:
Resistance:
4321
4362
4406
Support:
4279
4227
4192
4151
4117
🔎 Fundamental focus:
The U.S. government shutdown continues to pressure risk sentiment, with political negotiations showing little progress. Several key data releases this week, including PMI and durable goods orders, remain uncertain due to the data blackout, adding to market caution.

GOLD HIGH PROBABILITY SETUP SOON!!!🚨 XAUUSD HIGH PROBABILITY BUY SETUP 🚨
* Here We Can See Clearly The Next Potential Moves For GOLD Coming Hours.
* Keep Your Eyes Close On Your Trading Positions.
* Happy PIP Hunting Traders.
FXKILLA.

GOLD Local Short!
HI,Traders !
#GOLD keeps growing but
will soon hit a
Horizontal resistance
Of 4371.16 so after the
Retest we will be expecting
A local pullback and a
Local move down!
Comment and subscribe to help us grow !

GOLD: BUY $4235, TARGET $4450! (FED RATE CUT PLAY)📰 MACRO & NEWS: Low-Interest Rate Tailwinds
Gold prices are strongly supported by fundamental factors:
Fed Rate Cuts: The market is pricing in a 99% probability of a Fed rate cut next week. Low rates = An ideal environment for Gold.
Safe-Haven Demand: Political uncertainty (extended US Government shutdown) and lingering trade tensions boost safe-haven appeal.
Key Data: Delayed CPI data, expected on October 24th, will serve as a major market catalyst.
Summary: The fundamental momentum for an upside move is dominant and ready for a breakout.
📈 TECHNICAL ANALYSIS: The Perfect LONG Setup!
The chart shows Gold is correcting towards a powerful Demand Zone, where the Uptrend Line converges with a critical structural low.
🎯 Detailed Trading Strategy
We are looking to initiate a buy position as the price hits this demand zone:
Position: LONG (BUY) - Following the primary bullish trend
BUY ZONE (Entry):
$4,237
$4,235 (Key Demand Zone)
SL (Stop Loss):
$4,227 (Protecting the bullish structure's low)
TP (Take Profit Targets):
TP1: $4,245
TP2: $4,255
TP3: $4,265
TP4: $4,275
Final TP: Open (Expecting a New ATH around $4,450+)
REMINDER: This buy opportunity in the demand zone is strongly backed by macro factors (Fed & Instability). Always manage your risk!
#GOLD #XAUUSD #Fed #ATH #TechnicalAnalysis #TradeSetup
