Gold Trade Set Up Oct 17 2025Price has tested a strong support for the third time and is respecting it so i am still bullish from this area to target BSL and ATH levels
Xauusdsetup

#XAUUSD: Small Time-Frame Big Trade! Comment Your Views! Price is at the 'premium buying level' at this point we could expect it to continue the bullish momentum towards 4300$ or $4350. Please use accurate risk management while trading gold.
Good luck

ElDoradoFx PREMIUM – GOLD ANALYSIS (17/10/2025, US SESSION)Prepared by: ElDoradoFx Premium 2.0 Analyst Team
⸻
🧭 Market Overview
Gold has entered a corrective phase after failing to break and sustain above 4,379, the current weekly high. During the London session, price fell sharply to 4,305–4,313, testing the ascending trendline support and the Fibonacci Golden Zone from the latest bullish swing.
The daily chart remains bullish in structure, but intraday momentum has shifted bearish short-term, suggesting a potential retest deeper into support before a continuation to the upside.
⸻
📊 Technical Breakdown
1️⃣ Daily Chart (D1)
• Structure: Uptrend intact — higher highs & higher lows.
• RSI: 85.0 → Overbought, signaling possible cooling phase.
• Support Zone: 4,290–4,273 (near 38.2% retracement).
• Bias: Medium-term bullish; short-term correction.
2️⃣ 1-Hour Chart (H1)
• Price broke minor structure at 4,336 and tapped the lower channel.
• Currently consolidating around 4,313, forming potential base support.
• 50EMA flattening; momentum slowing.
• Bias: Neutral to bearish short-term until 4,336 is reclaimed.
3️⃣ 15M–5M Chart
• MACD bearish, histogram red — short-term selling pressure.
• RSI rebounding from oversold (33) — early signs of intraday support reaction.
• Liquidity below 4,300 remains uncollected — could attract a final sweep before reversal.
⸻
📐 FIBONACCI ANALYSIS (Last Swing: 4,273 → 4,379)
Level Price Confluence
38.2% 4,336 EMA50 / previous structure
50.0% 4,326 Key mid-range
61.8% 4,318 Trendline & intraday liquidity
📊 Fibonacci Golden Zone → 4,318–4,336
This remains the key reaction zone for re-entry confirmation or next leg down if broken.
⸻
🎯 HIGH-PROBABILITY TRADE SCENARIOS
✅ BUY SETUP (Primary Bias – After Confirmation)
• Break & Retest: Above 4,336, confirming buyers reclaim control.
• Retest Zone: 4,330–4,336
• Targets:
• TP1 → 4,350
• TP2 → 4,363
• TP3 → 4,379
• Stop-Loss: Below 4,318
(Re-entry within Golden Zone only if we see bullish engulfing / strong volume candle.)
⸻
⚠️ SELL SETUP (Active Short-Term Bias)
• Break & Retest: Below 4,305, confirming downside continuation.
• Retest Zone: 4,305–4,313
• Targets:
• TP1 → 4,290
• TP2 → 4,273
• TP3 → 4,250
• Stop-Loss: Above 4,336
(This would confirm Golden Zone break and shift momentum bearish toward 4,273.)
⸻
🚀 BREAKOUT BUY (Aggressive)
• Trigger: Break & retest above 4,379 (previous high).
• Retest Zone: 4,372–4,379
• Targets: 4,395 → 4,410 → 4,428
• Stop-Loss: Below 4,355
⸻
🕐 FUNDAMENTAL WATCH
• DXY: Hovering around 104.90 — slight rebound causing gold weakness.
• Bond Yields: Stable; no risk-off catalyst for new gold strength yet.
• Upcoming US Data: Michigan Consumer Sentiment — could add volatility later.
• Institutional Flow: Still net-long on gold, suggesting corrections are accumulation phases.
⸻
⚙️ KEY TECHNICAL LEVELS
Type Levels
Resistance 4,336 / 4,363 / 4,379
Support 4,318 / 4,305 / 4,273
Trendline Support 4,305 (critical for maintaining bullish structure)
⸻
🧾 Analyst Summary
Gold remains bullish overall, but short-term momentum has shifted bearish following repeated rejections from 4,379.
Current retracement into 4,318–4,305 is a critical decision zone — if this holds, expect recovery toward 4,350–4,379.
However, a clean break below 4,305 confirms a deeper pullback toward 4,273–4,250 before the next major wave higher.
⸻
📈 Bias: Bullish above 4,318 – Watch for re-entry confirmation.
📉 Alternative Bias: Bearish below 4,305 – Short toward 4,273.

XAUUSD 15M PROJECTIONXAUUSD 15M PROJECTION
TREND REVERSAL SIGN HAPPENED.
CUREENT TREND BEARISH.
BIG SELL COMING
drop like hell
short now

GOLD Local Long!
HI,Traders !
#GOLD is going down
To retest the horizontal
Support of 4314.84from
Where we will be expecting
A local bullish rebound
And a move up !
Comment and subscribe to help us grow !

GOLD (XAU/USD) BULLISH CONTINUATION SETUP AFTER RETESTChart Overview
Timeframe: 1H (Hourly)
Current Price: Around $4,338
Trend: Strong bullish trend within a rising channel
Structure: Price broke slightly above the channel top and is now retesting the resistance level as potential new support
🔍 Detailed Analysis
1. Trend Structure
Gold has been moving in a strong upward channel, showing consistent higher highs and higher lows.
The breakout above the resistance channel suggests bullish continuation, but a short-term pullback or retest is expected before another leg up.
2. Key Levels
Resistance Level: Around $4,350 – $4,370, now acting as support.
Entry Zone: Around $4,313 – $4,338 (highlighted region).
Stop Loss: Below $4,274 – $4,268 zone to protect against false breakouts.
Target Point: Around $4,509 – $4,513, which aligns with the projected move from the breakout zone.
💹 Trade Plan (Bullish Setup)
Entry: Wait for price to test and hold above $4,313 (confirmation candle or bullish rejection).
Stop Loss: $4,274 – $4,268 (below recent swing low).
Take Profit: $4,509 – $4,513.
Risk/Reward Ratio: Roughly 1:4, which is excellent for a continuation trade.
⚠️ Market Sentiment Notes
If gold fails to hold above $4,313, the move could turn into a deeper correction toward $4,250 – $4,200.
Watch for strong bullish candles near the entry zone for confirmation.
The setup remains bullish-biased, but patience for a clean entry is key.
✅ Summary:
Bias: Bullish
Setup Type: Pullback continuation
Buy Zone: $4,313 – $4,338
Target: $4,509 – $4,513
Stop: $4,268

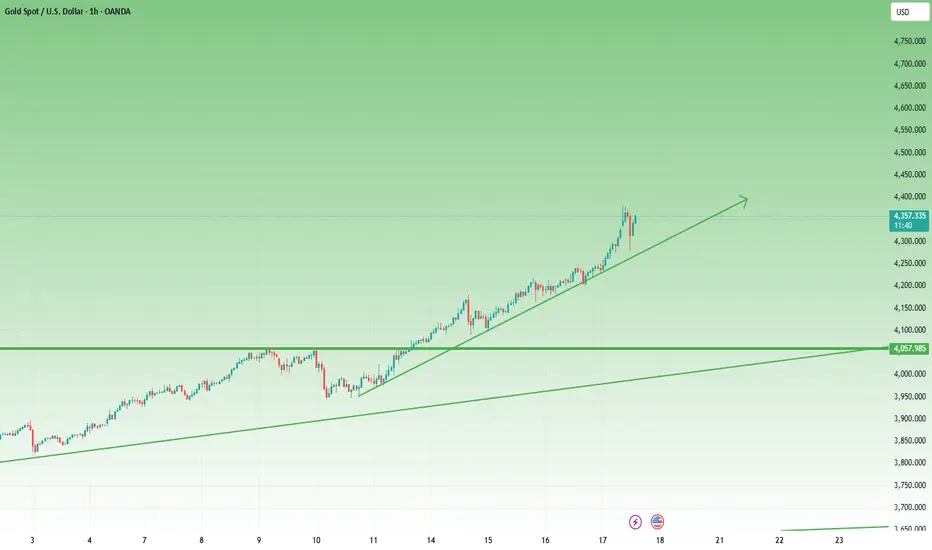
XAU/USD Intraday Plan | Support & Resistance to WatchGold continues its historic rally, printing new all-time highs almost daily. Price is currently hovering around 4,356, consolidating just below the 4,385 resistance after a steep vertical move higher.
Momentum remains strong, with price holding well above both the MA50 and MA200, confirming that buyers remain firmly in control.
Immediate resistance sits at 4,385, followed by 4,406, 4,425, and 4,445. If price fails to break above 4,356, watch the First Reaction Zone (4,329–4,307) for a potential minor pullback.
Failure to hold this zone could open the way for a deeper correction toward lower support areas in line with the moving averages.
📌Key levels to watch:
Resistance:
4356
4385
4406
4425
4445
Support:
4329
4307
4280
4257
4235
4205
🔎 Fundamental focus:
The U.S. government shutdown and ongoing U.S.–China trade tensions continue to cloud market sentiment, driving investors toward safe-haven assets. The uncertainty has created a “no-ceiling” environment for gold, where every dip is quickly absorbed and traders keep chasing fresh all-time highs amid strong momentum and risk aversion.

ElDoradoFx PREMIUM – GOLD ANALYSIS (17/10/2025, LONDON SESSION)Prepared by: ElDoradoFx Premium Analyst Team
⸻
🧭 Market Overview
Gold remains in a strong bullish cycle, printing higher highs and higher lows across all major timeframes. However, after multiple rejections near $4,379–$4,380, the market is showing temporary exhaustion, hinting at a possible short-term retracement before continuation.
RSI readings above 85 on the daily chart suggest the metal is overbought, yet momentum structure remains intact.
⸻
📊 Technical Breakdown
1️⃣ Daily Chart (D1)
• Structure: Clear bullish trend continuation.
• RSI: 86.0, signaling potential short-term correction.
• Key Support: 4,316 – 4,273 (previous resistance now turned support).
• Bias: Bullish but extended — watch for retracement into 38.2%–61.8% Fib zone.
2️⃣ 1H Chart (H1)
• Price rejected resistance at 4,379, forming a lower high with weakening MACD histogram.
• 50EMA and 200EMA both sloping upward — overall momentum remains long-term bullish.
• Support Zone: 4,336–4,318 (Fibonacci confluence).
• Bias: Short-term corrective retracement expected before new buying momentum resumes.
3️⃣ 15M–5M Charts
• Consolidation within a tight intraday channel.
• Liquidity above 4,379 remains uncollected — likely target after correction.
• MACD turning flat, confirming short-term pause.
⸻
📐 Fibonacci Analysis (Last Swing: 4,273 → 4,379)
Level Price Confluence
38.2% 4,336 Near EMA50 & intraday support
50.0% 4,326 Mid-channel support
61.8% 4,318 Trendline intersection / re-entry zone
📊 Fibonacci Golden Zone: 4,318–4,336
→ Optimal area to look for bullish confirmation patterns before re-entry.
⸻
🎯 High-Probability Trade Scenarios
✅ BUY SCENARIO (Primary Bias)
• Break & Retest: Above 4,364, confirming short-term bullish continuation.
• Retest Zone: 4,350–4,355
• Targets:
• TP1 → 4,379
• TP2 → 4,395
• TP3 → 4,410
• Stop-Loss: Below 4,338
⚠️ SELL SCENARIO (Countertrend Opportunity)
• Break & Retest: Below 4,336, signaling potential correction phase.
• Retest Zone: 4,336–4,345
• Targets:
• TP1 → 4,318
• TP2 → 4,300
• TP3 → 4,273
• Stop-Loss: Above 4,355
🚀 AGGRESSIVE BREAKOUT BUY
• Trigger: Clean breakout above 4,379 and candle closure.
• Retest Zone: 4,372–4,379
• Targets: 4,395 → 4,410 → 4,428
• Stop-Loss: Below 4,355
⸻
📰 Fundamental Outlook
• US Data: Light calendar until NY session; traders watching inflation expectations.
• DXY: Below 104.80, maintaining downward bias, supportive for gold.
• Yields: Neutral; no fresh upside momentum observed.
• Global Sentiment: Slightly risk-off, benefiting gold as a hedge.
⸻
⚙️ Key Technical Levels
Type Levels
Resistance 4,379 / 4,395 / 4,410
Support 4,336 / 4,318 / 4,273
Pivot Zone 4,350–4,355 (London liquidity area)
⸻
🧾 Analyst Summary
Gold remains structurally bullish while holding above 4,336, though an intraday pullback into the Fibonacci Golden Zone (4,318–4,336) would offer better long entry opportunities.
A confirmed break above 4,379 can open a clean path toward 4,410–4,428.
If 4,336 fails to hold, expect a healthy retracement toward 4,300–4,273 before the next bullish impulse.
⸻
📈 Bias: Bullish above 4,336 — Corrective phase expected before continuation.
📉 Alternative Bias: Bearish short-term below 4,336 (retracement only).

17/10/68 : XAUUSD ( Europe / London Session )Using it from Europe Session until 7.00PM , I'll new analysis and update at 8.00PM
Resistance
4396-4401
4386-4391
4381
Support
4370
4360-4365
4349-4355

Gold – Madness in MotionGold rose this week — so far (and I really want to stress so far ) — by around 10%. That’s massive by any standard.
On Monday, I tried to catch a dip and missed it. Since Tuesday, I’ve been on the sell side — completely wrong on direction , yet somehow still managed to finish positive overall.
Yesterday my stop got hit, but after what happened overnight, it turned out to be just a scratch. With this kind of volatility, a recovery of 250pips can happen in ten minutes.
Looking at the chart — it’s bullish, no question. Should it be bought? Hmmmm...
Looking at the volatility… for me, it’s become untradeable.
Can it keep going higher? Of course.
How high? Nobody knows.
At this point, any prediction is just throwing numbers in the air.
Trading corrections, as I’ve tried to do, is a guessing game. I’ve had some luck so far, but after yesterday's stop loss, I’m stepping aside.
My take: stay out. Let others make money if they can.
A 1,000-pip rise and an equal reversal — all while I was asleep (and trust me, I sleep very little) — is too crazy. Stops can be wiped for bulls just as easily as for bears.
At some point, it will settle down and define its levels.
Until then — it’s not for me anymore.
XAUUSD: $4,400 Target Next! Gold Bull Run ContinuesKey Observations:
Massive Uptrend: The chart clearly displays a strong, multi-day uptrend, marked by a series of high-momentum green (bullish) candlesticks.
Recent Price Action: Price has recently surged, followed by a minor retracement (the most recent red candle), but remains near the top of the move. This indicates the primary momentum is still firmly to the upside.
Key Support/Demand Zones:Immediate Demand (Yellow Box): A small yellow box is marked around the $\$4,250$ area. This represents a very recent, short-term support or 'flip' zone where price broke out and could potentially retest before moving higher.Deeper Demand (Blue Box): A larger blue box (around $\$4,130$ to $\$4,190$) represents a more significant, underlying demand zone.
Projected Price Action: The hand-drawn path suggests a direct continuation with potentially only a minor dip:
The path shows a small pullback toward the $\$4,300$ area (not explicitly marked by a zone) or a brief sideways move.
The black arrow points to an anticipated strong push up to the final target, resuming the dominant uptrend without necessarily hitting the marked yellow or blue zones.
Target: A dotted blue line at $\$4,400.69$ is the clear final target for this trade setup.

Gold Price Outlook – Trade Setup (XAU/USD)📊 Technical Structure
OANDA:XAUUSD Gold surged to a fresh record near $4,380 before retracing lower, now consolidating around $4,320–$4,330. The support zone sits at $4,301–$4,290, while the resistance zone is located at $4,368–$4,377. Price action shows a sharp pullback from highs, but bulls still hold ground above the key support. A rebound scenario could see a push back toward the resistance, while a decisive break below $4,285 would invalidate the bullish setup.
🎯 Trade Setup (Bullish Scenario)
Entry: $4,301–$4,290 (near consolidation & above support)
Stop Loss: $4,285
Take Profit 1: $4,350
Take Profit 2: $4,368
Take Profit 3: $4,377
Risk/Reward: ≈ 1 : 4.91
🗝️ Key Technical Levels
Resistance: $4,350 / $4,368 / $4,377
Support: $4,301 / $4,290
🌍 Macro Background
Gold remains supported by Fed rate cut bets, US-China trade frictions, and prolonged US government shutdown fears.
Fed Policy: Powell and Waller signalled two more cuts this year, reducing the opportunity cost of holding gold.
US-China Tensions: Additional port fees and tariff threats fuel safe-haven demand.
US Government Shutdown: Entering its third week, weighing on the USD and indirectly boosting gold.
Geopolitics: Some easing in Ukraine risks could cap upside, but macro drivers remain gold-positive.
📌 Trade Summary
Gold remains in a strong uptrend despite intraday corrections. A long setup near $4,301–$4,290 with stops under $4,285 offers a favourable risk-reward toward $4,368–$4,377. Safe-haven demand and dovish Fed expectations continue to support bullish momentum.
⚠️ Disclaimer
This analysis is for reference only and does not constitute trading advice. Trading involves significant risk, and proper risk management is essential.

Gold Bullish Continuation Toward 4,300 TargetTrend Direction: The overall structure is clearly bullish, with price continuing to rise after breaking previous resistance levels.
Price Action: After a strong impulsive move upward, a small corrective phase (pullback) is visible — represented by the zigzag arrow — suggesting a healthy retracement before continuation.
Key Zone: The highlighted blue-green box marks a demand or fair value gap (FVG) region where buyers previously entered strongly, likely acting as a support area for future pullbacks.
Current Price: Around $4,195.84, maintaining bullish momentum.
Target: The projection line points toward a target zone near $4,300, indicating the next resistance or profit-taking level.
Overall Sentiment: Bullish continuation toward the upper target, provided the price sustains above the previous support zone around $4,100–$4,000.

ElDoradoFx PREMIUM 2.0 – GOLD (17/10/2025, ASIA SESSION)Gold is currently trading around 4,362, maintaining strong bullish momentum after breaking the 4,350 psychological level. The market remains in an extended uptrend, but RSI and structure show overbought signs, so a short-term correction or retest may occur before continuation.
⸻
🔍 Technical Outlook
D1: Strong bullish structure with higher highs and higher lows. RSI (88.1) indicates extreme overbought — possible short-term pullback.
H1: Price reached the top of the ascending channel at 4,379 (new high) and is now consolidating below. Momentum remains positive above 4,340, but divergence is forming.
15M–5M: Minor rejection from 4,379–4,380 resistance zone; MACD showing slowing bullish histogram — suggesting potential retest before next leg up.
⸻
📊 Fibonacci Golden Zone (Latest Swing)
Swing Low → 4,291
Swing High → 4,379
🎯 Golden Zone = 4,324–4,338
This aligns with 50EMA + channel midline — ideal retracement area for new buy entries if price dips.
⸻
🎯 High Probability Entry Zones (Break & Retest)
✅ BUY SETUP (Main Bias)
• Break & Retest: Above 4,363 → Retest zone 4,350–4,355
🎯 TP1 → 4,379 TP2 → 4,395 TP3 → 4,410
🛑 SL below 4,338
⚠️ SELL SETUP (Short-Term Countertrend)
• Break & Retest: Below 4,338 → Retest zone 4,338–4,345
🎯 TP1 → 4,324 TP2 → 4,310 TP3 → 4,294
🛑 SL above 4,355
🚀 BREAKOUT BUY (Aggressive Setup)
• Break & Retest: Above 4,379 (new high) → Retest 4,372–4,379
🎯 TP1 → 4,395 TP2 → 4,410 TP3 → 4,428
🛑 SL below 4,355
⸻
🕐 Fundamental Watch
• DXY slightly weaker near 104.85, favoring gold’s bullish continuation.
• Yields remain capped — positive for metals.
• No major Asia-session news expected — technicals will drive price action.
⸻
⚠️ Key Levels
Resistance → 4,379 / 4,395 / 4,410
Support → 4,338 / 4,324 / 4,310
⸻
✅ Summary
Gold remains bullish while above 4,338 (Golden Zone support).
A break & retest above 4,363 opens room for continuation toward 4,395–4,410.
Failure to hold above 4,338 may trigger a healthy pullback to 4,310–4,294 before new buyers step in.

Gold: Full verification of today's trend prediction👏Our prediction for today's gold trend has been validated by the market:
1.Key Level Prediction: We previously indicated that after consolidating with oscillations during the daytime, gold would require close attention to the breakthrough and stabilization of the 4250 level, a break above this level was expected to sustain an upward momentum. The actual market movement showed that after completing its daytime fluctuations, gold successfully broke through 4250, stabilized above it, and immediately initiated an upward rally.
2.Target Range Achievement: Based on the breakthrough logic, we set the preset upward target range at 4280 – 4300. By the end of today’s trading session, gold had successfully reached this range, peaking at 4298.64. The accurate realization of the target validates the effectiveness of our judgment on bullish momentum and resistance levels.
💡Our today’s prediction for gold was built on the core framework of "technical key level breakthrough + trend continuity": it focused on the "sustained bullish momentum following a breakthrough of key resistance", and incorporated an analysis of market sentiment and volume logic. Ultimately, this resulted in a high degree of alignment between the prediction and the actual market trend.

Gold (XAU/USD) Breakout Rally Toward New Highs!Analysis:
Gold (XAU/USD) continues its strong bullish momentum on the 4-hour chart, forming a series of higher highs and higher lows, confirming a sustained uptrend. The recent breakout above the resistance zone near $4,150–$4,170 indicates renewed buying interest and momentum buildup.
After a brief retest of the breakout area, price has started climbing again — a sign of trend continuation supported by bullish candle formations and strong market sentiment.
Technical Outlook:
Support Zone: $4,140 – $4,170 (previous resistance turned support)
Bullish Confirmation: Continuation pattern with clean structure and volume support
Momentum Bias: Strongly bullish while above $4,150
🎯 Target: $4,300 – $4,320 zone
🛑 Stop Loss: Below $4,140 to limit downside risk
📈 Summary:
As long as gold stays above the breakout level of $4,170, the market remains bullish, with upside potential toward $4,300–$4,320, aligning with the next major resistance area.

16/10/68 : XAUUSD ( US Session )Using it from US Session until 11.00AM , I'll new analysis and update at 12.00PM
Resistance
4260-4265
4250-4255
4245
Support
4234
4223-4229
4213-4218

Gold Trade Set Up Oct 16 2025Gold is trading above PDH and broke structure on the 1h creating a new HH but i first want to see a sweep of SSL/London lows followed by a 15m bullish candle close to then a push higher to ATH

ElDoradoFx PREMIUM – GOLD (16/10/2025, US SESSION)Professional Technical & Fundamental Breakdown by ElDoradoFx
Gold is currently trading near 4,241, consolidating below the resistance zone 4,246–4,250, after a strong bullish rally in the London session. The market structure remains bullish, but there are signs of temporary exhaustion at the top of the ascending channel.
⸻
🔍 Technical Outlook
Daily (D1):
• Price continues forming higher highs, maintaining strong bullish momentum.
• RSI remains extremely overbought (85.4), suggesting limited upside before a corrective move.
• MACD still bullish but starting to flatten — showing early divergence risk.
1H (H1):
• Price touched the upper channel trendline at 4,247 and rejected slightly, forming a weak high.
• EMAs (50 & 100) are below price supporting structure; however, bullish momentum is slowing down.
• RSI at 64.7 — healthy but approaching overbought intraday conditions.
15M–5M:
• Multiple BOS confirmations and minor pullbacks indicate bulls still in control.
• MACD shows positive momentum but histogram is flattening — suggesting a possible short-term retracement before continuation.
• Immediate intraday support located at 4,228–4,230 zone.
⸻
📊 Fibonacci Golden Zone (Latest Swing)
Swing Low → 4,203
Swing High → 4,247
🎯 Golden Zone = 4,223–4,230
This zone aligns with 50EMA and channel mid-support — ideal re-entry point if price pulls back before resuming the uptrend.
⸻
🎯 High Probability Entry Zones
✅ BUY SETUP (Main Bias)
Entry Zone: 4,223–4,230 (Golden Zone)
🎯 TP1 → 4,242 TP2 → 4,255 TP3 → 4,268
🛑 SL below 4,210
⚠️ SELL SETUP (Short-Term Countertrend)
Entry only if price fails again to break 4,247 and closes below 4,228
🎯 TP1 → 4,215 TP2 → 4,203 TP3 → 4,185
🛑 SL above 4,250
🚀 BREAKOUT BUY (Aggressive Setup)
Buy above 4,247 (Clean Breakout)
🎯 TP1 → 4,260 TP2 → 4,275 TP3 → 4,290
🛑 SL below 4,228
⸻
🕐 Fundamental Outlook
• DXY trading flat around 105.05, failing to extend upside — mildly supportive for gold.
• Yields remain steady, adding temporary equilibrium to the market.
• Fed speakers later today could trigger intraday volatility; trade with caution near resistance zones.
⸻
⚠️ Key Levels to Watch
Resistance → 4,246 / 4,255 / 4,268
Support → 4,230 / 4,223 / 4,210 / 4,203
⸻
✅ Summary
Gold remains in a strong bullish structure.
If 4,223–4,230 holds, expect continuation toward 4,255–4,268.
Failure to hold 4,228 could open retracement toward 4,203–4,185 before resuming upside.

Gold: Go long around the 4205–4210Gold has risen for the fifth consecutive day, briefly breaking through the all-time high of 4241.99, before pulling back to around 4210 as the U.S. Dollar Index regained lost ground.
From the 4-hour chart perspective, focus on the short-term support range of 4196–4200 in the near term, with key emphasis on the critical support zone of 4160–4180. Based on its recent performance, all pullbacks are traps set by bulls. Currently, bullish momentum remains intact as prices consolidate above 4230. The only viable approach is to wait patiently for retracements before entering long positions.
For intraday gold trading, we recommend entering long positions around the 4205–4210 range, with targets set near 4230 and 4250. Given the strong bullish trend, there is no clear top in sight. Operationally, prioritize buying on dips; avoid trading in the middle range and refrain from chasing rallies recklessly. Exercise patience and wait for entries at key levels.
Buy 4205 - 4210
TP 4230 - 4250
SL 4195
Daily-updated accurate signals are at your disposal. If you run into any problems while trading, these signals serve as a reliable reference—don’t hesitate to use them! I truly hope they bring you significant assistance

XAU/USD Intraday Plan | Support & Resistance to WatchGold continues its powerful ascent, extending gains and printing new all-time highs in nearly every session.
Price is currently trending near 4,235 — an intraday resistance level — while momentum remains firm, showing sustained buyer dominance.
If price reclaims and holds above 4,235, the next resistance sits at 4,257, followed by 4,280 as an extended upside target.
Immediate support is seen at 4,205, and if a deeper pullback develops, watch the First Reaction Zone (4,176–4,150) for potential re-entry opportunities.
The broader bias remains bullish with MA50 and MA200 continuing to provide dynamic trend support.
📌Key levels to watch:
Resistance:
4235
4264
4280
Support:
4205
4176
4150
4112
4082
🔎Fundamental Focus:
Markets are increasingly betting that the Federal Reserve will cut interest rates sooner rather than later, boosting gold’s appeal as lower yields reduce the cost of holding the metal. At the same time, the U.S. government shutdown is adding another layer of uncertainty, freezing data releases and shaking confidence in fiscal management.
Tensions between the U.S. and China, along with political instability in parts of Europe and Asia, continue to weigh on global risk sentiment. Meanwhile, central banks and large funds keep accumulating gold as a hedge against debt, inflation, and a weakening dollar.
Together, these forces have created an environment with no clear ceiling for gold, as every dip is met with strong buying and momentum keeps pushing prices to new record highs.

ElDoradoFx PREMIUM – (16/10/2025, LONDON SESSION)Professional Technical & Fundamental Breakdown by ElDoradoFx
Gold is currently trading around 4,223, rebounding from the Asian low 4,203 after a liquidity sweep. The metal remains within its ascending structure but is showing signs of exhaustion below 4,242, which remains the daily high and the main resistance barrier.
⸻
🔍 Technical Outlook
Daily (D1):
• Strong bullish trend remains intact; candles consistently printing higher lows.
• RSI at 84.9, heavily overbought, signaling limited upside without a correction.
• MACD still bullish but starting to flatten — watch for potential divergence.
1H (H1):
• Price retested the ascending channel support and bounced from the 50EMA + 100EMA confluence (4,203–4,213).
• Currently approaching minor resistance 4,228–4,235 — rejection here could trigger another pullback.
• RSI neutral at 58–60, showing potential equilibrium before breakout or rejection.
• MACD histogram turning positive again, confirming short-term buyer momentum.
15M–5M:
• Clear BOS and sweep of liquidity below 4,203, followed by strong bullish engulfing — intraday bullish bias.
• 5M chart shows early momentum loss near 4,228, caution for fake breakouts.
• Volume recovering after Asian quiet period; London likely to set the directional tone.
⸻
📊 Fibonacci Golden Zone (Latest Swing)
Swing Low → 4,203
Swing High → 4,242
🎯 Golden Zone = 4,213–4,219
This area aligns with moving average support and mid-channel retest — high-probability reentry point for continuation buys.
⸻
📌 High Probability Entry Zones
✅ BUY SETUP (Main Bias)
Entry Zone: 4,213–4,219 (Golden Zone)
🎯 TP1 → 4,235 TP2 → 4,242 TP3 → 4,255
🛑 SL below 4,203
⚠️ SELL SETUP (Countertrend)
Sell only below 4,203 (Break & Retest)
🎯 TP1 → 4,185 TP2 → 4,176 TP3 → 4,165
🛑 SL above 4,213
🚀 BREAKOUT BUY (Aggressive Setup)
Buy above 4,242 (Clean Breakout)
🎯 TP1 → 4,255 TP2 → 4,268 TP3 → 4,280
🛑 SL below 4,225
⸻
📅 Fundamental & Macro Overview
🕐 London session begins with cautious optimism as traders await U.S. data.
💵 DXY stabilizing near 105.10, slightly weaker, supporting gold’s rebound.
📈 U.S. yields remain capped, keeping the medium-term bullish structure intact.
⚙️ No high-impact news in early London hours — expect technical-led volatility.
⸻
⚠️ Key Levels to Monitor
Resistance → 4,228 / 4,235 / 4,242 / 4,255
Support → 4,219 / 4,213 / 4,203 / 4,185
⸻
✅ Summary
Gold is holding its bullish structure with strong recovery momentum from 4,203.
As long as 4,213–4,219 holds, bias remains bullish toward 4,235–4,242.
A confirmed break below 4,203 would shift bias short-term bearish toward 4,185–4,165.

16/10/68 : XAUUSD ( Europe / London Session )Using it from Europe Session until 7.00PM , I'll new analysis and update at 8.00PM
Resistance
4255-4260
4245-4250
4240
Support
4229
4218-4224
4207-4213
