Bullish Breakout Trade Setup on XAU/USD – Targeting 3,707 After Chart Components and Analysis
1. Descending Channel
The price was previously moving within a clearly defined downtrend channel (marked in red with blue borders).
The lower and upper bounds are acting as dynamic support and resistance levels.
2. Breakout Zone
The price appears to have broken out of the descending channel to the upside, or is attempting to break out.
The breakout suggests a potential reversal or bullish momentum.
📈 Trade Setup Details
Element Level Description
Entry Point 3,654.27 Suggested level to enter a long position
Stop Loss 3,643.58 Risk management level below recent support
Target Point 3,707.38 Take profit target at the next resistance zone
Current Price 3,662.37 Price at the time of chart capture
📊 Risk-to-Reward Ratio (RRR)
Entry: 3,654.27
Stop Loss: 3,643.58 → ~10.69 points risk
Target: 3,707.38 → ~53.11 points reward
➡️ Risk-to-Reward Ratio ≈ 1:5, which is excellent. It suggests a well-planned trade with high reward potential relative to the risk.
📉 Price Action Forecast
The black zigzag line suggests expected short-term price retracement before moving up.
This could be a bullish flag pattern or a retest of the breakout zone before continuation upward.
✅ Bullish Indicators
Channel breakout.
High RRR.
Structured trade setup with clearly defined stop loss and target.
⚠️ Risks & Considerations
False breakout: Wait for confirmation (candle close outside the channel).
Market volatility: Economic news could affect Gold prices.
Retest failure: If price fails to hold above entry zone, trade invalidates.
🧠 Conclusion
This is a bullish breakout trade with a strong risk-to-reward profile. The trade logic hinges on the assumption that Gold has ended its correction (downtrend channel) and is now beginning a new upward leg. If the price successfully holds above the breakout level and continues upward, the target around 3,707 is realistic.
Xauusdsetup

[Update] ANFIBO | XAUUSD ON 09.17.2025 HIT 600 PIPSAwesome, this is a BIG PROFIT for those who followed and paid attention to my Plan. Resistance level 3705 gave us 6OO pips and could have been more. Congratulations everyone and good luck!

GOLD Support Below!
HI,Traders !
#GOLD is trading in an
Uptrend and is
Now making a local bearish
Correction to retest the
Horizontal support below
Around 3658.62 from where
We will be expecting a
Further bullish move up !
Comment and subscribe to help us grow !

XAUUSD – FOMC Rate-Cut Watch (Key Levels & Outlook)Gold is holding around $3,686 as traders brace for the FOMC decision at 8 pm (UTC-2). Markets are increasingly pricing a potential rate cut, which would typically weaken the USD and support gold.
Key Levels
Upside Resistance:
• $3,693–3,695 – first breakout zone
• $3,703 – critical resistance, sustained close above opens door to $3,710+
Immediate Support:
• $3,682 / 3,678 – intraday demand
• $3,676–3,675 – next strong bid area
• $3,674 – last major floor before deeper pullback
Scenarios
Bullish: A dovish Fed or an actual rate cut could spark a rally through $3,695, targeting $3,703 and potentially $3,710–3,720.
Bearish: A hawkish surprise or no cut may send price back toward $3,678, with deeper support near $3,674.
Fundamentals
Rate Cut Probability: Markets are eyeing slowing U.S. labor data and softer inflation as justification for a 25 bps cut.
USD & Yields: Lower yields would typically push the dollar lower and gold higher.
Risk Events: Watch Fed press conference language for hints of further easing.
⚠️ Trading Plan: Wait for the FOMC announcement before committing. Breakout above $3,695 favors longs; rejection could set up a quick move back to $3,676.
This is market commentary, not financial advice—manage risk carefully around high-volatility events.
Greetings,
MrYounity

17/9/68 : XAUUSD ( US Session )Using it from US Session until 11.00AM , I'll new analysis and update at 12.00PM
Resistance
3697-3703
3687-3692
3677-3682
3671
Support
3661
3651-3656
3640-3646
3630-3635

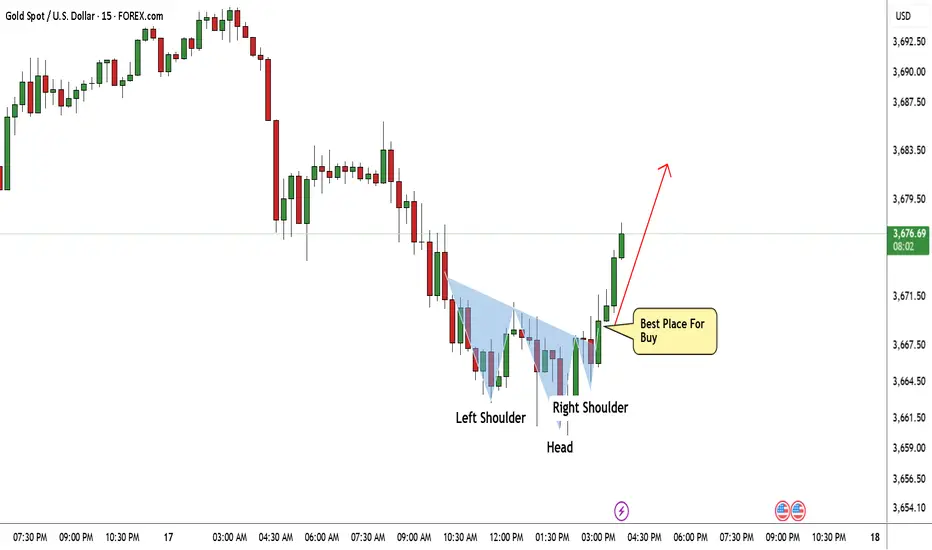
Gold Made A Clear Reversal Pattern , Long Setup To Get 200 PipsHere is my 15 Mins Chart On GOLD , The price creating a very clear reversal pattern ( Reversal head and shoulders pattern ) and the price made a very good bullish price action now and the price above my neckline. so we can enter a buy trade After the price go back to retest my broken neckline . For this trade we can be targeting from 100 : 150 pips with a decent stop loss.
Reasons To Enter :
1- Perfect Touch For The Area .
2- Clear Bullish Price Action .
3- Bigger T.F Giving Good Bullish P.A .
4- The Price Take The Last High .
5- Perfect 15 Mins Closure .
6- Reversal Pattern .
17/9/68 : XAUUSD ( Europe / London Session )Using it from Europe Session until 7.00PM , I'll new analysis and update at 8.00PM
Resistance
3703-3708
3691-3697
3686
Support
3676
3665-3670
3654-3660

Fed Cuts Could Ignite a Breakout Above $3,700?📊 Technical Structure
Gold (XAU/USD) is trading near $3,682 after bouncing from the support zone at $3,678 – $3,679. The chart highlights a bullish setup, with potential continuation towards the resistance zone $3,691 – $3,695. The short-term trendline break also supports renewed upside momentum, while buyers remain in control above the support base.
🎯 Trade Setup
Entry: $3,678 – $3,679 (near support zone)
Stop Loss: $3,677 (below support)
Take Profit: $3,691 / $3,695 (resistance zone)
Risk/Reward: ~1 : 7.17
🗝️ Key Technical Levels
Resistance Zone: $3,691 – $3,695
Support Zone: $3,678 – $3,679
Major Resistance Above: $3,700 psychological barrier
Key Support Below: $3,674
🌐 Macro Background
Gold is firming up as markets await the FOMC decision, with traders widely expecting a 25 bps Fed rate cut—the first in 2025. The prospect of further cuts later this year supports gold as a non-yielding asset. However, easing US-China trade tensions and improved risk sentiment could limit haven flows in the short run.
📌 Trade Summary
The technical setup favours a long entry near $3,679, targeting the $3,691–$3,695 resistance area. The bias remains bullish while gold holds above $3,678 support. Watch for volatility around the Fed decision later today.
⚠️ Disclaimer
This analysis is for reference only and does not constitute trading advice. Trading involves significant risk, and proper risk management is essential.

16/9/68 : XAUUSD ( US Session )Using it from US Session until 11.00AM , I'll new analysis and update at 12.00PM
Resistance
3719-3724
3707-3713
3702
Support
3691
3681-3686
3671-3676

GOLD New High Record Break Gold New High on the Way! 🔥
Current Price: 3635
📈 Buy Entry Active — Target 3690
✨ Gold is in full bullish control.
✨ Buyers pushing strongly toward new record highs.
✨ Market confidence remains unshaken.
✨ Every dip is being bought instantly.
✨ Strong fundamentals + technicals support upside.
✨ Next resistance is ready to be tested soon.
✨ A breakout above 3690 can open doors for even higher levels.
✨ This could be the start of another major rally.
⚡ Don’t wait — secure your position now before the breakout run begins!

Gold XAUUSD: Anticipating a Retracement for Continuation Long📊 Currently watching Gold (XAUUSD), price has been pushing aggressively higher in a strong bullish trend. However, the market is now reaching into areas of thin liquidity, appearing somewhat overextended.
🔎 I’m anticipating a potential retracement toward the 50% equilibrium level of the previous price swing. Within an ongoing uptrend, the Fibonacci 61.8% retracement often acts as a prime entry zone 🏹 for continuation trades.
⚖️ If price pulls back and establishes support, followed by a bullish break of market structure, that would provide a high-probability opportunity. If the setup fails to materialize, then there’s simply no trade — patience is key.
⚠️ Disclaimer: This is educational analysis only and not financial advice. Always manage risk appropriately.

Gold's new round of upward momentum continuesGold ushered in another new round of rallies. In the early, the price slightly touched 3674, but now rebound to around 3687. For the trend, an upward move is highly likely. As we mentioned earlier, the resistance at 3700 remains, and the current upward move is a result of traders' early bets on interest rate cuts. Maybe it’s just a matter of whether the 3700 is broken today or tomorrow. However, it’s not advisable to be too aggressive in trading operations. For the downside, we can temporarily focus on the support at 3660, which is the starting point of the accelerated upward move. We can buy when the price pulls back to this level; if the pullback doesn’t present, it’s better to wait and see for now
Buy 3660 - 3670
TP 3680 - 3690 - 3700
Daily-updated accurate signals are at your disposal. If you run into any problems while trading, these signals serve as a reliable reference—don’t hesitate to use them! I truly hope they bring you significant assistance

16/9/68 : XAUUSD ( Europe / London Session )Using it from Europe Session until 7.00PM , I'll new analysis and update at 8.00PM
Resistance
3705-3710
3695-3700
3690
Support
3679
3668-3673
3657-3663

GOLD Bullish Wedge!
HI,Traders !
#GOLD is trading in an
Uptrend and formed
A Bullish Falling wedge and
Now we are seeing a bullish
Breakout from the wedge so
We are bullish biased and we
Will be expecting a further
Bullish move up !
Comment and subscribe to help us grow !

Expecting XAUUSD sell @ 3661.5I am Expecting XAUUSD sell @ 3661.5 till 3646 area where the retracement of H4 FVG is available with a stoploss of 3667

Gold Trade Set Up Sep 15 2025www.tradingview.com
Gold is currently in a range and had tested a 15m OB so if we can get a bearish reaction and a BOS on the 5m i will look for sells but if price closes above the key zone on the 15m i will look for a retest to a bullish 5m OB/FVG to target BSL

15/9/68 : XAUUSD ( US Session )Using it from US Session until 11.00AM , I'll new analysis and update at 12.00PM
Resistance
3664-3669
3653-3658
3648
Support
3638
3627-3633
3617-3622

15/9/68 : XAUUSD ( Europe / London Session )Using it from Europe Session until 7.00PM , I'll new analysis and update at 8.00PM
Resistance
3666-3671
3656-3661
3651
Support
3641
3631-3636
3620-3626

Gold (XAU/USD) Forex SignalGold (XAU/USD) has been showing strong bullish momentum recently, but the latest Zig Zag pattern and RSI (Relative Strength Index) suggest a potential correction in the short term. Let’s analyze and provide a clear forex trading signal.
Market Overview
| Pair | Gold (XAU/USD) |
| -------------- | ------------------------------- |
| Current Price | \$3,680.7 |
| Trend | Bullish with minor pullback |
| Key Indicators | Zig Zag (5,10), RSI (14, close) |
| Volatility | High |
| Market Session | US Session |
Technical Analysis
Zig Zag Indicator: The last leg shows a peak around **\$3,679.3** followed by a small correction, signaling possible short-term weakness.
RSI (14): Currently near the **55 level**, coming down from overbought territory (>70). This indicates the bullish rally may be slowing, and sellers could test the downside.
Support Levels: \$3,650 – \$3,620
Resistance Levels: \$3,720 – \$3,750
Gold Trading Signal (September 14, 2025)
| Signal Type | Sell (Short-term) |
| ------------- | --------------------- |
| Entry Zone | \$3,680 – \$3,690 |
| Stop Loss | \$3,720 |
| Take Profit 1 | \$3,650 |
| Take Profit 2 | \$3,620 |
Analysis: Since RSI has cooled off from overbought levels and Zig Zag shows a minor top formation, a short-term selling opportunity is expected. However, the long-term trend remains bullish, so aggressive traders may wait for dips to re-enter long positions.
Alternate Scenario
If gold breaks above \$3,720, the bearish setup becomes invalid, and bulls may drive the price toward \$3,750 – \$3,800.
FAQs on Gold Forex Signals
Q1: Is gold still a good buy in September 2025?
Yes, gold remains in a long-term uptrend, but short-term pullbacks are expected.
Q2: What is the best strategy for XAU/USD now?
Swing traders can short near resistance with tight SL, while long-term investors can buy on dips.
Q3: Which indicators are most useful for gold trading?
RSI, Zig Zag, Moving Averages, and Fibonacci retracements work well with gold volatility.
Conclusion
Gold (XAU/USD) is consolidating after a strong bullish move. Short-term traders can look for sell opportunities near \$3,680 with targets at \$3,650 – \$3,620, while long-term traders should stay bullish and buy dips.

XAUUSD/GOLD Daily Sell Projection (13.09.25)📌 Chart Overview
Pair: XAUUSD / Gold Spot vs USD
Timeframe: Daily (1D)
Projection: Sell Setup
🔹 Key Technical Zones
Major Resistance Zone
Around 3,696 – 3,680 level.
Confluence with trendline resistance.
Resistance Levels
R1: Near 3,650.
R2: Near 3,696.
Major Support Levels
S1: ~3,600.
S2: ~3,579 – 3,580.
🔹 Bearish Signals
Price has touched major resistance & trendline (marked “OBEY”).
Increase in seller dominance (demonetization of buyers visible).
Shooting Star candle pattern at resistance → indicates possible reversal.
🔹 Trade Idea
Entry: Near resistance rejection (3,680–3,696 zone).
Target: Towards 3,600 – 3,579 supports.
Stop Loss: Above major resistance / 3,696 zone.
Bias: Short-term sell projection while price respects resistance.
🔹 Special Note
Marked OBEY FVG zone (Fair Value Gap) → indicates that price is likely to fall into that area but won’t break below 3,579 support strongly unless fundamentals shift.
Overall bias: Sell from resistance, book profits at support

XAUUSD Trading Recap and RecommendationYesterday, we successfully went long at a low level, entering the market within the 3,600-3,620 range. Today, when the price moved up to 3,650, we executed the TP as planned and secured profits smoothly.
Today's Trading Advice: Buy on Pullbacks
Buy 3630 - 3640
TP 3650 - 3660 - 3670
Daily-updated accurate signals are at your disposal. If you run into any problems while trading, these signals serve as a reliable reference—don’t hesitate to use them! I truly hope they bring you significant assistance

Gold Trade Set Up Sep 12 2025www.tradingview.com
Gold is making HH/HL on the 1h but is trading in between two key levels, so i want to see a break close and retest of into a OB or supply/demand to get a clear direction

12/9/68 : XAUUSD ( US Session )Using it from US Session until 11.00AM , I'll new analysis and update at 12.00PM
Resistance
3667-3672
3657-3662
3652
Support
3641
3631-3636
3620-3626
