12/9/68 : XAUUSD ( Europe / London Session )Using it from Europe Session until 7.00PM , I'll new analysis and update at 8.00PM
Resistance
3676-3681
3666-3671
3661
Support
3650
3640-3645
3630-3635
Xauusdsetup

Gold Bulls Eye Fresh Highs Amid Fed Cut Bets 📊 Technical Structure
Gold (XAU/USD) is attempting to reclaim upside momentum after bouncing from the $3,632–$3,636 support zone. Price broke above the descending trendline, signalling potential bullish continuation if sustained above the support. Key resistance lies at $3,655–$3,658, aligning with prior rejection levels.
🎯 Trade Setup
Entry: $3,633–$3,636 (Support retest zone)
Stop Loss: $3,632
Take Profit: $3,655 / $3,658
Risk-Reward Ratio (R:R): ~1 : 4.95
🌍 Macro Background
Gold edged lower to $3,630 earlier in the Asian session as profit-taking and a stronger USD weighed on the metal. However, Fed rate cut expectations remain strong, with markets fully pricing in a 25bps cut in September and Barclays projecting three consecutive cuts by year-end. Meanwhile, geopolitical tensions continue to underpin safe-haven demand — Poland intercepting Russian drones and Israel’s strike on Doha highlight rising risks. This backdrop suggests dips could remain well-supported as traders await the University of Michigan Consumer Sentiment Index for further cues.
🔑 Key Technical Levels
Resistance: $3,655 / $3,658
Support: $3,633 / $3,636
Major Support Zone: $3,620
📝 Trade Summary
Gold remains underpinned by Fed easing expectations and geopolitical risks despite short-term profit-taking. The break above the trendline favours buying dips, with upside potential toward $3,655–$3,658. However, failure to hold $3,632 may trigger a retest of $3,620.
⚠️ Disclaimer
This analysis is for reference only and does not constitute trading advice. Trading involves significant risk, and proper risk management is essential.

Gold Trade Set Up Sep 11 2025OANDA:XAUUSD
www.tradingview.com
Price pushed up due to CPI news at 8:30 touched 30m supply and is still making LH on 1h and 15m so i will look for internal structure on the 5m to take sells down towards 4h FVG

GOLD Very Bullish , Can We Buy Again And Get 200 Pips ?Here is My 15 Mins Gold Chart , and here is my opinion , we finally above 3639.00 and we have a 4H Candle closure above it and we have a Perfect Breakout and this give us a very good confirmation ,and also we have a reversal pattern and the price closed above neckline , so we have a good confirmation now to can buy from 3639.00 when the price back to retest it , we need the price to go back and retest it and give us a good bullish price action and then we can enter , we can targeting 100 to 200 pips . if we have a daily closure below this area this mean this idea will not be valid anymore .
Reasons To Enter :
1- Perfect Touch For The Area .
2- Clear Bullish Price Action .
3- Bigger T.F Giving Good Bullish P.A .
4- The Price Take The Last High .
5- Perfect 15 Mins Closure .
6- Reversal Pattern .

Gold on the Edge: Risk-On Mood Pressures Bulls Ahead of CPI🔎 Technical Structure
Gold (XAU/USD) is consolidating between $3,624 minor support and $3,644 major resistance. The chart shows two possible pathways:
Bullish scenario: A breakout above $3,640–$3,642 resistance zone may trigger momentum toward $3,660–$3,672.
Bearish scenario: Failure to hold $3,624 support could lead to a sharper drop toward the broader $3,600–$3,598 support zone.
🎯 Trade Setup
Entry (Long): Above $3,642 on breakout confirmation
Stop Loss: Below $3,640
Take Profit: $3,660–$3,672
Entry (Short): On rejection at $3,630–$3,633 or a clean break below $3,624
Stop Loss: Above $3,633
Take Profit: $3,600–$3,598
🌍 Macro Background
Gold price action is highly sensitive ahead of the U.S. CPI release. A softer print could reinforce Fed rate cut bets, weaken the dollar, and fuel upside for gold. Conversely, hotter-than-expected CPI may push the USD higher and pressure bullion lower. Geopolitical tensions (Poland drone incident, Middle East escalation) remain supportive for safe-haven demand, limiting downside risk.
📌 Key Technical Levels
Resistance: $3,640 / $3,642
Support: $3,624 / $3,600
📝 Trade Summary
Gold sits at a pivotal zone, awaiting a CPI-driven breakout. Bulls need to reclaim $3,642–$3,644 to push higher, while bears will aim to break $3,624 to extend the correction.
⚠️ Disclaimer
This analysis is for reference only and does not constitute trading advice. Trading involves significant risk, and proper risk management is essential.

9/11: Double Top Pattern, Bearish OutlookGood afternoon, everyone!
Yesterday, the market showed limited volatility, with prices capped around 3343–3358, failing to break through, which delayed the expected downward cycle.
Today, the trend looks clearer:
A double-top pattern has formed;
Price tested the 23 support for the first time and rebounded slightly;
Key resistance levels are 32–37, followed by 41;
If the rebound fails to break resistance, the 23 support is very likely to be broken;
Main supports to watch are 3610 (2H chart) and 3578–3550 (4H chart).
🔹 Trading Strategy
Focus on short positions;
Try quick long trades near support, but avoid being greedy;
If rebounds fail at resistance, shorts may accelerate, so risk is relatively high.

11/9/68 : XAUUSD ( Europe / London Session )Using it from Europe Session until 7.00PM , I'll new analysis and update at 8.00PM
Resistance
3651-3656
3641-3646
3636
Support
3625
3615-3620
3605-3610

Gold Bulls vs Bears! Who Will Win the $XAUUSD Battle?🏆 "The Golden Layer Cake Strategy" - XAU/USD Bullish Swing Plan 🎯
✨ Calling all savvy traders! ✨
Ready to layer into a potential Gold breakout? This systematic approach is designed to capitalize on bullish momentum while managing risk through strategic entry layers.
Here’s the detailed blueprint: 📜
🔑 Key Details:
Asset: XAU/USD (Gold)
Bias: Bullish
Style: Swing Trading / Position Building
Strategy: Multi-Layer Limit Order Entry
⚡ Entry Strategy (The Layering Method):
To optimize your average entry price, consider using multiple BUY LIMIT orders at key support levels:
Layer 1: 3420.00
Layer 2: 3440.00
Layer 3: 3460.00
Layer 4: 3480.00
You can adjust the number of layers and prices based on your personal risk management and market conditions.
🛑 Stop Loss:
A conservative stop loss can be placed below a significant support zone at 3370.00.
Disclaimer: Always adjust your stop loss based on your individual risk tolerance, account size, and trading strategy.
🎯 Take Profit:
We are targeting a strong resistance zone around 3600.00. A more ambitious target sits at 3650.00 for those who wish to trail their stops. Secure profits on the way up!
📊 Market Context & Rationale:
This plan is based on identifying potential value areas on the pullback for a continued bullish move. The layered entry allows us to build a position gracefully without chasing the market.
📊 XAU/USD Real-Time Data Report
🤝 Retail & Institutional Sentiment
Retail Traders
Long (Bullish): 28% 😊
Short (Bearish): 72% 😟
Institutional Traders
Bullish positions increasing, showing confidence in gold as a safe-haven asset. 🏦
😨💸 Fear & Greed Index
Mood: Neutral → leaning Greedy
Markets expect Fed rate cuts, boosting gold demand.
🌍 Fundamental Score
Rating: 7/10 (Positive)
Key Drivers:
Weakening US Dollar from expected Fed cuts 📉
Geopolitical tensions supporting safe-haven demand ⚠️
Ongoing central bank gold buying 🏦
📈 Macro Score
Rating: 6.5/10 (Moderately Bullish)
Factors:
High probability of US rate cut in September (~85%) 📅
Rising bond yields may cap gains 📈
Global economic uncertainty 🌎
🐂🐻 Overall Market Outlook
Bias: Bullish (Long) 🚀
Gold remains in a strong uptrend, supported by fundamentals, macro drivers, and institutional flows.
✨ Summary
Gold is bullish 📈 with strong support from fundamentals and macro conditions. Retail traders lean bearish 😟, but institutions and sentiment favor upward momentum. Any dips are seen as buying opportunities 🤑
⚠️ Risk Warning & Disclaimer:
This is not financial advice. Always do your own research (DYOR).
High-impact news events can cause increased volatility—manage your risk accordingly.
Past performance is not indicative of future results.
Only risk capital you are willing to lose.

Gold Price Forecast: XAU/USD Eyes $3,650 Ahead of CPI 📊 Technical Structure
Gold (XAU/USD) may rebound from the support zone $3,627–3,630, and buyers are gradually regaining control. Price action now challenges the resistance zone $3,642–3,647, with a breakout paving the way toward $3,650+.
🎯 Trade Setup (15M Chart)
Entry (Long): $3,630–$3,627
Stop Loss: $3,625
Take Profit: $3,642 / $3,645
🌐 Macro Background
Gold stays supported by Fed rate cut bets, a weaker USD, and geopolitical tensions. US August PPI came in softer, reinforcing rate cut expectations ahead of Thursday’s CPI release (forecast 2.9% headline / 3.1% core). Meanwhile, safe-haven demand is lifted by Poland shooting down Russian drones and Israel’s Doha strikes. While event risk remains, the broader backdrop continues to favour gold upside momentum.
🔑 Key Technical Levels
Resistance: $3,642 / $3,645 / $3,650
Support: $3,630 / $3,627
📌 Trade Summary
Gold maintains bullish traction above $3,630, with scope for a move toward $3,642–$3,645, though traders should stay cautious ahead of US CPI.
⚠️ Disclaimer
This analysis is for reference only and does not constitute trading advice. Trading involves significant risk, and proper risk management is essential.

XAU/USD – Liquidity Grab Before Downside MovePrice action is currently showing signs of a retracement to the upside, aiming to grab excess liquidity and balance out the order flow.
📍 Point of Entry:
I expect price to push higher into the marked liquidity area before rejecting. This move will serve as an equilibrium adjustment, allowing institutions to collect orders before driving the market lower.
📉 Downside Targets:
After the liquidity grab, price is likely to continue its bearish leg, moving down into the support zone highlighted in blue. This zone aligns with the 4H Fair Value Gap (FVG), which will serve as a key area for a retest.
🔑 Key Outlook:
Retracement upward → Liquidity sweep.
Continuation downward → Support zone & 4H FVG retest.
Further breakdown possible if support fails.
Follow for more.
Greetings,
MrYounity

Gold Price Analysis (XAU/USD): Key Levels and Market OutlookThe price of Gold (XAU/USD) has shown strong upward momentum in recent sessions, crossing above the $3,600 mark and briefly touching the $3,674 level, which represents a strong bullish push supported by significant trading volume (over 581K at that peak).
Current Market Overview
Current Price: $3,646.74 (as of the latest 4H candle)
Resistance Level: $3,674 (recent swing high)
Support Level: $3,640 (recent pullback low)
RSI Indicator: Around mid-range (60), showing neither overbought nor oversold conditions.
The Zig Zag indicator highlights the recent correction after reaching $3,674, where the price retraced slightly to $3,640 before consolidating. The market now trades sideways between these two levels, indicating a short-term indecision.
1. Resistance Zone:
Gold needs to break and sustain above $3,674 to confirm the continuation of the bullish trend. If this happens, the next target could be around $3,700 – $3,750.
2. Support Zone:
On the downside, if the price fails to hold the $3,640 level, a deeper correction towards $3,600 – $3,550 cannot be ruled out.
3. Momentum Indicators:
The RSI is currently neutral, suggesting room for both upside and downside moves. Traders should watch for RSI crossing above 70 (bullish continuation) or dropping below 50 (bearish pressure).
Trading Strategy
Bullish Bias: If Gold holds above $3,640 and breaks $3,674, traders may look for long positions targeting $3,700 and above.
Bearish Bias: A break below $3,640 could trigger short positions, with downside targets near $3,600 and $3,550.
Conclusion
Gold remains in a bullish structure but faces short-term resistance at $3,674. Traders should watch closely for a breakout or breakdown from this consolidation range to determine the next major move.

Gold Trade Set Up Sep 10 2025OANDA:XAUUSD
www.tradingview.com
Price is currently making LH/LL on the 1h so id want to see how price reacts at the current key level. If it hold and can make internal structure on the 5m i will look for buys back to PDH but if price closes under the key level on the 15m and retest it i will look for sells towards 4h FVG

10/9/68 : XAUUSD ( Europe / London Session )Using it from Europe Session until 7.00PM , I'll new analysis and update at 8.00PM
Resistance
3664-3669
3654-3659
3649
Support
3638
3628-3633
3617-3622

9/10: Watch Support Around 3600Good morning everyone!
🔹 Key Support Levels
30M Chart: 3628 / 3614–3600
1H Chart: 3623 / 3608–3598
2H Chart: 3623 / 3589
4H Chart: 3606
1D Chart: 3598
🔹 Key Resistance Levels
3643 / 3668–3678
🔹 Intraday Strategy
Sell on rallies, buy on pullbacks at support
Yesterday, bullish data drove gold up to around 3673 before retreating. Technically, the market is now heavily overbought, but strong fundamentals keep fueling bullish sentiment. While chasing profits, don’t overlook the risks!
Today, focus on 3643–3658 resistance. If price fails to hold above, a pullback is likely. Key supports are at 3600, then 3589–3574 / 3558.

GOLD: Bulls Continue To Bully Their Way ThroughI'm looking for a dip to buy...
(H4)
Gold has extended higher and is now trading firmly inside the 3630–3645 area.
Structure remains bullish, but price is reaching into premium levels so we could get a pull back.
Buyside liquidity sits around 3650
(H1)
A strong push from 3585 to 3634 left some imbalance behind:
3610–3618 FVG (fresh demand)
3588–3595 (deeper OB if price pulls back more aggressively)
(M15)
Bullish but candles at 3634 are showing some exhaustion.
Liquidity has been swept at 3630–3635, so we may see a correction to fill imbalances before continuation.
As long as price holds above 3610, bulls are still in control.

Can gold continue to rise? Where are the opportunities?Gold prices continued their upward trend yesterday, rising without a pullback. We missed out on this rally. While regretful, I have no regrets. At times like these, we must remain cautious.
The price of gold is now at a record high. Without the previous top position as a reference, it is difficult to judge from where it will pull back, so we would rather do nothing than make mistakes.
Of course, if a good trading opportunity arises, we must seize it.
Looking at the trend range on the 1-hour chart, we are currently trading above the range. Therefore, my advice is not to chase the rally; it's best to wait for a correction and stabilization before entering the market.
3630 is today's low, and 3640 is yesterday's high. Therefore, we can wait for gold prices to retest the 3630-3640 range. If it stabilizes, we can enter the market. Otherwise, if it breaks, we'll look to the 3600 mark.

9/9/68 : XAUUSD ( Europe / London Session )Using it from Europe Session until 7.00PM , I'll new analysis and update at 8.00PM
Resistance
3675-3680
3665-3670
3660
Support
3649
3638-3643
3628-3633

Gold - Intraday Long Setup (5M TF) | Smart Money + Elliott Struc# 🟢 Gold - Intraday Long Setup (5M TF) | Smart Money + Elliott Structure
**Pair:** Gold Spot / USD
**Timeframe:** 5M
**Session:** London / NY Overlap
**Type:** Intraday Long Idea
**Concepts:** Smart Money, Supply & Demand, Wave Analysis, SSL Confirmation
---
## 🔍 Market Context
The market is currently reacting inside a **key Demand Zone** on the 5-minute timeframe, following a strong bearish move during the London session. The structure suggests a corrective **ABC wave formation**, where the **(c) point** appears to be forming a potential higher low at demand.
- Point **(a)**: Marked the first impulse down
- Point **(b)**: Rejection at minor **Supply Zone**
- Point **(c)**: Retest of **POI at Demand**, showing signs of exhaustion in selling pressure
---
## 📈 Technical Confluences
- 🟦 **Demand Zone** active and respected
- 📏 Potential BOS (Break of Structure) upon break of the recent high
- 📊 **Vol %ile** = 83% → Above average participation
- ⚠️ Risk Level: High (tight structure, requires confirmation)
- 🧭 Entry Distance: Near
---
## 🔧 Indicators Status (SSL Hybrid)
| Indicator | Status |
|--------------------------|----------|
| SSL Channel | ✅ Bullish cross (supporting reversal)
| RSI (50) | ✅ Holding above midpoint
| MACD | ✅ Bullish crossover (early signal)
| BB Oscillator / HT / RQK | ❌ Still bearish (lagging)
---
## 🎯 Trade Idea
**Bias:** Long
**Trigger:** Break above **minor Supply** and formation of BOS
**Target Zones:**
1. **TP1:** 3,370
2. **TP2:** 3,378 (supply edge)
3. **TP3:** 3,385 (upper supply zone)
**SL:** Below point (c) @ **~3,357**
---
## 🧠 Notes
This setup is valid as long as price holds above the Demand Zone and confirms a bullish shift via BOS. Wait for clear confirmation before entering.
_This is an educational idea based on Smart Money + Elliott Wave principles – not financial advice._
---
#gold #smartmoney #supplydemand #elliottwave #sslhybrid #intraday #5mtf #tradingview

Gold still in bullish move Gold (XAUUSD) is trading around 3581, holding above the support trendline and new support area. Price recently reached the all-time high zone at 3611 and remains bullish while above 3531 support, with potential for further upside.

Gold Trade Set Up Sep 8 2025OANDA:XAUUSD
www.tradingview.com
Price broke structure on the 15m then came down and formed MSS, came higher and formed a rejection block, tested 50% of the RB now im targeting equal lows/low range liquidity
But on the higher time frames we are still bullish so i want to see a pull back before going higher

Gold can continue to rise if it retraces support levelGold has been hitting new highs recently, primarily driven by expectations of a Federal Reserve rate cut and risk aversion stemming from tariffs and the US economic outlook.
Last Friday, the unexpected NFP data pushed gold prices above the 3,600 mark.
Overall, we still underestimated the upward potential of gold and the impact of multiple data that are bullish for gold.
Because of the surprise of NFP data, the market is now evaluating whether the interest rate cut in September will be 25 basis points or 50 basis points, which will inevitably intensify the bullish sentiment. Therefore, in terms of strategy, we are mainly long, and the pullback support is an opportunity.
Gold re-entered the 3,600 level at the open today, trading around 3,620. Next, we will focus on two key levels: 3,600 and 3,580.
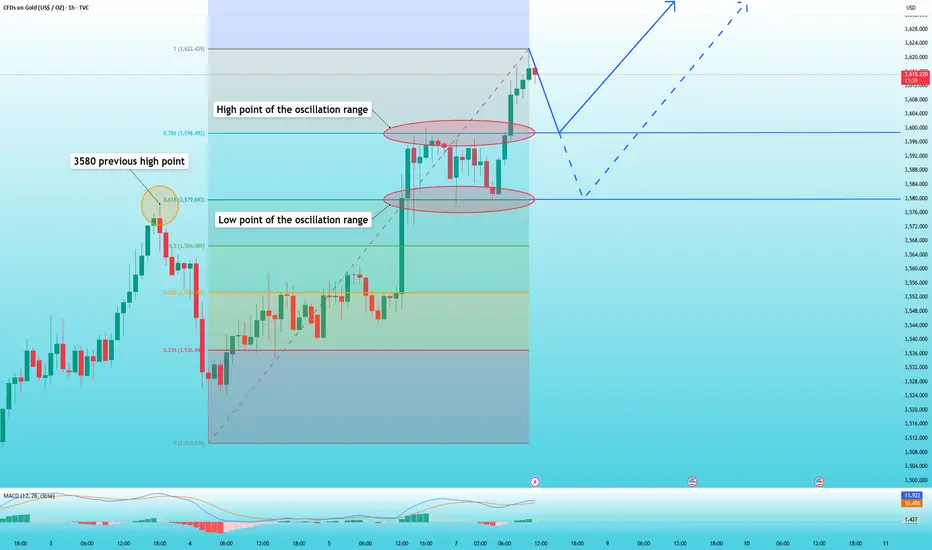
The Fibonacci retracement of the 3,510-3,622 uptrend shows that 3,600 is at 0.786, while 3,580 is at 0.618, both of which represent previous highs and support levels. Therefore, as long as it falls back to these two positions and stabilizes today, you can enter the market and go long on gold.
However, remember one thing, once it falls below 3580, don't go long.
XAUUSD, EXPECTING SELL NOW FROM 3617XAUUSD, i am expecting sell from 3617 area, with the sl 36254. tp 3600, it can go till 3685 as well

9/8: Watch Resistance at 3594–3600, Support at 3560–3556Good morning everyone!
🔹 Key Support Levels
30M Chart: 3573–3562
1H Chart: 3571 / 3563–3556
2H Chart: 3573 / 3560–3556 / 3528
1D Chart: 3564 / 3507–3498
🔹 Key Resistance Levels
3594–3600 / 3608–3621
🔹 Intraday Trading Strategy
Sell on rallies; consider buying on pullbacks to support.
Last week, gold extended its upward trend, testing the 3600 area for the first time, supported by NFP data. Overall performance was moderate. The main reason was a conservative approach — focusing more on selling at resistance while cautiously buying on dips, which resulted in missing two major rallies. The profits captured from retracements were relatively small compared to the strong upward moves.
The current rally has been driven largely by expectations of a Fed rate cut. However, this bullish factor now appears to be largely priced in, with gold technically in overbought territory. In the short term, risk management is crucial: avoid chasing prices at historical highs. A safer strategy remains buying on pullbacks, which may be less aggressive but significantly reduces downside risks. Ultimately, the choice of strategy depends on individual trading styles.
