GOLD Very Bullish , Can We Buy Again And Get 200 Pips ?Here is My 15 Mins Gold Chart , and here is my opinion , we finally above 3400.00 and we have a 4H Candle closure above it and we have a Perfect Breakout and this give us a very good confirmation , so we have a good confirmation now to can buy from 3400.00when the price back to retest it , we need the price to go back and retest it and give us a good bullish price action and then we can enter , we can targeting 100 to 200 pips . if we have a daily closure below this area this mean this idea will not be valid anymore .
Reasons To Enter :
1- Perfect Touch For The Area .
2- Clear Bullish Price Action .
3- Bigger T.F Giving Good Bullish P.A .
4- The Price Take The Last High .
5- Perfect 15 Mins Closure .
Xauusdsetup

XAUUSD 15m – EW Short SetupHi fellow traders,
On the 15m XAUUSD chart, I am applying Elliott Wave principles to capture a potential short move. Price action is unfolding within an ending diagonal pattern, and I am anticipating the final leg down as wave (v).
Additional confluence is provided by the red-shaded supply zone, which coincides with the projected entry area and strengthens the probability of a reversal at this level.
I am entering at 3335.37, with a Stop Loss at 3345.30 serving as the invalidation level. My Take Profit is set at 3307.64, targeting the next key support area.
Good luck and trade safe.

XAUUSD 1H – EW Bearish Scenario Hi fellow traders,
On the 1h XAUUSD chart, I am applying Elliott Wave principles to outline a potential expanding flat scenario, forming either as an X-wave or a B-wave. If this count holds, I expect another leg to the downside before the larger structure completes.
The red-shaded supply zone provides a potential rejection area, while the blue-shaded demand zone below marks where price could stabilize. Most importantly, the golden box beneath remains untested, aligning with my expectation that price will revisit this key support zone before a stronger reversal.
For this setup, my entry is positioned around the supply zone, with a Take Profit aimed at the golden box below. The Stop Loss is placed at the invalidation level, meaning the trade idea is no longer valid if price breaks above this structure.
Although the broader sentiment may lean bullish, this bearish scenario remains technically supported by Elliott Wave structure and confluence levels.
Good luck and trade safe.

Gold Trade Set up Aug 28 2025OANDA:XAUUSD
www.tradingview.com
price is making HH/HL on the daily 4h and 1h time frames so overall im bullish. There is a 1h FVG formed and HL acting as SSl that is being tested, so if price closes above HL i will look for internal structure on the 5m to target BSL around 3409 but if price closes under HL it can come to test lower SSL around 3385 before continuing up

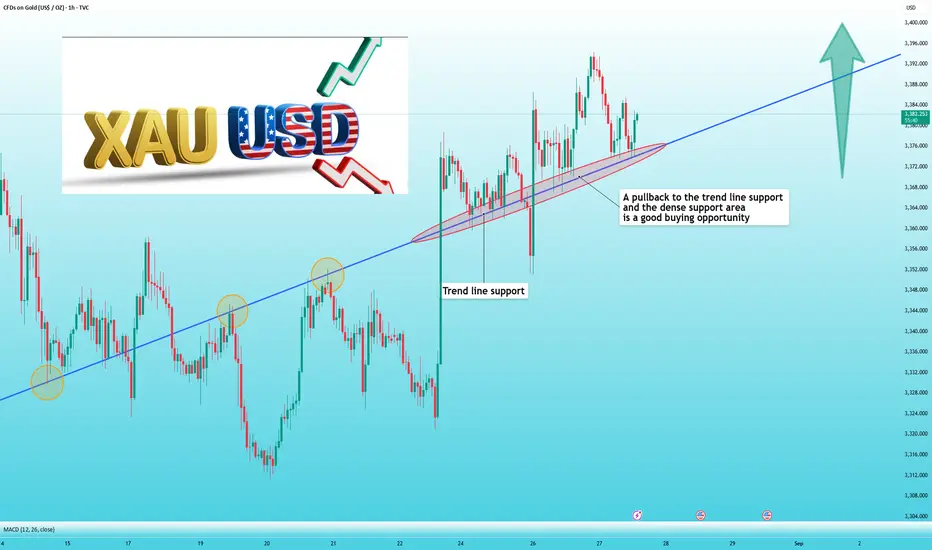
The gold rally is not over yet, stabilizing at 3400 is the keyThis week, Trump once again severely undermined the independence of the Federal Reserve. He has been attacking Chairman Powell for months and now threatens to fire Fed Governor Tim Cook. His actions are all part of his quest to pressure the Fed into cutting interest rates, ultimately forcing his will and ultimately achieving a rate cut, perhaps even a larger one.
Influenced by the Fed's independence and the expectation of rate cuts, gold prices have continued to rise this week, approaching the high of 3,400 points.
I personally believe that as long as gold doesn't fall below 3,350, it's only a matter of time before it breaks above 3,400.
From the 1-hour chart, we can clearly see that gold is steadily rising, supported by the trend line. Buying on a pullback to the trend line is a good opportunity, with a take-profit and stop-loss in place, presents a significant profit opportunity.
Currently, the optimal buying range for gold is between 3,365 and 3,375 OANDA:XAUUSD , with a target price of $10-20 and a stop-loss of $10.
📣If you have different opinions, please leave a message below to discuss
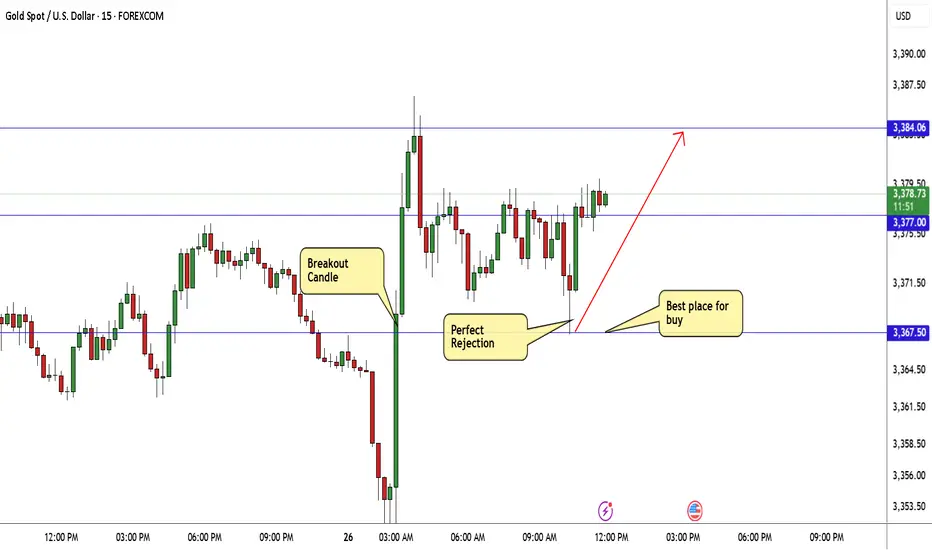
GOLD Still Very Bullish , 2 Chances To Buy And Get 200 Pips !Here is My 15 Mins Gold Chart , and here is my opinion , we finally above 3377.00 and we Still Not have a 4H Candle closure above it but we have a Perfect Breakout and this give us a very good confirmation , so we have a good confirmation now to can buy from 2 places , first one and best one for me will be 3377.00 , we need the price to go back and retest it and give us a good bullish price action and then we can enter , or if you a aggressive trader you can enter from 3381.00 cuz we have a small double bottom reversal pattern so we can enter from neckline also . we can targeting 100 to 200 pips . if we have a daily closure below this area this mean this idea will not be valid anymore .
Reasons To Enter :
1- Perfect Touch For The Area .
2- Clear Bullish Price Action .
3- Bigger T.F Giving Good Bullish P.A .
4- The Price Take The Last High .
5- Perfect 15 Mins Closure .
6- Small Reversal Pattern .

Gold (XAU/USD) 28 August 2025Gold continues to consolidate within a high-volatility environment, with price testing key liquidity pools and approaching unmitigated supply/demand levels. Today’s analysis blends Daily macro bias, 4H swing structure, and 1H execution refinement to identify the most reliable zones for institutional-grade entries.
🔵 Demand Zones (Buy Setups)
Primary Buy Zone: $3360 – $3370
This is today’s highest-probability demand area.
Daily: Bullish structure intact with higher-highs and higher-lows.
4H: Fresh bullish Order Block formed after a strong BOS (Break of Structure).
1H: Liquidity sweep below recent lows at 3372, providing a refined entry trigger.
Indicators: RSI recovery from oversold divergence; MACD showing momentum reversal.
Volume: Absorption at 3365 confirms buyer presence.
Execution Plan:
SL: 3350 (structure invalidation)
TP1: 3405
TP2: 3425
Secondary Buy Zone: $3325 – $3335
Daily: Nested demand block aligning with prior bullish BOS.
4H: Deep discount zone of previous swing.
1H: ICT displacement candle originated at 3330, unmitigated.
Execution Plan:
SL: 3310
TP1: 3365
TP2: 3400
🔴 Supply Zones (Sell Setups)
Primary Sell Zone: $3420 – $3430
This is the nearest high-probability supply area.
Daily: Strong resistance shelf; unmitigated supply.
4H: Bearish OB after displacement down from 3428.
1H: Liquidity pool resting above 3415 equal highs.
Indicators: Bearish RSI divergence; MACD momentum fading.
Execution Plan:
SL: 3440
TP1: 3390
TP2: 3365
Secondary Sell Zone: $3455 – $3465
Daily: Weekly supply nested in premium pricing.
4H: Swing-high liquidity at 3460 remains untested.
1H: Inefficient wick zone above equilibrium.
Indicators: RSI extreme overbought; ATR volatility ceiling.
Execution Plan:
SL: 3475
TP1: 3430
TP2: 3400
⭐ Executive Summary – Golden Zone
The Primary Buy Zone at $3360 – $3370 stands out as today’s Golden Zone:
Backed by 6 institutional confluences across Daily, 4H, and 1H.
Well-defined risk with SL at 3350.
Reward asymmetry toward TP1 at 3405 and TP2 at 3425.
This zone offers the cleanest risk-to-reward profile, aligning macro structure with intraday liquidity positioning.
⚖️ Final Note
As always, zones are execution frameworks, not blind signals. Wait for confirmation on 1H/15M displacement and liquidity sweeps before entering. Managing risk with precision is crucial given Gold’s current volatility and ATR expansion.

Gold Trade Set Up Aug 27 2025OANDA:XAUUSD
www.tradingview.com
In asai session gold swept PDH and in london session gold made LH/LL so for sells i will want to test LH and close below then make internal structure to go lower towards SSL. But if price closes above LH i will look for a continuation higher to BSL

Gold (XAU/USD) 27 August 2025Gold continues to trade in a well-defined structure, with buyers defending higher-lows while sellers attempt to cap upside momentum near the $3400 handle. Today’s analysis blends the Daily → 4H → 1H confluences to outline execution-ready trading zones with clear invalidation and profit objectives.
🔵 Demand Zones – Where Buyers Are Positioned
📍 Primary Buy Zone: $3368 – $3373
This zone carries the strongest institutional weight for the day:
Daily higher-low structure remains intact above $3365.
4H bullish order block + fresh BOS confirmation.
ICT’s Optimal Trade Entry discount (0.618–0.705 retracement).
RSI bullish divergence on 1H; MACD slope turning positive.
Strong absorption wick confirmed at $3370 on the last sweep.
📌 Trade Plan:
Entry: $3368 – $3373
SL: Below $3360
Targets: $3395 → $3410
📍 Secondary Buy Zone: $3350 – $3355
A deeper liquidity-driven fallback demand level:
Untested 4H demand block from breakout leg.
Daily demand base aligning with sell-side liquidity resting below $3355.
MACD crossover and ATR volatility expansion on 1H support demand.
📌 Trade Plan:
Entry: $3350 – $3355
SL: Below $3345
Targets: $3380 → $3400
🔴 Supply Zones – Where Sellers Are Positioned
📍 Primary Sell Zone: $3402 – $3408
The first line of resistance for intraday traders:
4H lower-high structure aligning with Daily resistance.
Fresh bearish order block and FVG imbalance inside zone.
RSI divergence (bearish) on both 4H & 1H timeframes.
Thin volume node above $3400 → prone to rejection.
📌 Trade Plan:
Entry: $3402 – $3408
SL: Above $3415
Targets: $3388 → $3370
📍 Secondary Sell Zone: $3420 – $3426
A liquidity sweep zone with higher timeframe supply:
Daily supply block remains unmitigated.
Buy-side liquidity pool resting above $3420.
ATR extension = capped intraday volatility.
VWAP overextension favors mean reversion.
📌 Trade Plan:
Entry: $3420 – $3426
SL: Above $3435
Targets: $3400 → $3385
🟡 Executive Summary – The Golden Zone
Today’s Golden Zone is the Primary Buy Zone ($3368 – $3373).
It aligns across Daily (higher-low support), 4H (fresh bullish OB), and 1H (execution refinement). Backed by 6+ confluences, this zone offers the highest-probability continuation trade, targeting the $3410 region.
✅ Bias: Maintain bullish stance above $3365. Look for dip buys around $3368–$3373, while fading exhaustion only at defined sell zones above $3402.

Gold (XAUUSD) Set to Hit Resistance | Sell on Rise SetupGold (XAUUSD) is approaching a critical resistance zone between 3492 and 3494, where sellers have previously stepped in to push prices lower. We anticipate a similar reaction this time, presenting an opportunity to enter a short position on any upward move into this prime supply area.
🔻 Short Trade Setup – Fade the Rally
Entry: Sell Gold (XAUUSD) at 3392
Add-On: Sell more Gold (XAUUSD) if price rises to 3399
Targets: Refer to chart for detailed target zones
Invalidation: If daily closes above 3406, consider the setup invalid
📉 Risk-Reward Profile
This setup offers an attractive risk-reward ratio, particularly for short-term traders looking to capitalize on a potential rejection at resistance. Maintain tight stops and disciplined position sizing to manage risk effectively.
Gold (XAUUSD) has enjoyed a strong rally, but the odds now appear to favor a pullback. Watch price action and momentum closely within the resistance zone for confirmation.
👍 If you find this idea useful, please like and share your thoughts in the comments. Let’s build a community of sharp traders sharing insights!
🔔 Follow for more high-probability trade setups and market analysis.
Happy Trading,
– The InvestPro Team

Gold Approaching Key Resistance | Sell-on-Rise Opportunity AheadGold (XAUUSD) is expected to face strong resistance between 3485 and 3492 — a prime zone where fresh sellers could step in and trigger a downside move. We're eyeing profit opportunities with a sell-on-rise setup.
🔻 Short Trade Setup – Fading the Strength
Entry: Sell at 3386
Add on Strength: 3392
Targets: See chart for marked zones
Invalidation: Daily close above 3402
📉 Risk-Reward Outlook
This setup presents a favorable risk-reward ratio, especially for short-term traders aiming to capitalize on a potential rejection at resistance. As always, keep your risk tight and position sizing disciplined.
Gold has had its run — now the odds may favor the contrarian. Keep an eye on momentum and price action at the resistance zone.
👍 If this idea aligns with your view, give it a like and drop your thoughts in the comments — let’s exchange ideas and insights!
🔔 Follow us for more actionable trade setups.
Happy Trading,
– The InvestPro Team

27/8/68 : XAUUSD ( Europe / London Session )Using it from Europe Session until 7.00PM , I'll new analysis and update at 8.00PM
Resistance
3395-3400
3385-3390
3380
Support
3370
3359-3365
3349-3354

GOLD Local Short!
HI,Traders !
#GOLD is going up now
But will soon hit a horizontal
Resistance of 3394.70 from
Where we will be expecting a
Local pullback and we will
Be expecting a local move down !
Comment and subscribe to help us grow !

GOLD Bullish Breakout!
HI,Traders !
#GOLD made a bullish
Breakout of the falling resistance
And the breakout is confirmed
So we are bullish biased
And we will be expecting
A further bullish move up !
Comment and subscribe to help us grow !

GOLD Breakout Done , Long Setup Valid To Get 200 Pips !Here is My 15 Mins Gold Chart , and here is my opinion , we finally above 3367.50 and we have a 4H Candle closure above it And Perfect Breakout and this give us a very good confirmation , so we have a good confirmation now to can buy after the price go back to retest the broken area 3367.50 , and we can targeting 100 to 200 pips . if we have a daily closure below this area this mean this idea will not be valid anymore .
Reasons To Enter :
1- Perfect Touch For The Area .
2- Clear Bullish Price Action .
3- Bigger T.F Giving Good Bullish P.A .
4- The Price Take The Last High .
5- Perfect 15 Mins Closure .
Downtrend Broken! Watch These Liquidity Zones for Big MoveMMFLOW Trading Plan | 26 Aug 2025 ⚡️
💰Gold is gearing up for a strong move!
Gold has broken the H4 downtrend line, showing strong buying momentum and liquidity sweeps, signaling a potential bullish continuation.
⚠️Warning: wide support zones below may trigger quick pullbacks to collect liquidity.
📊Market Context
USD is weakening amid political and Fed uncertainty
Trump attempting to influence lower interest rates, supporting gold
H4 downtrend line broken → buyers in control
Short-term: expect sideways movement + liquidity tests
Watch for quick spikes – FOMO buy zones are often targeted
⚡️Key Levels
Resistance: 3378 → 3384 → 3400
Support: 3363 → 3354 → 3340
🔥Trading Scenarios
✅BUY SCALP (Quick Moves – Short-term)
🔵Entry: 3355 – 3353
🔴Stop Loss: 3349
✔️Targets: 3360 → 3365 → 3370 → 3380 → 3390 → 3400+
✅BUY ZONE (Longer Setup – Swing)
🔵Entry: 3341 – 3339
🔴Stop Loss: 3335
✔️Targets: 3345 → 3350 → 3355 → 3360 → 3365 → 3370 → 3380 → 3390 → 3400+
💠SELL SCALP (Quick Reversals)
🔵Entry: 3382 – 3384
🔴Stop Loss: 3388
✔️Targets: 3378 → 3374 → 3370 → 3365 → 3360 → 3350
💠SELL ZONE (High Risk – Big Moves)
🔵Entry: 3400 – 3402
🔴Stop Loss: 3406
✔️Targets: 3395 → 3390 → 3385 → 3380 → 3370 → 3360
⚠️Risk Notes
Expect fast drops or spikes – stops can trigger quickly
Sideways movement likely in sessions + retests of highs
Only trade when price action confirms key zones
🎯Key Takeaways
Gold is poised for strong bullish continuation, but pullbacks will occur to collect liquidity
Use support/liquidity zones for entries, resistance zones for exits
MMFLOW = Market Rule | Key Levels = Profit

Gold Trade Set Up Aug 26 2025OANDA:XAUUSD
www.tradingview.com
Gold Trade Set Up: Price swept PDH and PDL, made HH/HL and now is consolidating, so i want to see a sweep of internal liquidity on the 15m, close above it with a 5m IFVG to continue higher or a close under SSL to target lower SSL

XAUUSD: Don’t rush to chase the rise, wait for a pullback firstThis year's Jackson Hole symposium, held at a policy crossroads for the Federal Reserve over whether to cut interest rates, captivated global attention.
Powell's shift from hawkish to dovish rhetoric ignited the market, completely contradicting previous market forecasts. The US dollar subsequently fell sharply, leading to a breakout rally in gold, from $3,330 to around $3,380.
In the short term, gold prices surged strongly last Friday, with many investors chasing long positions. Therefore, we should be wary of a pullback after profit-taking. Furthermore, Powell's speech last Friday has largely been digested, and the excitement has cooled somewhat.
In the long term, gold prices will undoubtedly continue to rise. A Fed rate cut is imminent, and any reduction, regardless of the magnitude, would represent a resumption of quantitative easing. The resulting situation is foreseeable. The US dollar will continue to decline, while gold will continue to rise, potentially reaching a new all-time high of $3,500.
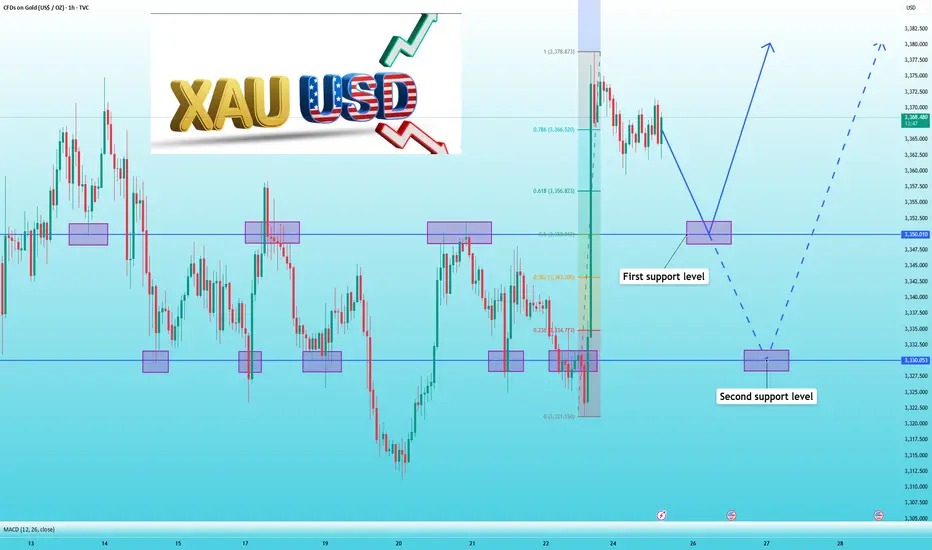
Looking at the 1-hour gold chart, 3350, which has previously failed to break through, will be the next key support level. If it holds, buy boldly. If it breaks, look for further support at 3330.
Therefore, don't rush into trading. Waiting for the right entry point will be more efficient and more stable.
Conservative Role Reversal Setup - Resistance Becomes Support
Sharing my straightforward approach to Gold's next potential move. 📊
**🎯 The Setup:**
I'm waiting for a role reversal play at the yellow line - this represents the zone where recent resistance should now act as support. Classic technical analysis at work. 🔄
**📍 Target and Risk:**
My minimum target is the second white line from the top - the August 8th high. For risk management, I'll use the August 22nd low as my stop loss, giving me a **2:1 risk-to-reward ratio**. This is a very conservative entry approach. 🛡️
**⚡ Higher R/R Alternative:**
If I wanted to improve the risk-reward ratio, I'd need to watch for real-time price action after any break below this morning's low. The key would be catching the actual reversal behavior as it happens, rather than using these wider structural levels. 📈
**🧠 Why Conservative Works:**
Sometimes the best trades aren't the flashiest ones. A 2:1 setup with clear levels and high probability might not be exciting, but it builds consistent profits over time. Risk management trumps home runs. ✅
**⚠️ Risk Management:**
Clean structural levels for both entry and exit. If the August 22nd low breaks, the role reversal thesis is invalidated and it's time to exit. 🚨
📈 **This trade setup offers a risk-to-reward ratio of 2:1.** Without including fees, the breakeven win rate for this trade would be approximately 33.33%. Knowing these figures in advance helps me avoid emotional trading. 🧠
💡 **Pro Tip**: If you often find yourself trading based on emotions, I recommend doing this type of pre-planning and quantifying your setups before execution — it can be a simple yet highly effective improvement. ✅
---
**Trading is simple.** You don't need multiple indicators or dozens of lines on your chart. A clean and simple chart often works best — it keeps your decisions consistent and reduces uncertainty. Sure, it might not look flashy, and my analysis may seem a bit "plain" compared to others… but that's how I like it. If you find this analysis useful, feel free to follow me for more updates.
---
*Disclaimer: This post is for general informational and educational purposes only. It does not constitute financial advice, investment recommendation, or a service targeting specific investors, and should not be considered illegal or restricted information in any jurisdiction.*

25/8/68 : XAUUSD ( US. Session )Using it from Europe Session until 7.00PM , I'll new analysis and update at 8.00PM
Resistance
3392-3397
3381-3386
3376
Support
3366
3356-3361
3345-3350

25/8/68 : XAUUSD ( Europe / London Session )Using it from Europe Session until 7.00PM , I'll new analysis and update at 8.00PM
Resistance
3386-3392
3376-3381
3371
Support
3360
3350-3355
3340-3345

GOLD Short From Falling Resistance!
HI,Traders !
#GOLD is rising and will soon reach a falling
Resistance line. After retesting it, we expect
a decline and a move down toward the target!
Comment and subscribe to help us grow !

22/8/68 : XAUUSD ( US. Session )Resistance
3350-3355
3340-3345
3334
Support
3323
3312-3317
3302-3307
