GOLD UPDATE: From Long TP to Short Entry - Range ContinuationGreat news! This morning's long entry is approaching our take profit target. 🎯✅
**📍 New Setup - Reversal Short:**
Now I'm looking to flip the script and go short from our long trade's take profit level. My target for this short position would be back down to this morning's entry point. 📉
**🧠 Market Psychology:**
I expect the upper resistance to hold once more, creating another leg of range-bound price action. This type of range continuation is common after strong moves - the market often needs time to consolidate before choosing its next direction. 🔄
**⚠️ Entry Validation:**
For the full entry rationale and technical setup details, make sure to check out this morning's post! The same principles apply, just in reverse. 🔄
**📊 Risk Management:**
As always, I'll be looking for that same 5:1 risk-to-reward setup. If the range breaks instead of holding, that invalidates the thesis and calls for a quick exit. 🛑
📈 **This trade setup offers a risk-to-reward ratio of 5:1.** Without including fees, the breakeven win rate for this trade would be approximately 16.67%. Knowing these figures in advance helps me avoid emotional trading. 🧠
💡 **Pro Tip**: If you often find yourself trading based on emotions, I recommend doing this type of pre-planning and quantifying your setups before execution — it can be a simple yet highly effective improvement. ✅
---
**Trading is simple.** You don't need multiple indicators or dozens of lines on your chart. A clean and simple chart often works best — it keeps your decisions consistent and reduces uncertainty. Sure, it might not look flashy, and my analysis may seem a bit "plain" compared to others… but that's how I like it. If you find this analysis useful, feel free to follow me for more updates.
---
*Disclaimer: This post is for general informational and educational purposes only. It does not constitute financial advice, investment recommendation, or a service targeting specific investors, and should not be considered illegal or restricted information in any jurisdiction.*
Xauusdsetup

GOLD For Buy , Clear Closure & Clear Confirmation,200 Pips ClearHere is My 15 Mins Gold Chart , and here is my opinion , we finally above 3345.00 and we have a 4H Candle closure above it And Perfect Breakout and this give us a very good confirmation cuz we have not any 4H closure above this area since this week start , so we have a good confirmation now to can buy after the price go back to retest the broken area or even direct entry now to can use a small stop loss , and we can targeting 100 to 200 pips . if we have a daily closure below this area this mean this idea will not be valid anymore .
Reasons To Enter :
1- Perfect Touch For The Area .
2- Clear Bullish Price Action .
3- Bigger T.F Giving Good Bullish P.A .
4- The Price Take The Last High .
5- Perfect 15 Mins Closure .

XAUUSD: 3330 becomes the key, buy if it doesn’t fall belowIn the previous article, we successfully predicted that gold prices would fall if they failed to break through 3370. This proved to be the case, with gold prices ultimately falling to our ultimate target of 3330.
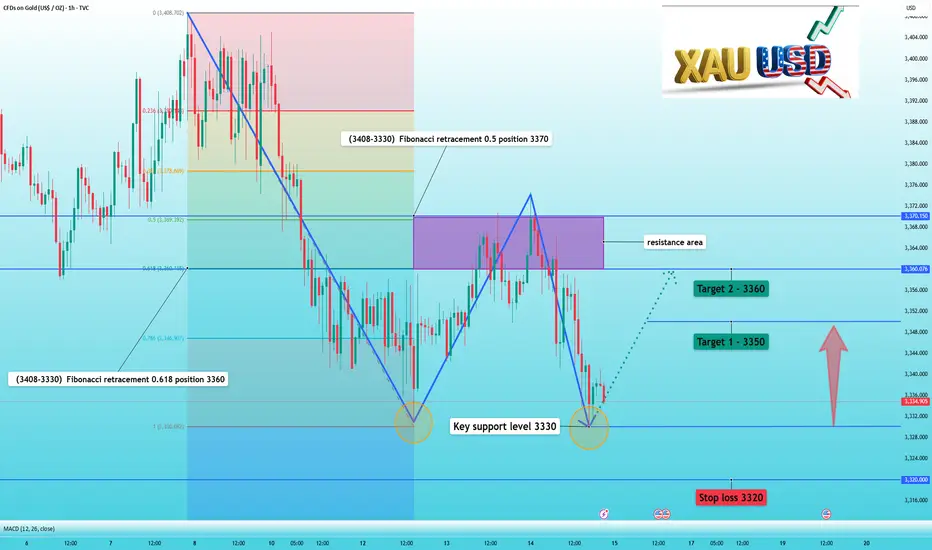
From the 1-hour chart, it's clear that 3330 is a key support level. Gold prices rebounded from the decline on the 12th precisely at this level. Now that gold has stabilized after hitting 3330 again, will it rebound again?
I personally believe that a rebound around 3330 will occur, but the strength will not be too strong. It's important to be prepared to cash in on your gains.
🏆Trade setup is as follows:
📈Buy near 3330
✅Target 1 - 3350
✅Target 2 - 3360
🛑Stop loss 3320
📣If you have different opinions, please leave a message below to discuss
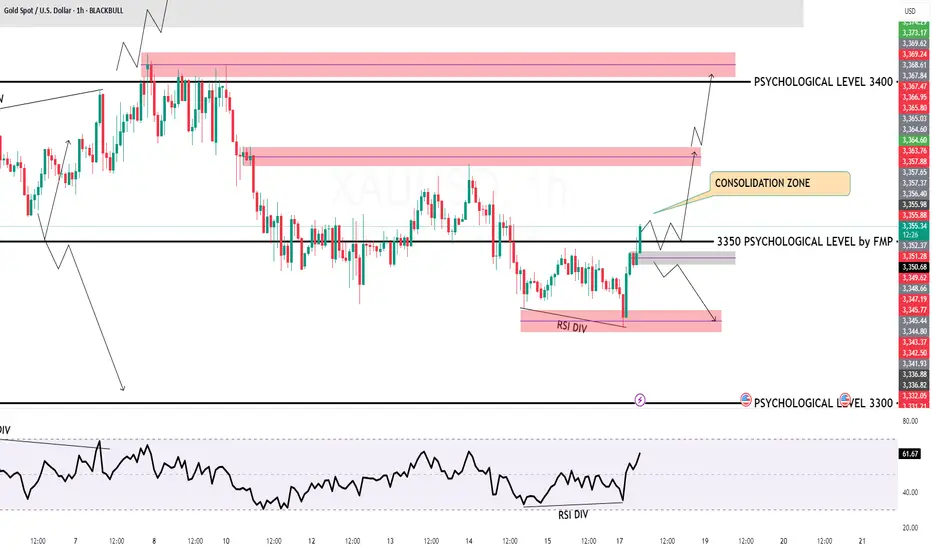
GOLD H1 Intraday Chart Update For 18 AUG 2025Good Morning Traders
as you can see that GOLD successfully break 3350 Psychological for Shorter term scenario
All eyes on 3330 level breakout for the day if market breaks 3330 level then it will move towards 3310 level otherwise market will move towards 3380 level soon
Disclaimer: Forex is RISKY
technical analysis of the XAUUSDPrice: Around $3,345 currently.
Chart Indicators
Zig Zag (5, 10): Helps highlight major swing highs and lows.
RSI (Relative Strength Index): 14-period with levels at 70 (overbought) and 30 (oversold).
Recent Low: Around $3,247 (late July).
Lower highs and lower lows indicate short-term bearish trend.
Price broke below a minor swing support around $3,380 and is now testing $3,345.
Zig Zag Pattern: Suggests corrective moves but overall downward bias after recent top at 3,438.
RSI Analysis
Recently peaked near 70 (overbought zone) during mid-August high.
Currently near 50 (neutral), showing consolidation after a sell-off.
Signal: No clear divergence, but bearish momentum eased after recent drop.
Key Support & Resistance
Support Levels:
$3,320–3,330: Near-term support zone.
$3,247: Major previous swing low (strong support).
Resistance Levels:
$3,380–3,400: Immediate resistance (recent broken support).
$3,438: Last swing high (strong resistance).
Volume Analysis
Downward move from $3,438 to $3,345 happened with moderate volume, suggesting steady selling pressure but not a panic drop.
Possible Scenarios
Bullish Scenario (Reversal or Pullback)
Price needs to hold above $3,330 and break $3,380 to target $3,420–3,438.
RSI moving above 60 would strengthen bullish momentum.
Bearish Scenario (Continuation)
If price breaks below $3,330, next target is $3,300, then $3,247.
RSI dropping toward 30 would confirm strong bearish momentum.
Trade Idea (Not Financial Advice)
For Bulls: Wait for a break & close above $3,380 for a potential long entry.
For Bears: Watch for a break below $3,330 for a potential short toward $3,247.
Stop-loss: Use nearby swing highs/lows for risk management.
Overall Sentiment:
Currently neutral to slightly bearish, as price is below key resistance and forming lower highs.

XAU/USD (Gold CFD) – Weekly Opening Outlook | SMC Perspective# 🟡 XAU/USD (Gold CFD) – Weekly Opening Outlook | SMC Perspective
**Date:** 2025/08/17
**Timeframe:** 45M (Heikin Ashi)
**Methodology:** Smart Money Concept (SMC)
---
## 📊 Market Context
Gold closed the previous week under heavy liquidity grabs after multiple **CHOCH** and **BOS** structures. The current market is positioned around **3,335**, balancing between two potential phases:
1. **Phase 1 (Bullish Recovery)**
2. **Phase 2 (Bearish Continuation)**
Both phases are mapped on the chart with clear structural references.
---
## 🔵 Forecast Phase 1 – Bullish Scenario
1. **Key Levels:**
- **Immediate Demand Zone:** 3,330 – 3,335
- **Equilibrium Reaction Zone:** 3,350 – 3,360
- **Liquidity Pool:** 3,380 – 3,390
2. **Conditions for Validation:**
- Price must hold the **discount demand zone** (PDI).
- A strong **CHOCH → BOS** sequence from current level.
- Break and close above **3,350 equilibrium**.
3. **Expected Move:**
- Push towards **previous PDH** and sweep above **3,370 – 3,380**.
- Potential continuation into **EQH (3,390 – 3,400)** liquidity zone.
4. **Targets:**
- 🎯 TP1: **3,350** (equilibrium retest)
- 🎯 TP2: **3,370 – 3,380**
- 🎯 TP3: **3,390 – 3,400** (EQH / liquidity sweep)
5. **Invalidation:**
- Closing candles below **3,330 demand zone** will weaken bullish outlook.
---
## 🔴 Forecast Phase 2 – Bearish Scenario
1. **Key Levels:**
- **Discount Zone:** 3,320 – 3,325
- **Major Demand Zone:** 3,300 – 3,280
- **Extended Liquidity Pool:** 3,260 – 3,250
2. **Conditions for Validation:**
- Failure to hold above **3,335 – 3,330**.
- Clear rejection at equilibrium levels (**3,350 – 3,360**).
- A new **BOS** towards the downside.
3. **Expected Move:**
- Market could unfold in 5-leg structure (as shown on chart: ① → ⑤).
- First rejection around **3,335 – 3,340**, followed by extension towards **3,310 – 3,280**.
- Final liquidity sweep possible into **3,260 – 3,250 zone**.
4. **Targets:**
- 🎯 TP1: **3,320 – 3,325**
- 🎯 TP2: **3,300 – 3,280**
- 🎯 TP3: **3,260 – 3,250**
5. **Invalidation:**
- A confirmed **bullish CHOCH** above **3,350 equilibrium** invalidates the bearish scenario.
---
## ⚖️ Summary
- **Phase 1 (Bullish):** Possible rebound from current demand towards **3,390 – 3,400** liquidity.
- **Phase 2 (Bearish):** Failure at equilibrium may trigger deeper continuation into **3,280 – 3,250 demand**.
Traders should monitor **CHOCH / BOS confirmations** closely before positioning.
---
#XAUUSD #Gold #SMC #CHOCH #BOS #Liquidity #FVG #TradingView

GOLD RAID ON – Bullish Limit Orders Are LIVE! XAU/USD💰GOLD HEIST IN PROGRESS! XAU/USD BULLISH RAID BEGINS! 🏴☠️📈
Asset: XAU/USD – Gold vs U.S Dollar
📊 Plan: BULLISH ROBBERY
🎯 Target: 3460.00
🛑 Stop Loss: 3330.00
📥 Entry: ANY level – vault is wide open!
👑 THIEF MODE ACTIVATED – Time to raid GOLD like a pro. We’re stacking multiple limit orders (layering entries) just like setting traps for those greedy bears 🐻💥
🚪💼 Entry strategy:
“The vault is unlocked – grab your bag and go!”
Place buy limits at recent swing lows (15m/30m) or jump in live with your bullish crew. Use alerts to catch price at key pullback zones.
🛑 SL placed at: 3330 – Just below thief territory. Adjust based on your lot size + number of entries 🔐
🎯 Target: 3460 – Hit and run, or trail that SL and let the gold rain! ☔💸
🧠 Thief Tactics for GOLD:
Only trade Long-side – scalpers, swing traders, all aboard 🚂
Use trailing SL to protect your loot
Avoid trading during high-impact news (CPI, NFP, Fed, etc) ⚠️
Stay alert for manipulations + fake-outs at key levels – it's a trap game out here 🎭
📰 Before the Heist:
🧾 Read Fundamentals • COT Report • Sentiment • Macro Outlook
📌 Always stay updated, news can flip the market faster than a backstab 🗡️
🗣️ Boost this idea if you’re robbing with us!
💥 Smash that LIKE if you believe in the heist
🚨 Follow for more high-voltage thief trades
💎 Daily playbooks. Clean getaways. All signals, no noise.
Join the crew. Trade like a THIEF. Get rich or get smarter.
🕵️♂️💰🚀🔥🐱👤📈

The impact of the meeting on gold prices.Trump: Speaks with Lukashenko. We discussed prisoner releases and a meeting with Putin. The meeting details are as follows:
Trump: "Had a great meeting with Belarusian President Lukashenko. The purpose of the call was to thank him for releasing 16 prisoners. We are also discussing the release of an additional 1,300 prisoners. We had a very pleasant conversation. We discussed many topics, including President Putin's visit to Alaska. I look forward to meeting with President Lukashenko in the future."
The meeting did not clearly indicate any positive or negative impact on the market. However, Jess believes that gold prices will continue to fall in the short term, so it is advisable to sell gold at a high level to profit.

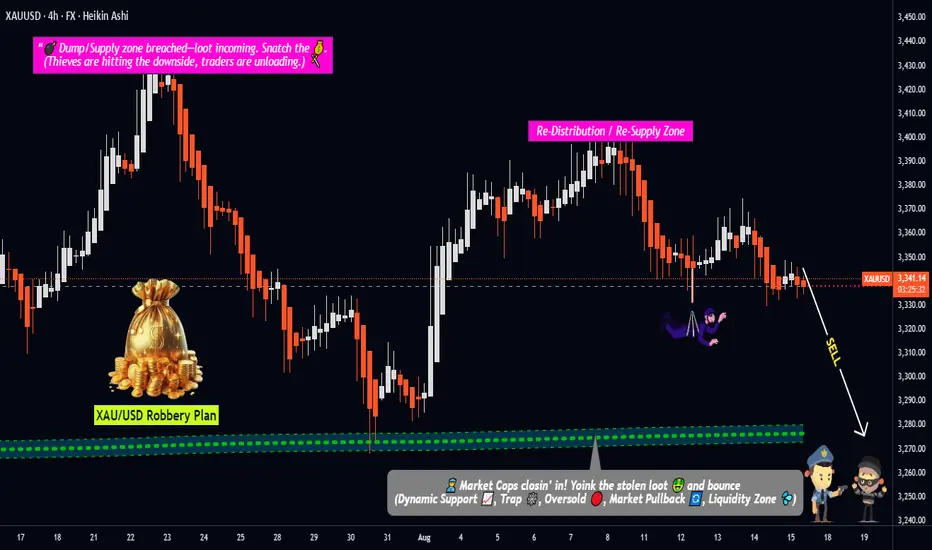
Gold Under Attack! Thief Trader’s Layered Sell Plan in Action!💣 XAU/USD GOLD HEIST: Police Waiting at 3270 – Escape Before They Catch Us! 🔐💰
🕵️♂️ Hello Thief OG’s, Money Grabbers & Market Shadows!
Today’s mission is Gold (XAU/USD) – not to wear, but to steal! 💸✨
🎯 MISSION BRIEF
We’re going BEARISH on Gold. No single-shot nonsense – we’re using layered SELL LIMIT traps to grab the loot piece by piece.
💼 Entry Layers:
3340.00
3350.00
3360.00
(💡 Add more layers if you want to go full gang mode.)
🛑 Stop Loss – The Alarm Trigger
SL @ 3380.00 🚨
But hey… Thief OG’s adjust it to your own strategy & risk. Don’t get caught with your mask off. 😎
💰 Target – The Escape Plan
Main Target: 3270.00 (Police barricade 🚔)
Quick Exit: 3280.00 (Escape van is ready 🚐)
📊 Why This Is the Perfect Hit
Price dancing near resistance – the “vault door” is open.
Weak bullish attempts = fake gold rush trap.
Trend sniffers pointing down on higher timeframes.
Market makers guarding at 3380 = the alarm system.
📜 Thief Trader Rules for This Mission
Avoid entering during major economic news bombs 💣.
Trail your SL once price moves in your favor – thieves who overstay get caught.
Always rob smart – we’re professionals, not gamblers.
💥 Support the Robberhood Crew!
Boost this idea if you want more Thief Trader missions.
Every boost = more ammo for the next market robbery.
Remember: No chase, no case. 🕶️💼💣
#XAUUSD #GoldTrade #BearishPlan #LayeringStrategy #ThiefTrader #RobTheMarket #BoostForMore
8/15: Watch Resistance at 3348–3358, Support at 3328–3323Good afternoon, everyone!
Yesterday, gold’s rebound was capped at 3352–3358, failing to turn resistance into support. As anticipated, price then moved into the 3332–3323 battleground.
On the 2H chart, bulls still hold a slight edge, with signs of a potential double bottom. However, if price continues to face resistance at 3348–3352 without breaking out, or loses the key 3328 support on a pullback, bullish momentum will weaken, and a bearish setup may re-emerge, increasing the likelihood of a retest near 3300.
With important US session data ahead, my strategy today differs from yesterday — focusing on buying dips as the main approach, with shorting near highs as a secondary option. Manage risk carefully and feel free to reach out if you need assistance.

XAU/USD Intraday Plan | Support & Resistance to WatchGold is trading around $3,344 after failing to break $3,367 minor resistance and hold above the $3,353 level, with both the 50MA (pink) and 200MA (green) now sitting above price and acting as dynamic resistance.
A break and sustained hold back above $3,353 would be needed to regain short-term bullish momentum, opening the path to $3,367 (minor resistance) and $3,380. Failure to reclaim $3,353 keeps the bias tilted bearish, with downside pressure likely toward $3,329 and $3,313 - $3,295.
Current structure remains under pressure while price stays below the moving averages, with sellers holding the near-term advantage.
📋 Bullish Plan
The $3,329–$3,313 zone aligns with main buy-side liquidity and a fair value gap on both the 1H and 4H charts — making it a high-probability reaction area.
📌 Key Levels
Resistance:
‣ $3,353
‣ $3,367
‣ $3,380
‣ $3,399
Support:
‣ $3,329
‣ $3,313
‣ $3,295
‣ $3,281
🔎 Fundamental Focus – Fri, Aug 15
Busy session ahead with multiple high-impact US releases, including Core Retail Sales, Retail Sales, and Import Prices — key indicators for consumer demand and inflation trends that can directly affect USD and gold volatility.
Later, we have Prelim UoM Consumer Sentiment and Inflation Expectations, which may influence market expectations for Fed policy.
⚠️ It’s Friday — expect high volatility spikes. Manage risk carefully and avoid holding unnecessary exposure over the weekend.

XAU/USD – Institutional Outlook 15 August 2025Gold continues to grind through a tight mid-$3,300 range after Thursday’s hot U.S. PPI print boosted the dollar and dented large Fed rate-cut bets. Despite the short-term pullback, the broader 4H structure remains intact — giving traders both an upside and downside opportunity today.
This is not a scattergun approach. We work with only ONE Buy Zone and ONE Sell Zone with full institutional confluence. Every level here is refined using Price Action, Smart Money Concepts, ICT core principles, Order Blocks, Fair Value Gaps, Premium/Discount arrays, and liquidity mapping.
Primary Buy Zone ($3,325–$3,330) – The Golden Zone
This is today’s highest-probability trade location. Price sits in structural discount, right on top of a fresh 4H Rally-Base-Rally demand zone with a refined bullish Order Block. An unmitigated Fair Value Gap overlaps perfectly with the Optimal Trade Entry (0.705–0.79 retracement) of the last bullish leg.
Liquidity is positioned just below at equal lows near $3,322, inviting a possible stop-run before reversal. Volume imbalance on the prior up-leg confirms smart-money participation.
Entry: $3,325–$3,330
Stop-Loss: Below $3,318 (liquidity + swing low)
Take-Profit Targets:
TP1: $3,357 (local structure)
TP2: $3,380 (Fib 1.272 projection)
Kill Zone: London open into New York overlap
Primary Sell Zone ($3,355–$3,360)
Gold’s upside is capped by a 4H Drop-Base-Drop supply zone nested in premium pricing. A refined bearish Order Block aligns with a Fair Value Gap from the last impulsive sell-off. Equal highs around $3,360 offer liquidity for a potential sweep before distribution.
Entry: $3,355–$3,360
Stop-Loss: Above $3,370 (EQH cluster)
Take-Profit Targets:
TP1: $3,330
TP2: $3,305 (Fib 1.272 extension)
Fallback Zones – In Case of Manipulative Displacement
Fallback Buy: $3,315–$3,320 → Demand zone + OTE + minor FVG; SL below $3,308; same TPs as Primary Buy.
Fallback Sell: $3,365–$3,370 → Secondary supply + OTE + OB; SL above $3,375; same TPs as Primary Sell.
Why the Golden Zone Matters Today
Among all four levels, the Primary Buy Zone at $3,325–$3,330 stands out. It sits at the crossroads of structural discount, smart-money footprints, and liquidity positioning. If price sweeps the equal lows at $3,322 during the London or early NY session, the probability of a sharp, institution-led reversal increases dramatically.
Institutional Consensus
Market commentary from FXStreet, FXEmpire, and DailyForex all acknowledge mid-$3,320s as a key support zone, with resistance forming near $3,355–$3,400. This alignment reinforces our bias: sellers control the premium zone, but buyers are poised to defend structural discounts.
Execution Reminder
Trade only the defined zones with precise risk control. These are institution-level liquidity plays, not mid-range chases. If price fails to respect the primary zone, step aside or switch to the fallback. Patience is part of the edge.
💬 If you find this level-by-level breakdown useful, drop a comment below. Let’s see how the Golden Zone plays out in real time.

Gold Spot / U.S. Dollar (XAUUSD) - 4 Hour Chart (OANDA)4-hour chart from OANDA displays the recent price movement of Gold Spot (XAUUSD) against the U.S. Dollar. The current price is $3,334.075, reflecting a decrease of $21.620 (-0.64%) from the previous value. The chart shows a sell price of $3,333.800 and a buy price of $3,334.340, with a spread of 54.0. The price has fluctuated between $3,368.176 (high) and $3,323.839 (low) in recent trading, with a shaded area indicating a potential support or resistance zone around $3,340. The data covers the period from mid-August to early September 2025.

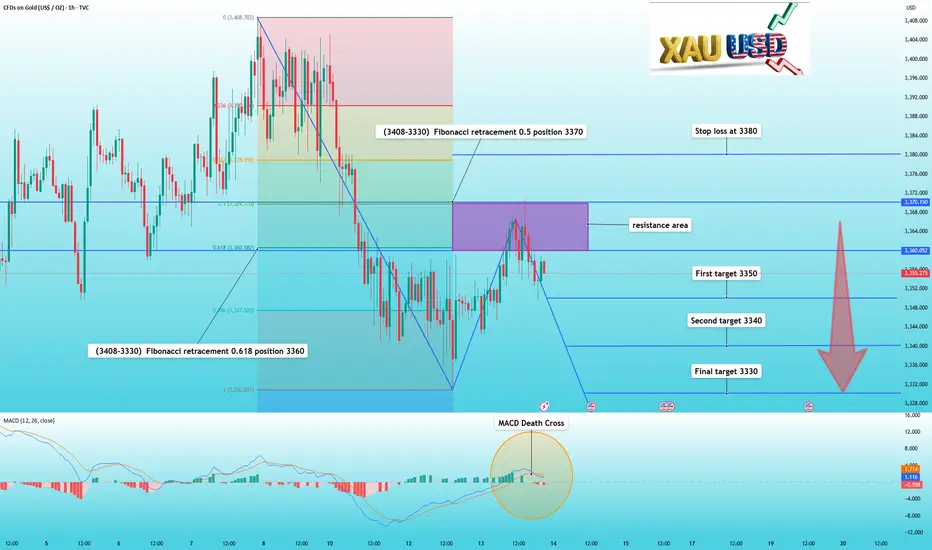
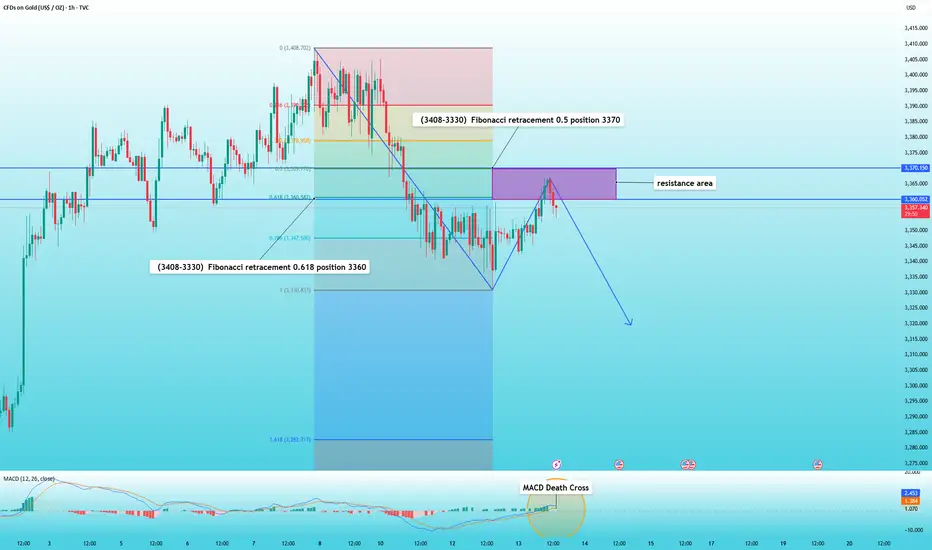
Gold pulls back as expected, you can continue to sellIn my previous trading strategy, I reiterated my view that gold prices would continue to fall if they couldn't break through 3370 in the short term.
And indeed, gold's performance behaved as expected. After hitting 3370, it fell again, reaching a low of 3350.
Technically, the current correction in gold prices hasn't concluded. The Fibonacci retracement indicator for the 3408-3330 trend shows that 3370 is at 0.5, and 3360 is at 0.618, representing resistance. Meanwhile, the MACD indicator has formed a death cross.
Therefore, we do not need to make any changes to our trading strategy. As long as 3370 is not effectively broken, we can continue to short based on the resistance range.
Trade setup is as follows:
Sell near the 3360-3370 area
First target 3350
Second target 3340
Final target 3330
Stop loss at 3380
📣If you have different opinions, please leave a message below to discuss
8/14: Watch Resistance at 3352–3358, Support at 3332–3323Good afternoon, everyone!
After entering the 3372–3378 resistance zone, gold attempted two breakouts but failed, forming a double-top pattern and breaking below the 3366 support. It then found temporary support at 3358–3352, but the rebound failed to reclaim 3366, leading to a further drop to test the 3343–3337 area. This is a textbook support-to-resistance shift, worth studying for those interested in technical analysis.
Currently, the structure favors the bears. In the coming moves, watch closely to see if the 3352–3358 area turns from support into resistance again. If selling pressure persists, 3332–3323 will be the next battleground. Should bulls fail to defend it, the 3300 level could be retested.
For the rest of the week, trading should remain focused on these key support and resistance zones. With data coming in during the US session today, risk management is crucial — favor short positions on rebounds, with long trades as a secondary option. If caught in a losing position, and your account is safe, consider averaging down or hedging. If you need assistance, feel free to message me.

Gold rebounds and is facing resistance, waiting for a declineIn the previous article, I said that if the gold price cannot hold above 3370 in the short term, then the gold price will continue to fall.
Today's rebound in the Asian and European sessions shows mixed gains and losses on the K-line chart, indicating a weak rebound. After rebounding to 3367, gold prices turned downward again.
Meanwhile, the 1-hour MACD indicator also shows signs of forming a death cross. The Fibonacci retracement indicator from 3408 to 3330 indicates that the 0.618 level is at 3360, and the 0.5 level is at 3370. Therefore, the 3360-3370 range is currently a resistance zone.
Therefore, I still maintain my previous view that as long as it cannot hold 3370, you can short in the resistance area.
GOLD Buyers In Control Now , Long Setup To Get 200 Pips !Here is My 15 Mins Gold Chart , and here is my opinion , we finally above 3358.00 and we have a 4H Candle closure above it And Perfect Breakout and this give us a very good confirmation cuz we have not any 4H closure above this area since this week start , so we have a good confirmation now to can buy after the price go back to retest the broken area to can use a small stop loss , and we can targeting 100 to 200 pips . if we have a daily closure below this area this mean this idea will not be valid anymore .
Reasons To Enter :
1- Clear Breakout On Bigger T.F
2- Clear Bullish Price Action .
3- Bigger T.F Giving Good Bullish P.A .
4- The Price Take The Last High .

Gold Spot / U.S. Dollar (XAU/USD) 4-Hour Chart - OANDA4-hour chart from OANDA displays the price movement of Gold Spot (XAU/USD) from late July to mid-September 2025. The current price is $3,335.985, reflecting a decrease of $6.670 (-0.20%). Key levels include a sell price of $3,335.720 and a buy price of $3,336.270. The chart highlights recent price fluctuations, with a notable drop and a shaded support/resistance zone between approximately $3,340.000 and $3,360.000

GOLD Intraday H1 Chart For 13 August 25Hello Traders,
as you can see that GOLD is still in tight range all eyes for now 3365 resistance level break out for further upward move
below 3330 level GOLD remains bearish and will move towards 3308 level
Disclaimer: Forex is Risky

Gold Spot / U.S. Dollar (XAUUSD) 4-Hour Chart - OANDA4-hour price movement of Gold Spot (XAUUSD) against the U.S. Dollar, sourced from OANDA. The current price is $3,349.050, reflecting a decrease of $48.715 (-1.43%) as of 01:11:40. Key levels include a sell price of $3,348.830 and a buy price of $3,349.380, with a highlighted support zone around $3,348.849 and a resistance zone near $3,370.815. The chart covers the period from early August to mid-September 2025.

Gold support has been confirmed, buy with confidenceThe most anticipated outcome for the gold market this week is tomorrow's CPI data. After today's pullback during the Asian and European trading sessions, the current price has reached support levels. Before the CPI release, I believe volatility will be minimal, with a high probability of limited fluctuations.
The chart shows that 3350 is a key support level. After several hours of testing, 3350 has stabilized, so we can buy at this level, with the initial target being 3360, followed by 3380.
GOLD Melted , Clear Chance To Buy It Now , 150 Pips Waiting !Here is My 15 Mins Gold Chart , and here is my opinion , the price go down very hard after touch 3400.00 and melted to 3353.00 and we finally above 3358.00 and we have a 30 Mins Candle closure above it And Perfect Breakout and perfect bullish price action , so we have a good confirmation now to can buy it and we can targeting 100 to 200 pips as a small correction after this huge movement to downside in a very short period , so i will buy it to see if we have a correction for 150 to 200 pips at least .
Reasons To Enter :
1- New Support Created .
2- Bullish Price Action .
3- Bigger T.F Giving Good Bullish P.A .
4- 30 Mins Confirmation
5- Little Correction .

8/11: Sell High and Buy Low in the 3416–3372 RangeGood morning, everyone!
This week’s major data releases and news events are concentrated between Tuesday and Friday. Monday is relatively calm, so today’s strategy will mainly rely on technical analysis.
Technically, after a pullback to the MA20, last week’s weekly candle closed as a small bullish candle, and price has re-entered the strong resistance zone at 3400–3450. On the daily chart, bullish momentum hasn’t been fully released yet, but the 4H chart is showing early signs of bearish pressure. For today, keep an eye on the 3400–3420 resistance area, with primary support at 3386–3378 and secondary support at 3372–3366. Unless the bulls completely give up, a break below secondary support seems unlikely.
The main trading range for today is 3372–3416. If the market turns into a one-way move, consider a “contrarian” approach — just avoid buying high and selling low. If you find yourself in a trapped position, don’t panic. As long as risks are controlled, you can use scale-in entries or hedging to recover. If your trade rhythm is off, even holding onto positions (“sitting it out”) can reduce losses or turn a profit. Of course, if risk gets out of control, cut losses decisively — better to retreat than to blow up the account.
Account safety always comes first. Keep your capital intact, and you’ll find plenty of profitable opportunities this week — so many, you might start wondering if someone added extra days to the calendar.
If you need assistance, feel free to leave me a message.
