WILL GOLD STILL GO SIDEWAYS TODAY? WHAT DO YOU THINK?1. Overview
Yesterday's candle formed a Doji → the market is hesitant, not showing a clear main trend.
Today, if the candle closes below the support zone → prioritize SELL,
If the candle closes above the resistance zone → prioritize BUY.
2. Expected Trend
The market is likely to move sideways within the range:
4170 ⇄ 4220
Strategy: Trade according to the zone – follow the breakout of any boundary.
3. BUY ZONES
4180-4175
4155-4160
🔸 SL: 100 pips
🔸 TP: 100 pips
4. SELL ZONES
4217-4220
4230-4333
4240-4244
4260-4265
🔸 Wait for a clear price reaction in the zone before entering a trade.
5. Important Notes
Plan applies before the 22:00 news.
Break any zone, then follow that zone. Do not try to catch tops and bottoms.
Xauusdsetup

WILL GOLD STILL GO SIDEWAYS TODAY? WHAT DO YOU THINK?1. Overview
Yesterday's candle formed a Doji → the market is hesitant, not showing a clear main trend.
Today, if the candle closes below the support zone → prioritize SELL,
If the candle closes above the resistance zone → prioritize BUY.
2. Expected Trend
The market is likely to move sideways within the range:
4170 ⇄ 4220
Strategy: Trade according to the zone – follow the breakout of any boundary.
3. BUY ZONES
4180-4175
4155-4160
🔸 SL: 100 pips
🔸 TP: 100 pips
4. SELL ZONES
4217-4220
4230 -4234
4240-4244
4260-4265
🔸 Wait for a clear price reaction in the zone before entering a trade.
5. Important Notes
Plan applies before the 22:00 news.
Break any zone, then follow that zone. Do not try to catch tops and bottoms.

Gold’s Oscillatory SeesawGold is in a consolidative oscillation following a high-level pullback. Short-term volatility remains limited amid profit-taking activities and anticipation of upcoming economic data, while the medium-to-long-term trend is still underpinned by multiple core factors. Today, the price has fluctuated around the critical $4,200 level in a seesaw pattern, displaying distinct characteristics of a high-level oscillation with "limited downside and moderate upside momentum," as long-short divergence remains pronounced.
On the downside: The immediate short-term support remains in the $4,170 – $4,175 range, with key focus on the $4,153 – $4,155 zone. A break below this interval could trigger further downside movement, making it a crucial defensive level for medium-term bulls.
On the upside: The near-term resistance is at $4,220. A successful breakout and hold above this level may pave the way for a rally toward the $4,250 – $4,265 range.
Overall, today’s consolidative pullback in gold represents a short-term correction rather than a trend reversal. Operationally, traders can adopt a range-trading strategy of "buying low and selling high" for the time being, with key attention on the breakout of the $4,200 level. Meanwhile, remain vigilant of the guiding role of subsequent ISM Services PMI and PCE data on the market.
Trading Strategy:
Buy 4175 - 4185
SL 4170
TP 4220 - 4230 - 4240
Sell 4220 - 4230
SL 4240
TP 4190 - 4180 - 4170

Market volatility, pay attention to the daily MA10.#XAUUSD OANDA:XAUUSD TVC:GOLD
Today's market closed below the MA5 on the daily chart, with short-term resistance at 4210-4220. The current market trend is weak, and it may continue to test the support near the daily MA10. If it touches the 4170-4160 area for the first time, you can consider a small long position. If the downward momentum continues strongly, it may further test the 50% retracement level around 4145.

Elise | XAU/USD 2H – Liquidity Sweep + Retest Demand ZoneOANDA:XAUUSD
Multiple range phases indicate institutional accumulation. Price reacted cleanly to previous demand and is now preparing for continuation if support holds. A break-and-hold above 4,225 unlocks open liquidity toward 4,350-4,380.
Key Scenarios
🟢 Bullish Case (Preferred)
Hold above 4,175 → 4,180
🎯 Target 1: 4,260
🎯 Target 2: 4,320
🎯 Final Target: 4,375 – 4,380
🔻 Bearish Case (Invalidation)
If price closes below 4,111-4,115
📉 Downside exposure opens toward 4,040 – 4,000
Current Levels to Watch
Resistance 🔴: 4,260 / 4,318 / 4,380
Support 🟢: 4,175 / 4,115 (Invalidation)
⚠️ Disclaimer: This analysis is for educational purposes only. Not financial advice.

XAUUSD Beautiful BreakoutXAUUSD Beautiful Breakout
Entry: 4133 (after breaking last LH)
SL: 4040 (Below last HL)
TP: 4360-4380 ( as per ABCD pattern )
RR: 1:3RR

GOLD Resistance Ahead!
HI,Traders !
#GOLD keeps growing
But will soon hit a horizontal
Resistance of 4229.11
So after the retest we will
Be expecting a local
Bearish correction !
Comment and subscribe to help us grow !

Gold Trade Set Up Dec 4 2025Price swept PDL and SSL to the left also tapping into 1h and 15m demand zones so i will be targeting higher BSL and PDH for a continuation higher

GOLD End-of-Week Trend Exhaustion on XAUUSD My AnalysisXAUUSD (Gold) has been bearish all week, and as we head toward the end of the week, we need to stay cautious. 📉⚠️ When the weekly trend is already pushing lower, institutional traders often start winding out of their short positions. This can cause unexpected pullbacks or even full retracements. And remember — trends don’t move in one direction forever. They weaken, especially toward the end of the week. 😮💨
So the real question becomes: do you really want to trade with the trend right as it’s hitting potential exhaustion?
Looking at the chart, Gold has traded lower and broken through a key level. When we check the volume profile, the Point of Control (POC) is sitting right above current price — and that level is stacked with previous order flow. 🧱📊 That makes it a strong resistance area, and for me personally, it’s not an area I’d want to be buying into.
Because today is Thursday, a sell setup could still be valid if we see price pull back and then break structure to the downside again. But as mentioned earlier, be careful — late in the week we often see profit-taking, which can push price back up before the weekly close. 🕒🔄
Trade smart and manage risk.
Not financial advice.

XAUUSD Intraday Plan|Will Buyers Defend the Reaction Zone?Gold once again failed to reclaim the 4232 resistance yesterday.
Price tested the level but reversed sharply as sellers stepped in. We now have another test of the Reaction Zone, and price is also trending below the MA50, with the MA200 likely to be tested next.
The 4232 resistance remains the key level buyers must reclaim to attempt another push higher.
On the downside, if the MA200 and the First Reaction Zone fail to hold, watch the Support Zone. If selling pressure continues, the HTF Support Zone becomes the next area where buyers may show a stronger reaction.
📌Key levels to watch:
Resistance:
4232
4274
4322
Support:
4185
4141
4102
4049
4014
3966
🔎Fundamental focus:
High-impact news on the calendar today — expect volatility. Manage risk accordingly.

Gold (XAU/USD): FED WILL CUT! ADP HAS MADE IT CLEAR.🎯 Fundamental Summary
SHOCKING News: ADP private payrolls unexpectedly DECREASED by 32,000 (completely contrary to the expected increase).
Impact on Fed: This weak labor data strongly reinforces the expectation that the Fed will cut interest rates by 25 basis points at the next meeting.
Conclusion: A lower interest rate environment is the main "tailwind," boosting demand for non-yielding Gold.
📈 Technical Analysis
The market is approaching a decisive zone. Gold needs a breakthrough:
Strong Supply Zone (Key Level): $4,200 – $4,212
Expected Action/Reaction: If Gold breaks and closes above $4,212, the fundamental momentum will prevail, confirming a strong UP trend.
Important Demand Zone (Strong Support): $4,131 – $4,140
Expected Action/Reaction: The final support area. If there is a deep decline, this is a potential buying point based on the news.
#XAUUSD #GoldAnalysis #SmartMoneyConcepts #FundamentalAnalysis #Fed #ADP #LaborMarket #TradingView

Gold Price Outlook – Trade Setup (XAU/USD)📊 Technical Structure
OANDA:XAUUSD Gold has broken below the short-term ascending trendline and slipped under the intraday resistance zone around $4,200–$4,207, showing weakening bullish momentum. Price is now trading back inside the mid-range structure with bearish pressure building as the market respects both the diagonal breakout and the rejection from the resistance supply zone.
As long as XAU/USD stays below $4,200–$4,207, bearish continuation toward the $4,166–$4,159 Support Zone remains the primary expectation. A clean 1H close back above $4,212 would invalidate the bearish structure and shift momentum back toward the upper resistance cluster.
🎯 Trade Setup
Idea: Sell rallies below resistance, targeting a move into the support zone.
Entry: $4,200 – $4,207
Stop Loss: $4,212
Take Profit 1: $4,166
Take Profit 2: $4,159
Risk–Reward Ratio: ≈ 1 : 2.68
Bias remains bearish below $4,200–$4,207. Above $4,212 = bearish invalidation.
🌐 Macro Background
Gold moves lower below the $4,200 level as a modest USD rebound and a positive risk tone pressure safe-haven demand. Despite this pullback, downside remains limited by rising expectations that the Federal Reserve will cut interest rates next week, with markets broadly pricing in a 25bps reduction. The latest ADP report showed a surprising 32K contraction in private payrolls, reinforcing signs of a cooling US labour market and supporting the case for monetary easing.
While the USD sees a mild uptick, dovish Fed expectations should cap deeper Dollar strength, keeping gold supported on significant dips. At the same time, geopolitical risks tied to the Russia–Ukraine conflict continue to provide a safety floor for XAU/USD. Traders now await US jobless claims data today and the PCE inflation release on Friday to gain clearer direction on the Fed’s rate path.
🔑 Key Technical Levels
Resistance Zone: $4,207 – $4,200
Support Zone: $4,166 – $4,159
Invalidation Level: $4,212
Targets: $4,166 / $4,159
📌 Trade Summary
Gold breaks below trendline support and retests the underside of resistance, maintaining short-term bearish structure. Below $4,200–$4,207, sellers remain in control with downside aiming toward $4,166–$4,159. Only a breakout above $4,212 would flip the bias back to bullish.
⚠️ Disclaimer
This analysis is for reference only and does not constitute trading advice. Trading involves significant risk, and proper risk management is essential.

Gold Price Outlook – Trade Setup (XAU/USD)📊 Technical Structure
OANDA:XAUUSD Gold holds steady above the $4,164–$4,143 Support Zone, maintaining a constructive bullish structure on the 4H chart. Price has pulled back from resistance but remains supported by buyers around the mid-$4,100 region. The chart shows a clear range-within-uptrend structure, with buyers consistently stepping in above support.
As long as XAU/USD holds above the $4,143–$4,164 support floor, dips are expected to attract buying flows, with upside potential back toward the $4,251–$4,273 Resistance Zone.
A 4H close below $4,133 would invalidate the bullish outlook and expose deeper retracement.
🎯 Trade Setup
Idea: Buy dips into support, targeting a retest of the resistance zone.
Entry: $4,164 – $4,143
Stop Loss: $4,133
Take Profit 1: $4,251
Take Profit 2: $4,266
Risk–Reward Ratio: ≈ 1 : 3.3
Bias remains bullish above $4,143–$4,164. A 4H close below $4,133 signals structure failure.
🌐 Macro Background
Gold edges higher near $4,210 as weak US private payrolls increase expectations of a Federal Reserve rate cut next week. ADP employment data showed a 32,000 drop in US private payrolls, signalling ongoing labour market deterioration. This fuelled dovish expectations, with markets now pricing an 89% chance of a December rate cut, sharply boosting demand for the non-yielding metal.
The US Dollar remains pressured by soft labour data, providing an additional tailwind for XAU/USD. Traders now shift attention to US Initial Jobless Claims later today and the delayed PCE inflation report on Friday. While hotter-than-expected PCE could strengthen the USD temporarily, the broader macro environment continues to favour gold due to easing expectations and weakening US data.
Overall, weak US labour indicators + strong rate-cut bets = continued support for gold on dips.
🔑 Key Technical Levels
Resistance Zone: $4,251 – $4,273
Support Zone: $4,164 – $4,143
Invalidation Level: $4,133
Targets: $4,251 / $4,266
📌 Trade Summary
Gold maintains bullish momentum above the $4,164 support zone, supported by weak US payrolls, rising Fed rate-cut bets, and ongoing USD softness. As long as price holds above $4,143–$4,164, the strategy favours buying dips toward support and targeting a move back into the $4,251–$4,273 resistance region. Only a break below $4,133 would shift bias to neutral/bearish.
⚠️ Disclaimer
This analysis is for reference only and does not constitute trading advice. Trading involves significant risk, and proper risk management is essential.

XAUUSD: Buy low and sell high within the 4230-4160 rangeToday is Wednesday, and whether gold can extend its upward move will depend on a key speech as well as the upcoming ADP employment report. With the absence of the NFP release this month, the ADP report has gained additional importance and is expected to exert a stronger-than-usual market impact.
Yesterday, gold broke below the $4,200 level twice but ultimately closed back above it. During the Asian session today, prices attempted another rally, but encountered resistance near $4,230, suggesting technical pressure at that level. Bullish momentum is weakening, and previously elevated sentiment has become more cautious.
Gold’s current two-way volatility is mainly driven by two factors:
The expected Fed rate cut:
Markets believe the upcoming rate cut may be a hawkish cut, which would offer limited support for gold.
The nomination of the next Federal Reserve Chair:
Trump hinted that Kevin Hassett may be the nominee. Given Hassett’s dovish stance and support for rate cuts, his appointment would be positive for gold and U.S. equities.
However, based on today’s market reaction so far, investors appear unconvinced.
If Trump explicitly confirms Hassett as the nominee, gold could receive stronger upside support.
In my view, before the ADP release and any formal confirmation of the next Fed Chair, gold is likely to remain range-bound between $4,230 and $4,160.
Short positions can be considered near the $4,230 resistance zone
Long positions can be considered near the $4,160 support zone
Once gold breaks out of this range, we will formulate a new trading plan accordingly.

Gold is Trading in a Consolidative OscillationGold is trading in a consolidative oscillation today. Despite intraday pullbacks and rebounds, it has failed to break out of the key range. Technical indicators are signaling a short-term correction, while the medium-to-long-term uptrend remains intact amid the interplay of fundamental news and geopolitical factors.
On the upside, the $4,230 level forms a strong resistance zone – gold has made multiple unsuccessful attempts to breach this level. Additionally, $4,250 acts as a crucial near-term resistance; a decisive breakthrough will require strong bullish catalysts.
On the downside, support remains solid: the immediate short-term support for today is $4,200. If this level is broken, the previous session’s low of $4,163 will serve as effective support, having triggered a quick rebound on prior tests. Notably, $4,150 – a key level that has held through four retests over the past three weeks – stands as the "lifeline" of the recent trading range.
Trading Strategy:
Buy 4190 - 4200
TP 4230 - 4240 - 4250
Sell 4225 - 4230
TP 4205 - 4185 - 4165

Gold Bulls Suppressed Repeated Tests of 4200Gold continued to fluctuate between 4190 and 4240 today, with 4200 being repeatedly tested. This range is expected to be broken soon, as the main support level has been rising over time, currently around 4198. If this level is broken, I expect the price to fall below the low of 4163, reaching the 4150-4130 range. If the price drops rapidly to this area, a rebound is likely, similar to the market reaction after today's data release, although the rebound may not be as significant. Of course, this also needs to be considered in conjunction with news developments.
Therefore, we need to adjust our trading strategy. We should lower the buying range to below 4170, and at the same time, we should lower the selling range to above 4200.

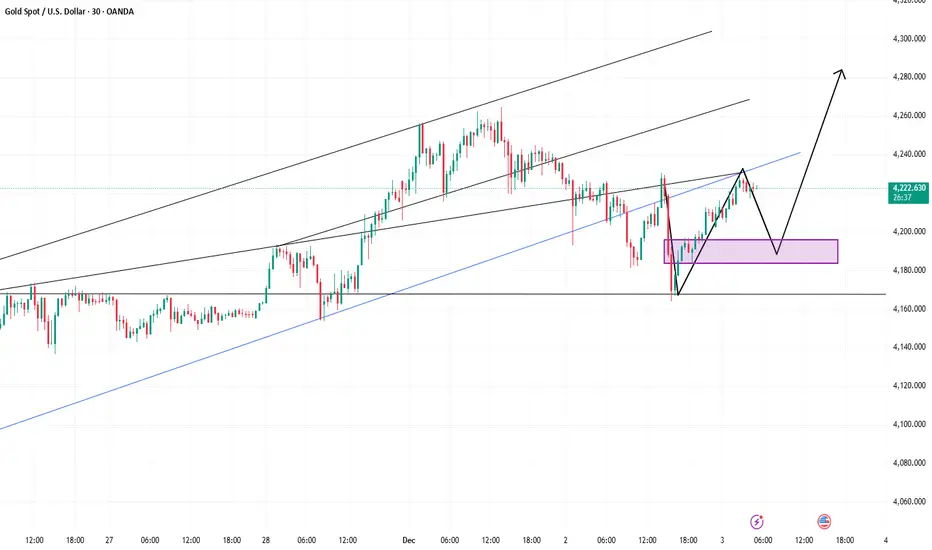
[WEEKLY] ANFIBO | Gold XAUUSD - Purple or Gray? [11.24 - 11.28]Hi guys, Anfibo’s here!
XAUUSD Weekly Trading Plan
Overall Picture:
OANDA:XAUUSD is entering a critical phase as price continues to consolidate within a tightening structure, signaling that a major directional move is likely to occur next week. After a period of strong volatility, the market is now compressing energy between the upper and lower boundaries of the current range. This setup is textbook for a break–retest–continuation model, and that’s exactly why my strategy for the upcoming week revolves around two clear scenarios: the “purple arrow” plan and the “grey arrow” plan.
The market will reveal its next major direction once either the upper boundary is broken or the lower boundary gives way. Until that happens, there is no reason to pre-commit to a biased direction — we trade what price confirms, not what we predict.
Trading Plan for Next Week:
We will react based on breakout confirmation:
>>> Scenario #1: Break ABOVE the range – Follow the “Purple Arrow” plan (BUY)
If gold pushes through the upper boundary with strength and confirms a retest, we will switch to a bullish continuation plan.
Key Resistance Levels to Watch: 4147, 4243, 4340, 4356, 4377.
A clean break above structure opens the path back into macro bullish territory, where gold may attempt to revisit or even surpass recent highs.
>>> Scenario 2: Break BELOW the range – Follow the “Grey Arrow” plan (SELL)
Once price breaks and retests the lower boundary, we will look for sell setups targeting the ladder of support levels outlined below.
Key Support Levels to Watch: 4000, 3917, 3890, 3862, 3820, 3793, 3760
A bearish breakout from the range could trigger a multi-wave continuation pattern, giving us multiple opportunities to scale in according to structure.
Risk Management:
Trade only after confirmed breakouts — avoid guessing tops and bottoms.
Keep tight SLs on retests to avoid liquidity hunts common during range boundaries.
Maintain Risk:Reward ≥ 1:2 across all setups.
Prioritize clean structure; avoid trading inside the choppy middle zone of the range.
Reassess bias immediately if the breakout fails or re-enters the range.
Conclusion:
Next week’s market will be all about patience and reaction, not prediction. With gold coiling tightly, a breakout is imminent, and both the “purple arrow” (bullish) and “grey arrow” (bearish) plans give us a clear and disciplined roadmap. Whether price breaks upward or downward, we already know exactly where our key levels are and how we will execute. Stick to structure, wait for confirmation, and let the market choose the direction for us.
HAVE A POWERFUL NEW WEEK, GUYS!

The expectation of interest rate cuts remains the core support.#XAUUSD TVC:GOLD OANDA:XAUUSD
✅ From the daily chart, gold prices are still above the MA5 and MA10. A prudent approach is to wait for a pullback to buy, or continue to use a buy-low-sell-high strategy until key resistance is broken. With the moving averages rising, the first support level to watch today is 4205-4195. If the price finds support and stabilizes in this area and strengthens again, the first resistance level to watch is the 4260-4270 area. This level represents both the previous high and a key level determining whether gold can hold above the 4300 mark.
✅ It is worth noting that if the price breaks below the support range of 4205-4195, it may retest the 4160-4140 area. It is particularly important to note that repeated testing of the same support level often signals weakness, and a cautious approach is necessary.

Gold Trade Set Up Dec 3 2025Gold is overall bullish making HL on the 1h but hasnt made a HH yet so i will want to see price break and close above 4230 to target higher supply area or sweep PDH/Asia high, to come down to lower 1h demand before continuing higher

XAUUSD(GOLD) HIGH PROBABILITY LONG SETUP SOON!!!🚨 XAUUSD HIGH PROBABILITY BUY SETUP 🚨
* Here We Can See Clearly The Next Potential Moves For GOLD Coming Hours/Days.
* Keep Your Eyes Close On Your Trading Positions.
* Happy PIP Hunting Traders.
FXKILLA.

XAUUSD: Rate Cut Storm Ahead! Is Gold Set to Soar?1. 📢 FUNDAMENTALS PUSHING PRICE
FED About to Cut Interest Rates (90%): Cooling U.S. economic data strengthens the expectation of a 25bps cut next week. This weakens the USD and supports Gold.
Geopolitical Risks: Russia-Europe tensions keep the safe-haven demand for Gold high.
Key Event: Watch PCE on Friday to better determine the Fed's monetary policy path.
2. 🎯 TECHNICAL ENTRY POINTS
The optimal strategy is to BUY ON DIPS at strong support:
Optimal Buying Zone (Discount Zone): $4,181 – $4,186. This is the ideal Long Entry Point.
Resistance/POC: $4,207. Important short-term level.
Upside Target: $4,240. Next profit-taking target.
👉 Conclusion: Be patient and wait for Gold to adjust to the $4,181 - $4,186 zone to enter a buy order with low-risk advantage, leveraging macro upward momentum.
#XAUUSD #GOLD #FED #InterestRateCut #GoldAnalysis

XAUUSD: The upward trend remains intact; wait for entryGold remains in an overall uptrend, but bullish momentum is clearly weakening, making today a crucial session.
Whether prices can continue moving higher will largely depend on whether gold can hold the current pullback. If support holds, the next leg up is likely to be even stronger. If not, the market will likely slip into a choppy, range-bound pattern.
Over the past two weeks, markets have been heavily pricing in a Fed rate-cut narrative, and much of that expectation is now largely priced in.
At the same time, the nomination of a new Federal Reserve Chair has returned to the center of market attention. Regardless of who is selected, the candidate is widely expected to be dovish, or they would not have been nominated in the first place.
A dovish chair would inherently support rate cuts—a bullish factor for gold.
Therefore, even if gold experiences short-term pullbacks or weakening momentum, the broader bullish trend remains unchanged.
For today, the key price levels to watch are $4,180 and $4,200.
If price reaches these zones, they may offer actionable trading opportunities.

Gold Aiming for 4300? Watch U.S. PMI and ADP DataYesterday, gold once again showed a roller-coaster pattern—high-level consolidation, a pullback downward, yet still maintaining strong resilience near the highs. During the U.S. session, it fell to around 4163, but the late session recovered the losses strongly. If gold continues to hold this kind of structure, we may see the daily chart gradually shift into a rising consolidation, bringing the market back to a bull-dominant phase.
Although gold faces short-term profit-taking pressure, multiple factors—including Fed rate-cut expectations, strong central-bank buying, falling U.S. yields, a weaker dollar, and ongoing geopolitical uncertainty—continue to support the upside breakout. Looking ahead, the 5000 target may not be unrealistic. Keep a close eye on the Federal Reserve and upcoming key economic data.
Today, on rebounds, continue to watch the 4236–4245 and 4265 resistance zones; if price approaches but fails to break, consider light short positions. On pullbacks, first monitor 4211–4193, and if that breaks, watch the 4176–4163 support levels.
Price action remains highly repetitive at the moment. Short-term movement shows high-level choppy consolidation with repeated spikes and pullbacks. Maintain your rhythm—avoid chasing trades, and pay attention to disciplined execution.
Yesterday’s public plan was to buy near 4200, short around 4230, then buy again below 4178 and close at 4187, waiting for another dip to re-enter. However, the market turned strong, so we chased lightly in the 4187–4180 area and are still holding. If resistance near 4245 fails to break, the long positions will be closed, and we will shift to short trades.
Therefore, today’s trading plan is:
Sell above 4240
Buy below 4200