XAU/USD Price Action Analysis – June 12, 2025 XAU/USD Price Action Analysis – June 12, 2025 🪙📈
📊 Technical Overview:
The chart presents a clear range-bound market structure with well-defined zones of support and resistance:
📍 Key Levels:
🔴 Resistance Zone: $3,380 – $3,400
Price has been rejected multiple times from this level, as indicated by red arrows. It marks a strong supply zone.
🟢 Support Zone: $3,280 – $3,300
Price has bounced several times from this demand area, forming a reliable support base.
📏 Intermediate Level: $3,319.38
Marked with a purple line, this is likely a mid-range liquidity zone or a previous minor structure level.
🔄 Price Action Insights:
Double Bottom Formation: Notable at the support zone, confirming strong buying interest (highlighted with orange circles and green arrows). This pattern often signals a bullish reversal.
Current Price: Trading near $3,375.645, approaching the resistance area again.
Projected Scenarios:
Bullish Continuation 📈: Break and close above the resistance could trigger momentum to the upside — watch for a breakout with strong volume.
Pullback Scenario 🔁: A rejection from resistance could cause a retest of $3,319.38 or even the support zone, forming a higher low before a potential rally.
🧠 Strategy Outlook:
Bullish Bias 🐂 as long as price holds above $3,319.38.
Watch for Breakout 🚀 above resistance with volume confirmation for long entries.
Caution ⚠️ near resistance; ideal to wait for either a breakout or clear rejection.
📌 Conclusion:
The chart reflects accumulation within a range, with bullish structure emerging. A break above $3,400 could shift market sentiment decisively upward, while a failure at resistance invites a deeper pullback.
Xauusdsetup

Gold: Rebounding and Stabilizing Near 3340Gold Market Outlook: Watching Inflation, Technical Pressure Builds
Markets are squarely focused on the upcoming U.S. Consumer Price Index (CPI) release, which could serve as a pivotal moment for shaping Federal Reserve policy expectations ahead of the September meeting. Current market pricing suggests a roughly 52% probability of a rate cut, but this is highly sensitive to how inflation data unfolds. The consensus anticipates headline CPI growth of 0.2% and core inflation at 0.3%. Any deviation—especially a softer reading—could significantly sway sentiment in favor of monetary easing, thereby reinforcing gold’s appeal as a defensive asset.
Beyond the macroeconomic calendar, broader geopolitical undercurrents continue to influence the landscape. Optimism stemming from recent progress in U.S.-China trade discussions has buoyed risk appetite, yet this is tempered by lingering concerns after a court ruling upheld former President Trump’s authority to maintain certain tariffs. This legal development introduces fresh layers of ambiguity, keeping the U.S. dollar on the defensive and lending indirect support to gold prices.
From a technical standpoint, gold remains confined within the narrowing bounds of a symmetrical triangle pattern—a classic sign of consolidation and potential volatility ahead. The price action reflects a broader indecisiveness prevalent across multiple asset classes, as traders await clearer macro signals before committing to directional moves.
Key support lies at 3301, 3330, and 3340, while resistance is seen at 3349, 3361, and 3375. Special attention should be paid to the critical 3330–3340 range, which has acted as a magnet for price in recent sessions. A decisive break and sustained hold above this zone—especially if supported by softer inflation data—could hand the bulls a tactical advantage, opening the door for a push toward higher resistance areas and renewed bullish momentum.
In summary, gold is at a technical and fundamental crossroads. Inflation data will likely determine whether the metal can break free from its current consolidation or remain range-bound amid ongoing uncertainty.

Analysis of Current Gold Trends and Trading RecommendationsYesterday, the daily K-line closed as a shooting star Doji with a long upper shadow, confirming a wide consolidation range between 3,300 and 3,350 for gold prices. In the short term, gold stabilizing above 3,250 is expected to maintain a mildly bullish trend within the consolidation, with focus on the 3,345-3,350 resistance zone today.
From a 4-hour perspective, support lies at 3,315-3,320. On pullbacks to this level, long positions can be considered for rebound continuation, while resistance stands at 3,350. The trading strategy remains centered on "buy low, sell high" within the 3,350-3,315 range.
Critical Monitoring: Closely track the progress of Sino-US trade negotiations and today's CPI data release, as both events may exacerbate market volatility and influence short-term trend direction.

6/11 Gold Analysis and Trading SignalsGood afternoon, traders!
Gold remains capped below the key resistance at 3350, with repeated failed breakouts. Meanwhile, strong support zones below are keeping the price range-bound in a narrow consolidation channel.
📉 Technical Outlook:
As higher lows continue to form, the trendline support is gradually shifting upwards. On the 30-minute chart, we now observe a potential double top pattern forming. If confirmed, it would signal a bearish reversal with the possibility of further downside.
🔍 Key Support Levels:
Watch for the 3330 level as initial support. If it’s broken decisively and the market fails to recover quickly, this may confirm the short-term double top and open the door for more aggressive selling.
On a broader timeframe, focus on 3320 as a critical support area.
📊 Fundamental Focus:
The key event today is the release of U.S. CPI data, which carries significant market-moving potential. A strong reading could be bearish for gold, supporting a shift in sentiment toward the downside.
📌 Today’s Trading Plan:
✅ Buy Zone: 3289–3272
✅ Sell Zone: 3358–3373
🔄 Intraday Levels for Flexible Scalping:
3348 / 3332 / 3319 / 3307 / 3293
Trade cautiously ahead of the CPI report, and keep position sizes moderate to mitigate volatility risk.

GOLD M30 intraday chart update for 11 June 25Hello Trader, Welcome to the US CPI Day
AS you can see that market is still below 3350 Psychological level with given rewards multi-time from that level
now all eyes on US CPI if market successfully breaks 3350-60 zone today the it will move towards 3370/80 or even 3400 psychological level
below 3350 psychological level market remains bearish for shorter term
Disclaimer: Forex is Risky

Gold Hits Target Zone — Uptrend May Continue if Support HoldsGold broke below the 3326–3316 support zone earlier today,
but found strong buying interest near 3300, rebounding into the 3340–3350 target range.
Despite facing resistance here, the 2-hour chart still shows an incomplete bullish formation,
suggesting potential for further upside.
—
📌 Key Technical Zones to Watch:
🔸 If price pulls back from the 3340–3350 resistance, monitor 3326 as the key support
🔸 If 3326 holds, bulls may regain control and push the price swiftly toward
→ 3358–3368 resistance zone
🔸 3352 is a critical bull/bear pivot point — a breakout above it could signal a renewed bullish breakout
—
🎯 Trade Strategy:
✅ Long positions may consider partial profit-taking near resistance
✅ If price pulls back and holds above support, re-entry opportunities may arise
⚠️ Watch volume closely and avoid chasing high if momentum stalls

gold on bullish#XAUUSD Price still at same movement, expecting bullish to break 3345.
Await 2 times breakout at 3326 for buy, target 3345,SL 3315.
Below the 3313 have a strong bearish continuation, target 3280
Continue buying on multiple breakout above 3342

GOLD M30 Intraday Chart Update For 10 June 2025Hello Traders
Market tested 3302 level this morning and move back towards 3340 SBR structure zone
all eyes on 3340 level clear breakout once market breaks 3340 level it will move towards 3350 Psychological Level or even 3365
Key Support for the day 3300 Psychological Level
Disclaimer: Forex is Risky

Gold: Market Analysis and Trading StrategiesSo far, although the price has risen, it has not yet broken through the upper resistance, and the lower support remains intact. Overall, the market is still in a narrow range of consolidation. From a technical perspective, the 2-hour chart shows a bullish bias, indicating a potential for continued upward movement in the short term.
However, if during this consolidation phase the price breaks below the key support at 3309, it is likely to further test the support zone around 3296–3288.
At this stage, traders can consider entering light long positions and gradually add to them on dips to reduce the average entry price. For more conservative traders, it's advisable to wait until a clear breakout occurs before taking action.
Watch the 3338–3352 area for potential short opportunities as it's a key resistance zone, and the 3303–3288 range for long entries as it offers strong support. Trading near these levels generally carries lower risk and a higher probability of profit.

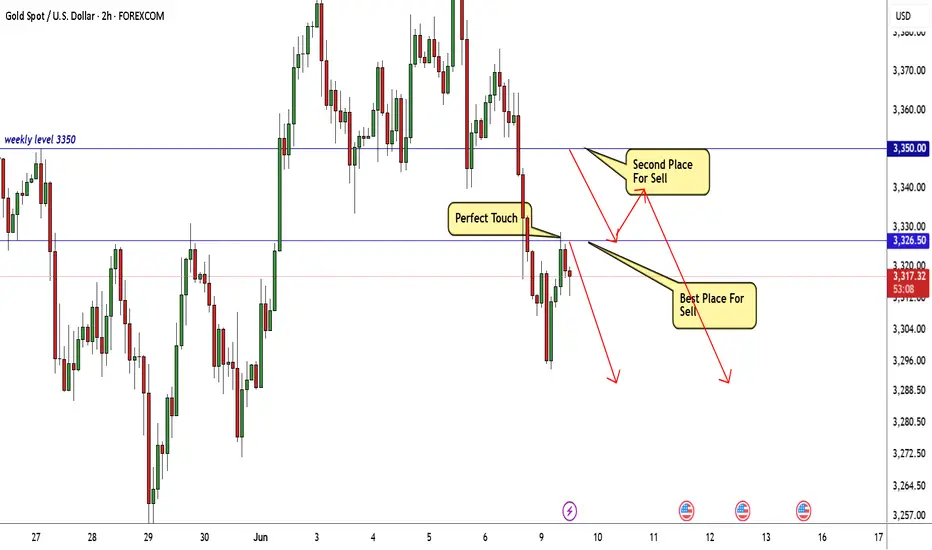
GOLD Best 2 Places For Sell Very Clear , Ready For 500 Pips ?Here is my opinion on gold on 2H T.F , we have a very good bearish price action and we have a very good retest for broken support and new res , so i think 3326.00 will be a very good place to sell and targeting 250 pips at least , also if the price go up a little 3350.00 will be the last place we can sell from it and targeting 500 pips .
XAUUSD Analysis today : Drop to monthly support?XAUUSD with NFP breakdown from significant daily support price has dropped nearly to monthly support and may continue to drop to retest the monthly support? As there is a rejection from the monthly high and the market is almost nearly to monthly gap open, it is highly likely price may retest the monthly support.
As with new monthly open, we see price has retraced to the significant intra day resistance to retest the level 3328.00
As the market started to reject back to the major direction of the trend, it is mostly probable that the price may continue to drop to this long term support level
3289.32

GOLD Intraday Chart Update For 9 June 2025Good Morning Traders,
As you can see that market try to fill the previous week opening gap and in that situation we may wait for a while to fill the gap and buying zone is located at 3265-3285, once market gives us a bounce back it will may move back to 3330-3340 SBR Zone
however market try to sustain above 3300 Psychological Level but keep in mind US China Tariff Deal which is due in this week
also if market sustains below 3300 psychological level successfully then it will move towards 3245-55 zone and final destination maybe 3200 Psychological
Disclaimer: Forex is Risky

Gold will still fall below 3,300 next week!
📣World Situation:
Gold prices fell for the second consecutive trading day on Friday, but are still expected to close with a gain of more than 1.30% as traders readjusted expectations for Fed policy easing after a stronger-than-expected US non-farm payrolls report. At the time of writing, XAU/USD was trading at $3,322, down 0.84% on a daily basis.
The US Bureau of Labor Statistics (BLS) reported that the labor market continued to show resilience, with the unemployment rate remaining stable from April. Meanwhile, Wall Street rebounded modestly from Thursday's losses despite increased political tensions between President Donald Trump and Tesla CEO Elon Musk after the House of Representatives approved a bill to raise the US debt ceiling.
Next Wednesday: ① Data: API crude oil inventory in the United States for the week ending June 6, US May unadjusted CPI annual rate, May seasonally adjusted CPI monthly rate, May seasonally adjusted core CPI monthly rate, May unadjusted core CPI annual rate, pay attention to real-time data changes.
Geopolitical risks and trade tensions have eased, and the call between Chinese and American leaders has released a signal of easing. Trump said that the trade negotiations have reached a "positive conclusion", weakening the attractiveness of gold as a safe-haven asset.
🔥 Technical side:
Based on the resistance and support levels of gold prices on the 4-hour chart, NOVA sorted out the important key areas as follows:
Resistance: $3347, $3400
Support: $3252, $3202

Geopolitical Undercurrents Support Gold as NFP LoomsTVC:GOLD OANDA:XAUUSD Gold hovers near $3,370 after failing to hold above $3,374, where previous support has turned into resistance. Price remains trapped between TL2 and TL3, with short-term direction hinging on tonight’s U.S. NFP data (130K jobs expected, 3.7% YoY wage growth). A strong report may trigger a drop toward the $3,342–$3,325 support zone, while weaker data could spark a bullish breakout toward $3,402.
Although Trump and Xi agreed to restart trade talks, deep fractures remain over export controls, Taiwan, and rare earth supply. These unresolved issues suggest geopolitical risk is far from over, offering medium-term support for CAPITALCOM:GOLD gold despite recent risk-on flows.
Resistance : 3,374 , 3,402
Support : 3,342 , 3,325

GOLD Intraday M30 Chart For 6 June 25As you can see that Market still is in strong range and we are still waiting for clear breakout
NFP main event of the day and remains watchable
If Market break 3335 successfully today then it will move towards 3310
above 3345-50 market remain slightly Bullish
Disclaimer: Forex is Risky

Gold= Breaks Resistance by Bullish Patterns + Geopolitical BoostGold ( OANDA:XAUUSD ) touched $3,337 as I expected in my previous idea .
Gold has now managed to break the Resistance lines and is trying to break the Resistance zone($3,387-$3,357) .
From a Classic Technical Analysis perspective, two Bullish Reversal Patterns are clearly visible on the Gold chart :
Descending Broadening Wedge Pattern
Inverse Head and Shoulders Pattern
According to Elliott Wave theory , by breaking the Resistance zone($3,387-$3,357) , we can confirm the start of an impulsive wave .
Also, given the increasing tension between Ukraine and Russia in recent days, there is a possibility that the price of Gold will increase due to the increased tensions .
I expect Gold to start rising again after a pullback to the neckline and resistance lines , and after breaking the Resistance zone($3,387-$3,357) , to rise to the target I have indicated on the chart.
Note: If Gold touches $3,299 , we should expect further declines.
Note: There is a possibility of emotional movements in the chart today when Fed Chair Powell speaks.
Gold Analyze ( XAUUSD ), 2-hour time frame.
Be sure to follow the updated ideas.
Do not forget to put a Stop loss for your positions (For every position you want to open).
Please follow your strategy; this is just my idea, and I will gladly see your ideas in this post.
Please do not forget the ✅' like '✅ button 🙏😊 & Share it with your friends; thanks, and Trade safe.

Safe-Haven Demand May Drive Gold Prices Higher✅ Today’s ADP report came in bullish for gold,
✅ Meanwhile, the Federal Reserve’s Beige Book reveals:
A slight slowdown in economic activity
Increased policy uncertainty and price pressures for businesses and consumers
An overall pessimistic economic outlook
📌 Combined with ongoing geopolitical tensions, this creates a supportive backdrop for safe-haven buying in gold.
🔍 Technical Outlook (1D Chart):
Gold is still facing a bearish divergence on the daily chart. For this to resolve, the market must choose between:
1️⃣ A strong breakout with volume, pushing toward 3430–3450
2️⃣ A pullback to repair structure, including filling the gap below 3300, which may later fuel a rally toward 3500+ if bullish catalysts arise
📅 Key Events to Watch This Week:
Thursday: Initial Jobless Claims
Friday: NFP (Nonfarm Payrolls)
⚠️ Also monitor developments on trade tariffs, which may affect market sentiment
📊 Short-Term Trade Plan (Range Strategy):
🎯 Key levels to watch:
Resistance: around 3400
Support: near 3366
📌 Consider range trading between 3408–3358, selling highs and buying dips with strict risk control.

GOLD H1 Chart Update For 4 June 25Good Morning Traders,
As you can see that market is in swing range since starting the week but right now main strong 3400 resistance remains intact, Once market clearly breaks 3400 then it will move towards 3420 or even 3440
Intraday swing trading range is 3440-3480
If market break 3325 level successfully then it will move towards 3310 or even 3290
Scalping range 3345-55 for buy side
Good Luck
Disclaimer: Forex is Risky

6/4 Gold Analysis and Trading SignalsGood morning, everyone!
Gold experienced a strong intraday reversal yesterday, pulling back sharply after an initial rally. The price rebounded after entering our 3338–3321 buy zone, and is now approaching the 3362 resistance level. Technically, the short-term structure remains within an ascending rebound channel.
Key resistance levels to watch today:
First resistance near 3378
Psychological level at 3400
Extended resistance zone at 3416–3438
If price stalls near 3362 and pulls back, support is expected around 3345–3336, which could form a secondary bottom. If the rejection happens closer to 3380, then 3358–3352 is the support zone to watch. Should gold rally into the 3400–3416 area, keep a close eye on 3385, 3372, and 3365 as potential pullback supports.
📉 Technical Outlook:
4H chart: Price remains in a mild uptrend channel, with key structural support at 3323–3307. However, volume is not confirming the rally, and a potential double top formation cannot be ruled out.
1H chart: Strong support lies at 3343. The MACD is at a decision point, with bulls slightly favored. If volume increases, gold may retest the 3390 high or even push higher.
🗞 Fundamental Factors:
Today, focus on the ADP Employment Report and key Fed-related news during the U.S. session, which may create sharp intraday volatility or alter the trend trajectory. Be especially alert during the New York session.
📌 Today’s Trade Plan:
Sell between 3418–3438
Buy between 3318–3306
Key levels for tactical trades:
3413 / 3392 / 3381 /3365 / 3358 / 3343 / 3328
Strategy Outlook:
Maintain a “sell high, buy low” intraday approach, focus on volume-driven breakouts, and avoid chasing extreme moves blindly.

XAU/USD Bearish Rejection at Resistance – Potential Drop Ahead!XAU/USD Bearish Rejection at Resistance – Potential Drop Ahead! 💥
🔍 Technical Analysis:
Instrument: Gold vs US Dollar (XAU/USD)
Timeframe: Daily
Current Price: $3,363.26
Resistance Zone: $3,380 – $3,470
Support Zone: $2,970 – $3,100
🧠 Market Context:
Gold has recently approached a well-defined resistance zone near the $3,380–$3,470 range. Price action shows multiple rejection wicks and failed attempts to break above this level, indicating strong selling pressure from bears. 🐻
The current candlestick structure suggests the market is printing lower highs, which may indicate a transition from a consolidation phase into a potential bearish trend.
📉 Projection:
The chart projects a move down toward the support zone, around $2,970–$3,100, possibly due to:
Repeated rejections at the resistance zone 🔄
Lack of bullish momentum near highs ⚠️
Bearish engulfing or reversal candlestick formations 🔻
✅ Key Levels to Watch:
Level Type Price Zone Action
🔴 Resistance $3,380 – $3,470 Strong rejection expected
🟢 Support $2,970 – $3,100 Major demand zone; potential bounce
🧭 Trading Outlook:
⚠️ If price fails to break above the resistance zone, short opportunities may develop with a target near the support zone. A confirmed break and close below $3,300 would strengthen bearish sentiment.
📌 Bearish Bias Maintained Until Resistance Breaks

Buy or Sell XAUUSD Gold? How the Stock Market Could Decide!🚨 Market Breakdown: Gold (XAUUSD) 🪙📉📊
At the moment, I’m closely monitoring XAUUSD (Gold) 🔍. Before diving in, it's crucial to zoom out and gain a macro perspective 🌍. This means analyzing key support and resistance levels on the weekly and daily timeframes 📅 using price action as our primary guide.
📈 Gold has seen a strong rally — it’s overextended at this point. A deeper pullback could be on the cards. If we get that retracement alongside a bullish break of structure, I’ll be eyeing a potential long setup 🛒.
However, this bias is conditional 🔄. If the stock market pulls back, that could strengthen the case for a gold buy. On the flip side, if equities continue to rally, I’d likely shift toward a bearish stance on gold 🐻.
🎥 Everything is broken down clearly in the video.
❗️Disclaimer: This is not financial advice. The analysis shared is for educational and informational purposes only. Always do your own research and manage your risk accordingly.

XAUUSD/Gold on 3rd May 2025As yesterday I posted that golds is in major uptrend and it is still active. On daily timeframe gold made breakout upward direction of channel and 3382. As I said gold made gap wile opening on Monday so it was strongly bullish, now we want it to fill the gap. And did it is first rejection and coming down. No gold is trading at 3360-65 range, and it is support, soon if it get's break toward downward then price can surge to 3323-3330. Waiting for confirmation and then execute trade.
Key point.
Support - 3364, 3330, 3313
Resistance - 3386, 3400, 3414
If you like it do follow and share.
Any Query Reach Us or comment down.
Follow for more updates.
Rudra Vasaikar Wishes You A Great And Very Amazing Trading Life. Trade Safe, Trade Right.
RISK WARNING 🔴 🔴 🔴
There is high risk of loss in Trading Forex, Crypto, Indices, CFDs, Features and Stocks. Choose your trade wisely and confidently, please see if such trading is appropriate for you or not. Past performance is not indicative of future results. Highly recommended - Information provided by Pro Trading Point are for Educational purpose only. Do your investment according to your own risk. Any type of loss is not our responsibility.
HAPPY TRADING.
#gold #xauusd #xauusdtrading #goldtrading #goldanalysis #forextrading #forex #trendline #goldsignals #goldnews goldlatestanalysis #xauusdtradesetup #forextradingguide #fxgold

GOLD H1 Intraday Chart For 3 June 2025Hello Traders,
GOLD is in mid term Bullish Trend for now as we already captured nice pips yesterday with directional sequence
but now all eyes on 3400 Psychological Level Breakout once it will break market will move towards 3430
for market in is consolidation zone between 3340-60 and expected to move back towards 3380 or even 90
if market breaks 3330 successfully today then it will move towards 3330 Psychological Level
Disclaimer: Forex is Risky
