Gold: Consolidation trend remains unbrokenGold has just tested the 4020-4030 resistance zone, only to pull back under pressure and retrace. This indicates that the resistance zone remains effective today. With the non-farm payroll data not being released, gold prices are expected to continue their sideways trend.
From the 4-hour chart perspective, focus on the short-term resistance at 4020-4030. The key pivot point for bull-bear dynamics lies at 4045-4055. For support levels, watch the short-term zone at 3960-3970, with critical attention on the previous low support at 3888-3890.
Our trading strategy, which was provided this morning, has already been validated by the market. We still recommend prioritizing short positions on rebounds for now, and caution against chasing the trend.
Xauusdsetup

XAU/USD Intraday Plan — 3989 Support Holding, Next Stop 4042?Price has broken above 3989 and pulled back to retest the 50MA, which is now holding as support. If bullish momentum continues, the 50MA looks ready to cross above the 200MA, which would strengthen the short-term bullish momentum.
The next resistance is at 4042. A clean break above 4042 could open the move toward 4090.
If buyers fail to hold above 3989, price may slide back into the First Reaction Zone (3957–3918).
Failure to hold that zone could bring the Support Zone and even the HTF Support Zone back into play.
📌Key Levels to Watch:
Resistance:
4042
4090
4142
Support:
3989
3957
3918
3884
3851
3820
3781
🔎 Fundamental Focus:
Not many high-impact releases today. We do have several FOMC members speaking, along with Prelim UoM Consumer Sentiment and Inflation Expectations later.
As always, keep in mind that geopolitical and broader macro sentiment continue to play a major role here — even with a quiet calendar, gold can still react to headlines.

Gold Trade Set Up Secured 200 pips!Beautiful set up, coming up to sweep BSL, tap into 5m supply and inverted 5m FVG to target SSL and 1h FVG

Market volatility, trade steadily.#XAUUSD TVC:GOLD OANDA:XAUUSD
As mentioned last night, gold prices failed to break below the important short-term support level of 3965, so we maintain our bullish view. Although the intraday volatility was not high, the consolidation process can be seen as gold accumulating positions in the short term. Market breakout requires patience. Currently, the daily MA5 and MA10 moving averages are converging around 3980, which is also where the 4-hour middle band is located. The key resistance level in the short term is in the 4015-4030 area. A break above this level could lead to further gains towards 4050-4080.
It's important to be cautious given the recent volatile market with poor continuity. Therefore, even if a breakout occurs today, it is not advisable to rush to buy. Instead, wait for a pullback before entering the market to avoid being trapped by blindly chasing highs. The 3980-3965range remains the ideal entry point for bulls. Maintaining patience is always a key element in trading.

Maintain the morning's trading strategyDue to the government shutdown, the U.S. Bureau of Labor Statistics failed to issue the October Nonfarm Payrolls report as scheduled, marking the second consecutive "absence" of the report.
Therefore, for today's U.S. trading session, we will maintain the morning's trading strategy and continue to treat the market as a volatile trend. We will focus on short-selling on rebounds, adopt a "observe more, trade less" approach, refrain from chasing trades cautiously, and patiently wait for key levels to enter positions.

Gold: Trade Flexibly Within the 3963–4030 RangeDue to the U.S. government shutdown, NFP data has been delayed for two consecutive months and the CPI cycle has also experienced its first full interruption. Congress is currently negotiating, and expectations suggest the government may reopen by mid-month — a positive sign for the market.
If October and November labor data are released together by the end of the month, along with the delayed CPI update, this could significantly reshape Fed policy expectations:
Strong jobs and sticky inflation → Fed may delay rate cuts
Signs of economic slowdown → Rate-cut expectations strengthen
A concentrated release of key economic data will likely increase market volatility. Opportunities and risks will rise together, so risk management is essential.
From a technical standpoint, yesterday’s intraday spike and pullback reflected the tug-of-war between safe-haven demand and risk aversion. Selling pressure above 4006 capped upside momentum, but dip-buying interest allowed price to reclaim the 4000 level. The tug-of-war continues.
On the 4-hour chart, moving averages are starting to converge, with price holding above the MA60 but no clear directional signal yet. Key resistance remains at 4030/4050/4080-4100, while support sits at 3988-3982, with the broader support zone at 3948-3921.
Short-term structure on the 30M and 1H charts is bearish, suggesting potential further downside. Therefore, the 3988-3982 support area will be critical — holding above it keeps room for a bullish reversal.
Trading Strategy:
Medium- to long-term: accumulate long positions gradually
Short-term: trade the range — sell highs, buy dips
If price breaks key levels, consider reversal trades; in this tug-of-war environment, flexible strategies may capture better opportunities

XAUUSD: Short on rebounds ahead of the Non-Farm PayrollsIt closed around the 3977 level on Thursday, with the lowest touching around 3964.4 before finishing in a range-bound move, which also hit the 3960-3970 zone I indicated yesterday. I also kept emphasizing yesterday not to chase long positions at high levels.
Gold faces heavy resistance above. The bulls can only break through if driven by significant bullish news; otherwise, we will continue to stick to shorting on rebounds. With the Non-Farm Payrolls report due this Friday, we will maintain the approach of shorting on rebounds during the morning.
Looking at the 4-hour chart, the immediate resistance above is focused on the 4020-4025 zone, with the key bull-bear watershed at 4047-4055. For short-term support, watch the 3960-3970 area, while the key support lies at the previous low around 3888-3890.
In terms of operation, I still recommend prioritizing shorting on rebounds. For mid-range levels, we should always adhere to observing more and acting less, be cautious about chasing orders, and patiently wait for entry at key levels.
Trading Strategy:
Sell 4010 - 4020
SL 4030
TP 3980 - 3970 - 3960
Buy 3920 - 3930
SL 3910
TP 3950 - 3960 - 3970

Gold Trade Set Up Nov 7 2025Price has lots of SSL to be swept to the downside so if price continues to make LH/LL on the 15m i will want to see a sweep of internal BSL and respect this 15m FVG to target PDL and lower SSL

GoldXAUUSD
- Symmetrical Triangle as an corrective pattern in Short Time Frame
- Break of Structure
- RSI - Divergence
- Completed " 12345 " Impulsive Waves and " ABC " Corrective Waves
- Change of Characteristics

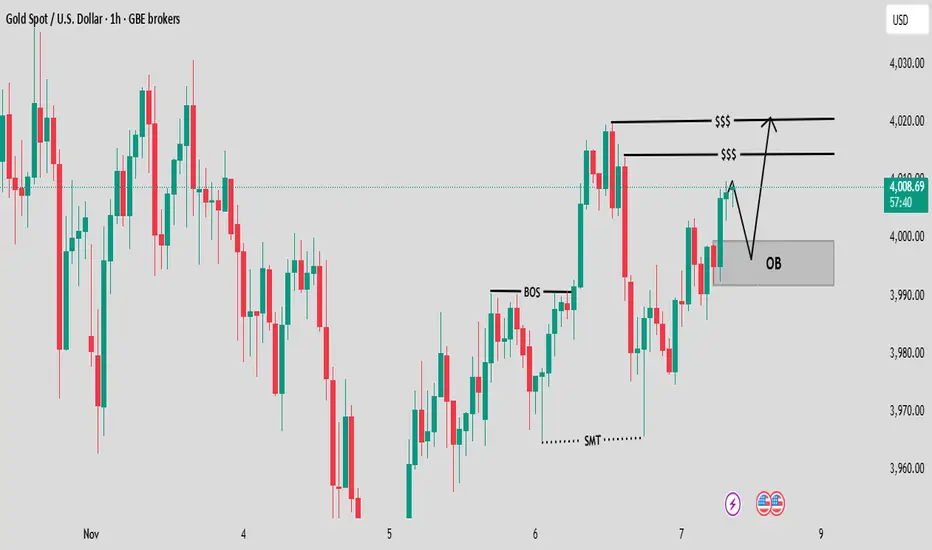
XAUUSD: Bullish Structure Shift Targeting Liquidity Above OB ?Break of Structure (BOS): There's a clear "BOS" labeled, indicating that the price has broken above a previous lower high. This is typically interpreted as a shift from a short-term downtrend (or consolidation) to an uptrend (or a structural move higher).
Order Block (OB): An "OB" (Order Block) is highlighted. This is a zone where a significant number of buy orders are believed to have been placed, making it a potential support area where price might retrace before moving higher.
Sell-Side Liquidity (BOS/$$$): The areas labeled "$$$" above the recent high represent liquidity. These are points where stop-loss orders from short sellers or pending sell orders are clustered, making them attractive targets for institutional traders to drive the price toward, often causing a quick move through that level.
Bearish Divergence (SMT): The "SMT" (Smart Money Technique) is marked, which often refers to a divergence between two correlated assets (like Gold and a US Dollar index) or a specific pattern where the low of one asset failed to reach the low of another, suggesting institutional manipulation or a short-term reversal (in this case, preceding the BOS).
Projected Move: The arrows illustrate a common trading hypothesis: the price is expected to retrace to the Order Block (OB), find support there, and then rally to take out the Sell-Side Liquidity ($$$) above the previous highs.
GOLD HIGH PROBABILITY SETUPS SOON!!!🚨 XAUUSD HIGH PROBABILITY SELL/BUY SETUP 🚨
* Here We Can See Clearly The Next Potential Moves For GOLD Coming Hours/Days.
* Keep Your Eyes Close On Your Trading Positions.
* Happy PIP Hunting Traders.
FXKILLA.

Gold Price Outlook – Trade Setup (XAU/USD)📊 Technical Structure
OANDA:XAUUSD Gold (XAU/USD) trades near $3,996, struggling to gain clear direction after a short-lived rebound. The chart shows price capped by a descending trendline and the Resistance Zone at $4,001–$4,005, while Support lies between $3,977–$3,981.
Technically, gold remains under mild downward pressure. Unless the price achieves sustained acceptance above $4,006, rallies are likely to attract sellers. A break below $3,980 could trigger fresh momentum toward $3,965, while holding above $4,000 may allow brief consolidation before another leg lower.
🎯 Trade Setup
Idea: Sell near resistance amid capped bullish momentum.
Entry: $4,000 – $4,005
Stop Loss: $4,006
Take Profit 1: $3,981
Take Profit 2: $3,977
Risk–Reward Ratio: ≈ 1 : 5.13
If gold decisively closes above $4,010, the short setup becomes invalid, signalling renewed upside toward $4,020.
🌐 Macro Background
Gold prices are finding moderate support as safe-haven flows return amid political uncertainty and weak U.S. data, while Fed rate cut expectations underpin sentiment.
As FXStreet’s Haresh Menghani reports, “Concerns over the economic fallout from the prolonged U.S. government shutdown and renewed Fed rate cut bets drive safe-haven demand for gold.” 【FXStreet】
Safe-Haven Demand: With the U.S. government shutdown entering its 38th day, investor sentiment remains cautious. The Congressional Budget Office estimates a 1–2% hit to GDP if the impasse continues.
Legal and Policy Uncertainty: The U.S. Supreme Court’s review of Trump’s 1977 emergency powers–based tariffs adds legal uncertainty to trade outlook, further boosting gold’s defensive appeal.
Labor Market Weakness: Private data from Revelio Labs indicated a net job loss of 9,100 in October, while government payrolls declined by over 22,000, pointing to labor market cooling.
Fed Rate Cut Bets: The CME FedWatch Tool now shows a 67% probability of a December rate cut, up from 60% a week earlier. This weighed on the U.S. Dollar, supporting gold despite intermittent profit-taking.
However, with gold struggling to break cleanly above $4,000, traders remain cautious—suggesting a “fade-the-rally” approach is still favoured until clear directional confirmation.
🔑 Key Technical Levels
Resistance: $4,001 – $4,005
Support: $3,977 – $3,981
Psychological Level: $4,000
📌 Trade Summary
Gold’s momentum remains mixed—safe-haven flows and Fed cut bets support dips, but strong resistance near $4,000 continues to cap rallies. The short bias remains valid below $4,006, with room for a move toward $3,970 or lower if sellers regain control.
⚠️ Disclaimer
This analysis is for reference only and does not constitute trading advice. Trading involves significant risk, and proper risk management is essential.

Gold Trade Set Up Secured 450 pipsSet up played out perfectly, sweeping external BSL, tapping 15m supply to target lower SSL levels

XAUUSD: The resistance level at 4020 remains strongGold has attempted to break through the 4020 resistance level several times today but failed. Coupled with the fact that the U.S. initial jobless claims data has not yet been released, it has now re-entered a correction phase.
The resistance level at 4020 remains strong.
For support, the short-term level is still at 3960-3970,and the key previous low support at 3888-3890.
The trading strategy can still refer to our analysis from this morning.

ANFIBO | XAUUSD - Stuck in Sideway channel [11.6.2025]Hi guys, Anfibo's here!
XAUUSD Analysis – Daily Trading Plan
Overall Picture:
At present, OANDA:XAUUSD is moving sideways within a well-defined H1 channel, showing signs of short-term consolidation after recent volatility. The market is currently lacking a clear directional bias, as both buyers and sellers are testing the upper and lower bounds of this intraday structure. Such conditions often favor range-trading strategies, where precision and timing become crucial for capturing short bursts of momentum.
In this context, our plan today remains straightforward and tactical — trade directly off the trendlines of the channel. In other words, we will look to buy at the lower boundary of the range and sell near the upper boundary, while also being prepared to switch positions if a breakout occurs in either direction.
Trading Plan for Today:
>>> SELL ZONE:
(1) ENTRY: 4015 - 4025
SL: 4030
TP: 4050
(2) ENTRY: 4060 - 4080
SL: 4090
TP: 4000 - 3955
Risk Management:
- Stick to small-to-medium positions within the range; increase size only on confirmed breakouts.
- Keep stops tight, as sideways phases tend to trigger false signals.
- Maintain Risk:Reward ≥ 1:2 and avoid overtrading in choppy conditions.
- Reassess bias once the H1 channel is clearly broken.
Conclusion:
Gold is currently in a sideways consolidation phase within its H1 channel, awaiting fresh catalysts to determine direction. Until a decisive breakout occurs, the most effective approach is range trading — buying near support, selling near resistance, and reacting dynamically to any confirmed breakout.
The plan today is simple yet strategic:
Patience and discipline will be key to capitalizing on this quiet yet potentially explosive setup.
HAVE A NICE DAY, GUYS!

XAUUSD LONG SETUP INTRADAY ( NOV 06, 2025 )If you have doubt on our trades you can test in demo.
OANDA:XAUUSD LONG SETUP
EP: 3993.469
TP: 4017.410
SL: 3981.518
Trade Ideas:
Idea is clearly shown on chart + we have some secret psychologies and tools behind this.
Trade Signal:
I provide trade signals here so follow my account and you can check my previous analysis. So don't miss trade opportunity so follow must.

XAUUSD SETUP-2 INTRADAY ( NOV 06, 2025 )If you have doubt on our trades you can test in demo.
OANDA:XAUUSD SHORT SETUP
EP: 4018.359
TP: 3994.222
SL: 4030.344
Trade Ideas:
Idea is clearly shown on chart + we have some secret psychologies and tools behind this.
Trade Signal:
I provide trade signals here so follow my account and you can check my previous analysis. So don't miss trade opportunity so follow must.

Gold Trade Set Up Nov 6 2025Price shifted structure to bullish during Asia and London on the 1h but on the 4h price is overbought and is sitting at a strong resistance so i would only buy if price can break and close above supply and most recent 15m swing high but if price stays closed below resistance and respects supply i will look to take sells back down to lower demand zones and SSL levels

GoldXAUUSD
- Symmetrical Triangle as an corrective pattern in Short Time Frame
- Break of Structure
- Order Block
- Change of Characteristics
- RSI - Divergence

XAU/USD (Gold) 1H: Bullish BOS & Supply Zone Testthe price of Gold attempting to move higher after a significant drop earlier in the week. The key elements highlighted are:
Current Price Action: The price is currently trading around $3,987.20 and is testing a key resistance zone.
1H Supply Zone: A supply zone is identified between roughly $3,990 and $4,000. This area represents a concentration of selling pressure.
Break of Structure (BOS): There are multiple "BOS" labels, which indicate a Change of Character (CHoCH) or continuation of the trend.
The recent upward move has caused a BOS just below the supply zone, signaling an immediate shift towards bullish momentum.
1H Order Block (OB): A bullish Order Block (OB) or demand zone is identified at the bottom of the recent move, roughly between $3,930 and $3,950. This is a likely area for buyers to step in if the price retraces.
Stop-Loss Hunt (SSS): The "SSS" (likely standing for Sell-Side Liquidity or Stop-Loss Sweep) indicates an area of liquidity that could be targeted before the price moves up.
Bullish Scenario: The large arrow suggests a strong bullish expectation. The price is anticipated to break through the immediate 1H Supply zone (breaking the BOS at the high) and continue moving higher, potentially targeting levels above $4,040.

Gold: Support at 4006–3994, Resistance Near 4030Yesterday, gold broke above the 30-minute MA60 resistance and then pulled back to retest the level, successfully turning it into support. After confirming the support, price continued to grind higher today, reaching around 4020. The MA60 remains the core support for this upward structure. Unless the market enters a strong one-way rally, a pullback is likely, with the MA20/MA30 serving as secondary support levels during the process.
On the 4-hour chart, price is currently testing the MA60 resistance while moving averages still maintain a bullish alignment. If price can successfully complete a resistance-to-support shift around the 4006-3994 zone on the 4H timeframe, it may open the door for a move toward the 4080-4100 resistance region. The first key resistance sits near 4030. Therefore, if price pulls back after testing 4030 but holds above the 4006-3994 support zone, it will retain potential to test 4050/4080-4100 area.

ElDoradoFx – GOLD ANALYSIS (06/11/2025, LONDON SESSION)
1️⃣ Market Overview
Gold extends its bullish move into the London session after breaking above $3,995–$4,000, confirming short-term momentum shift from consolidation to continuation.
The metal currently trades near $4,005, where sellers are reacting at a key H1 supply zone aligned with a descending trendline from previous highs.
Overall sentiment remains cautiously bullish, with potential pullbacks expected before continuation toward $4,026–$4,046.
⸻
2️⃣ Technical Breakdown
📆 D1 (Daily):
Price sustains above the 100EMA and remains in an ongoing bullish recovery phase.
RSI ≈ 52, showing neutral-to-bullish structure. A confirmed daily close above $4,012 would strengthen the path to $4,026–$4,046 next.
⏰ H1 (Hourly):
Strong breakout candle above $3,995 with MACD turning positive.
Current resistance seen around $4,010–$4,015. RSI near 68 signals slight overextension, hinting that a minor pullback could occur before another push upward.
🕒 15M–5M (Intraday):
Price broke through descending structure and is now forming rejections near $4,010.
Short-term support sits between $3,985–$3,975, coinciding with EMAs and structure demand.
Expect a possible retest of this area for continuation if buyers remain in control.
⸻
3️⃣ Fibonacci Analysis (Last swing $3,960 → $4,010)
• 38.2% = $3,990
• 50.0% = $3,985
• 61.8% = $3,979
🎯 Golden Zone: $3,990 – $3,979 → Potential bullish continuation area.
⸻
4️⃣ Fundamental Watch
• The US Dollar Index (DXY) is holding below 106, favoring gold’s strength.
• US Jobless Claims and Fed speeches later today may inject volatility during the NY session.
• London is likely to trade inside the $3,985–$4,010 band until new catalysts emerge.
⸻
5️⃣ Analyst Summary
Gold maintains an intraday bullish bias while trading above $3,975.
The ideal scenario is a pullback toward $3,990–$3,979 (Golden Zone) before the next impulsive move up.
A sustained break above $4,015 would confirm fresh momentum targeting $4,026 → $4,046, while failure to hold above $3,975 could shift bias back toward $3,960.
⸻
6️⃣ Final Bias Summary
📈 Primary Bias: Bullish continuation above $3,975
📉 Bearish Invalidity: Below $3,970
🎯 Upside Targets: $4,026 → $4,046 → $4,075
⚠️ Key Zone to Watch: $3,990 – $3,979 (Golden Zone retest area)
⸻
— ElDoradoFx PREMIUM 3.0 Team 🚀

XAU/USD Intraday Plan | Buyers Back in Control?After a period of consolidation, gold has managed to break back above the 3989 level (now turned support) and is currently trading around 4005. Price has also reclaimed the MA50 and is now pushing above the MA200, suggesting buyers are attempting to regain control.
The next resistance sits at 4042 — a confirmed break and hold above this level would open the way for further upside toward 4090.
On the downside, if price fails to hold above 3989, we could see another pullback into the First Reaction Zone (3957–3918). If selling pressure continues we may see the lower support levels tested.
📌 Key Levels to Watch:
Resistance:
4,042
4,090
4,142
Support:
3,989
3,957
3,918
3,884
3,851
🔎 Fundamental Focus
No major economic data releases today. However, a full slate of FOMC member speeches throughout the session could introduce intraday volatility.
Keep in mind that headline risk remains high, and geopolitical / macro sentiment can still move gold even without scheduled news.
