Gold Price Outlook – Trade Setup (XAU/USD)📊 Technical Structure
OANDA:XAUUSD Gold (XAU/USD) continues to face resistance below the $3,995–$3,993 Resistance Zone, with repeated rejections suggesting weakening bullish momentum. Price action has formed lower highs near $3,990, signalling potential exhaustion.
The Support Zone sits around $3,929–$3,938, which previously acted as a springboard for short-term rebounds. The current structure favours a bearish correction, particularly if price fails to reclaim $3,995 on a sustained basis. A clean break below $3,950 would confirm bearish continuation toward the $3,930 area.
🎯 Trade Setup
Idea: Sell near resistance, target a drop toward support.
Entry: $3,985 – $3,993 (Resistance Zone retest)
Stop Loss: $3,996
Take Profit 1: $3,950
Take Profit 2: $3,930
Risk–Reward Ratio: ≈ 1 : 5.2
A break above $3,996 would invalidate the short setup and could open the door to retest $4,030.
🌐 Macro Background
Gold prices slipped to around $3,970 in Thursday’s Asian session, weighed down by stronger-than-expected US private payroll data and a resilient US Dollar.
As FXStreet’s Lallalit Srijandorn noted, “Gold edges lower below $4,000 as private payrolls rebound in October.” 【FXStreet】
ADP Employment Data: US companies added 42,000 jobs in October, rebounding from the previous month’s contraction, suggesting stabilization in the labor market. This data supports the Fed’s cautious tone and trims expectations for near-term rate cuts.
Fed Commentary: Several Fed officials, including Michael Barr, John Williams, and Christopher Waller, are scheduled to speak later today. Any hawkish remarks reinforcing the “higher for longer” narrative could further strengthen the USD and pressure gold.
Government Shutdown: The US government shutdown, now at 37 days, marks the longest in history. Political gridlock could lend some safe-haven support to gold, but so far, the impact has been muted compared to stronger USD dynamics.
In short, with the US labour market improving and Fed officials maintaining caution, gold’s upside remains limited, while macro bias supports near-term weakness.
🔑 Key Technical Levels
Resistance: $3,985 – $3,996
Support: $3,929 – $3,938
Psychological Level: $4,000
📌 Trade Summary
Gold (XAU/USD) remains under pressure below $4,000 as bullish momentum fades. The setup favours a short position from the $3,985–$3,993 zone, targeting a decline toward $3,930. A sustained break above $3,996 would invalidate this bias and shift focus to $4,030 resistance.
⚠️ Disclaimer
This analysis is for reference only and does not constitute trading advice. Trading involves significant risk, and proper risk management is essential.
Xauusdsetup

Gold Trade Set Up Nov 5 2025Price has pulled back up during the Asia session from yesterdays drop. On the 4h we are still bearish but on the 1h and 15m we are making HH/HL. We got a 15m supply price is close to testing so i want to see price either respect it and make internal 5m bearish structure to go lower to take out SSL/London lows or break and close above it to continue higher to PDH

xauusd ideaWe are waiting for our asset to reach our action zone, and based on the reaction, we’ll decide on our next moves.ALWAYS WAIT FOR A CONFIRMATION TO SEE IF THE PRICE VALIDATES THE ZONE.and you what is your vision of the EURUSD its interests me! i wait you in the commentar

ElDoradoFx – GOLD PRO ANALYSIS (05/11/2025, US SESSION)1️⃣ Market Overview
Gold holds steady around $3,965, consolidating after yesterday’s rebound from $3,932 lows. The US session opens ahead of ADP Employment and ISM Services PMI, which are likely to drive volatility.
The current price remains in a mid-term corrective phase after the sharp rally to $4,100, and sentiment leans mildly bullish as long as the $3,950 support remains intact.
⸻
2️⃣ Technical Breakdown
• Daily (D1): Gold continues its pullback after the rejection from $4,100, forming higher lows above $3,870 (100 EMA). RSI at 48 shows neutral-to-slight bullish momentum; no bearish divergence visible.
• H1: Structure is consolidative between $3,950 – $3,975 with resistance at 200 EMA and ascending trendline support beneath. Bulls are defending the trendline successfully so far.
• 15M–5M: Short-term compression forming a potential bullish breakout setup. MACD shows a flattening histogram with early signs of momentum reactivation to the upside.
⸻
3️⃣ Fibonacci Analysis
Last Swing: 3,987 → 3,928
• 38.2% → 3,950
• 50.0% → 3,957
• 61.8% → 3,965
🎯 Golden Zone: 3,950 – 3,965 (active reaction area aligning with trendline & 100 EMA on 15M).
⸻
4️⃣ High-Probability Trade Scenarios
📈 Buy Scenario (Main Bias)
• Entry Zone: 3,950 – 3,965 (within the Golden Zone).
• Targets: 3,975 → 3,990 → 4,010 → 4,045
• Stop Loss: Below 3,940
• Confirmation: 15M bullish engulfing, RSI > 60, and MACD crossover to positive.
💥 Breakout Buy Setup
• Trigger: Break and close above 3,975
• Retest Zone: 3,970 – 3,972
• Targets: 3,990 → 4,015 → 4,045 → 4,060
• Stop Loss: Below 3,960
⸻
📉 Sell Scenario (Countertrend)
• Entry Zone: 3,975 – 3,990 (supply zone near 200 EMA).
• Targets: 3,955 → 3,940 → 3,925
• Stop Loss: Above 3,995
• Confirmation: Bearish rejection candle or RSI divergence under 55.
⚡ Break & Retest Sell Setup
• Trigger: Break below 3,940
• Retest Zone: 3,945 – 3,950
• Targets: 3,925 → 3,905 → 3,880
• Stop Loss: Above 3,960
⸻
5️⃣ Fundamental Watch
• US ADP Non-Farm Employment Change – early indicator of Friday’s NFP.
• ISM Services PMI – potential volatility driver for DXY and XAUUSD correlation.
• Fed commentary and yield direction may influence session bias.
⚠️ High volatility expected during releases – avoid over-leveraging.
⸻
6️⃣ Key Technical Levels
Type Level (USD) Notes
Resistance 1 3,975 200 EMA + structure high
Resistance 2 3,990 Key supply & fib extension
Support 1 3,955 Intraday support
Support 2 3,940 Breakout validation point
Trendline Support 3,950 Golden Zone confluence
Breakout Triggers >3,975 / <3,940 Defines session direction
⸻
7️⃣ Analyst Summary
Gold is currently compressing within the Golden Zone ahead of US data. Market bias remains bullish above 3,950, with the possibility of a breakout toward 4,000–4,015 if resistance breaks cleanly.
A failure to hold above 3,950 will shift momentum short-term bearish toward 3,925 and below.
⸻
8️⃣ Final Bias Summary
📊 BULLISH while above 3,950, targeting 3,990 – 4,015
🔻 BEARISH only if price breaks below 3,940, targeting 3,925 – 3,905
— ElDoradoFx PREMIUM 3.0 Team 🚀
⸻

GOLD How to Trade the XAUUSD Range Breakout StrategyLet's cut straight to the chase on Gold (XAU/USD). Right now, the chart isn't giving us much to work with. We are locked solid in a textbook range-bound environment. 😒
If you compare this choppy, sideways action to the clear trends we've seen previously, the difference is stark. There is simply no directional conviction in the market at the moment; we're witnessing classic accumulation/distribution—or just plain indecision.
My focus is simple: Patience is your edge right now. I'm not interested in getting chopped up inside this consolidation zone. We are waiting for a concise, decisive move—a clean breakout—either above the high or below the low of this current range.. and a retest of the range. ⬆️⬇️
Bullish Scenario: A breakout above, followed by a successful re-test and fail. That's our green light for a long position, signaling momentum has shifted North. 🚀
Bearish Scenario: A breakdown and re-test of the range. That's the cue for a short opportunity, confirming bearish momentum. 📉
The breakout and re-test confirmation will be key. Until then, I'll stand aside and preserve capital. No setup, no trade. 🔥

XAU/USD Intraday Plan | Buyers Need 3989 BreakAfter breaking below the 3989 support level yesterday, gold tested the First Reaction Zone as anticipated, where buyers stepped in and defended the area.
Price is now trading around 3968, but still below both the MA50 and MA200, which keeps short-term momentum bearish.
For buyers to regain control, we need a clear break and hold above the 3989 level. A break above this area could open the move toward the 4042 resistance, with 4090 possible if momentum continues.
If price fails to reclaim the 3989 level, we may see another retest of the Reaction Zone. Failure to hold that area could expose the lower Support Zone and potentially the HTF Support Zone below.
📌 Key Levels to Watch:
Resistance:
3989
4042
4090
4120
Support:
3957
3918
3884
3851
3820
3781
🔎 Fundamental Focus:
Today has a few medium-to-high impact U.S. releases, including ADP Employment, and ISM Services PMI, which could influence intraday volatility. Later in the session, President Trump is scheduled to speak, which also has the potential to move markets depending on tone and messaging.

Gold Price Outlook – Trade Setup (XAU/USD)📊 Technical Structure
OANDA:XAUUSD Gold (XAU/USD) rebounded from the Support Zone ($3,929–$3,938), aligning with the ascending trendline drawn from late October lows. The price is attempting to recover toward the Resistance Zone ($3,985–$3,994) but remains within a broader corrective structure.
The bullish momentum looks corrective rather than impulsive, suggesting that unless gold breaks above $3,995 convincingly, sellers may re-emerge near resistance. The rising trendline remains a short-term guide; holding above $3,940 keeps the rebound bias valid.
🎯 Trade Setup
Entry: $3,929 – $3,938
Stop Loss: $3,925
Take Profit 1: $3,985
Take Profit 2: $3,994
Risk-Reward Ratio: ≈ 1 : 4.95
🌐 Macro Background
Gold is stabilizing near $3,950 after a sharp 1.8% sell-off on Tuesday, following renewed USD strength. As FXStreet’s Dhwani Mehta notes, “Gold is licking its wounds near $3,950... but downside risks remain intact ahead of U.S. data.” 【FXStreet】
USD Dynamics: The Dollar entered a bullish consolidation phase after the risk-off rally, with traders reducing bets on further Fed cuts this year. The CME FedWatch Tool shows less than a 70% chance of a December rate reduction.
Market Sentiment: The global tech-led equity sell-off drove risk aversion, causing investors to cover equity losses by selling gold positions.
Upcoming Data: Traders now focus on U.S. ADP employment and ISM Services PMI, both of which could reshape expectations for Fed policy. Strong readings could strengthen the USD and weigh on gold; weak figures might lift gold on renewed rate-cut bets.
Overall, gold’s short-term recovery remains fragile. A rebound toward $3,985–$3,995 could face resistance unless U.S. data disappoints.
🔑 Key Technical Levels
Resistance: $3,985 – $3,994
Support: $3,929 – $3,938
Trendline Support: $3,940
Psychological Level: $3,950
📌 Trade Summary
Gold (XAU/USD) is showing a corrective bounce after finding support near $3,930. While the setup allows for a short-term long trade toward $3,985–$3,994, traders should remain cautious as the broader sentiment stays bearish. A break below $3,925 would invalidate the rebound and reopen the path toward $3,900.
⚠️ Disclaimer
This analysis is for reference only and does not constitute trading advice. Trading involves significant risk, and proper risk management is essential.

Gold: Focus on Selling, Watch Resistance at 3960–3975Gold bounced after pulling back to the 3948–3921 support zone yesterday, but was capped by the 4H MA5 and fell back toward support again. On the 30-minute chart, the price action currently shows signs of a potential rebound, with the MA60 serving as the key upside resistance in today's session.
As mentioned during yesterday’s live updates, if the 3948–3921 support area breaks, the next major level to watch will be the 3800 psychological mark along with support from the daily MA60. At that stage, trading strategies should be adjusted based on real-time market behavior and sentiment.
Overall, the short-term bias remains bearish, favoring trend-following sell setups. For medium- to longer-term traders, gradual long positioning can be considered. However, volatility remains elevated in this phase, so risk control is essential—manage position size carefully and avoid emotional trading.

GOLD Potential Short!
HI,Traders !
#GOLD keeps growing
And we are bullish biased
Mid-term but the price will
Soon hit a horizontal resistance
Of 4027.04 from where a local
Bearish pullback is to
Be expected !
Comment and subscribe to help us grow !

Gold Trade Secured 250 Pips!Our sell set up played our perfectly, broke structure on the 15m, swept 5m BSL, took sells to SSL. What a clean set up

Gold Trade Set Up Nov 4 2025Price is making LL/LH on the 1h and 15m so i am still bearish but first i want to see a sweep of internal BSL followed by 5m bearish candle close to target SSL/PDL

How to keep up with the rhythm of triangle pattern consolidation#XAUUSD OANDA:XAUUSD TVC:GOLD
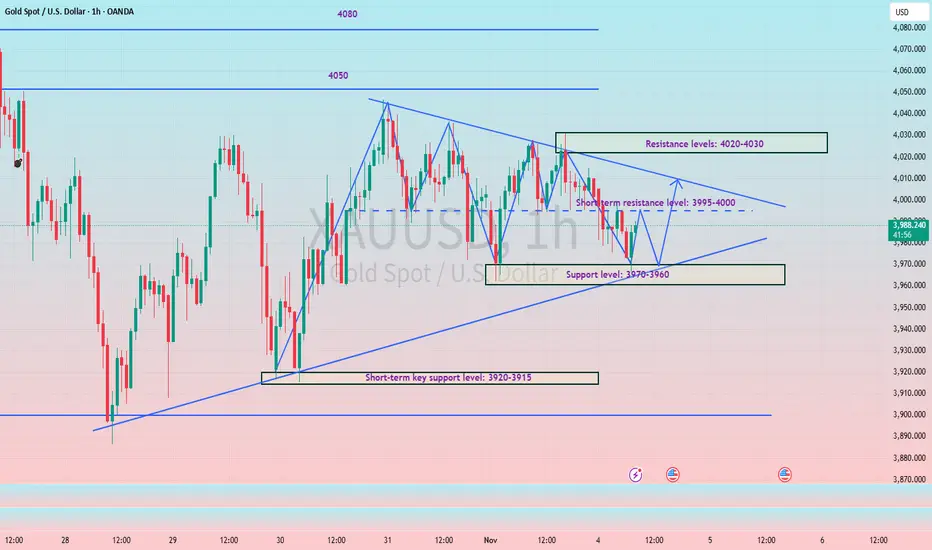
Gold prices stalled at higher levels yesterday, mainly due to Federal Reserve officials' cautious stance on a December rate cut, which boosted the dollar and dampened enthusiasm for gold's rise. Judging from the current trend, the market is in a converging triangle pattern. The daily MA5 is around 3987, and the MA10 is around 4021. It can be seen that the range between these two points is very small, indicating that the market is also preparing to break out and choose a major direction. Once the gold price breaks out of the triangle pattern and chooses a direction, the daily chart's trendline will widen. Therefore, the key resistance level to watch is 4020-4030, while the key support level is 3970-3960. The European session is expected to trade within a range in the short term. Before a successful breakout, pay attention to the resistance level of the middle band on the hourly and 4-hour charts at 3995-4000. If the price touches the resistance level on the first attempt and fails to break through, a small short position can be considered.
Gold Remains Range-Bound — Focus on Selling ReboundsAs time passes, the 4-hour moving average resistance continues to shift lower, with the key resistance area now around 4004/4030. From the current candlestick structure, bearish momentum still dominates. On the daily chart, the MA30 serves as the crucial pivot level, while MA20 can be used to gauge broader trend direction. In other words, only a firm hold above the MA30 would give bulls a chance to compete, and a full trend reversal would require a confirmed breakout above the MA20.
Key short-term support remains at 3948-3921, followed by the previous low near 3885. If these levels fail to hold, attention should shift to the 3800 psychological level and support from the daily MA60.
On the news front, geopolitical tensions continue to escalate, which has provided some safe-haven demand for gold. However, given the strong rally over the past two months, gold’s traditional safe-haven appeal has weakened, and volatility has increased, giving it characteristics closer to a risk asset at times. Therefore, geopolitical factors should be referenced cautiously, with primary focus remaining on core price structure and trading logic.
Meanwhile, uncertainty around whether there will be a rate cut in December also contributes to the current consolidation. Until there is clear direction, trading should remain cautious—focus on opportunities you clearly understand and avoid greed. When the market structure becomes unclear, stay patient and reduce unnecessary trades to manage risk.

XAUUSD/GOLD 1H SELL PROJECTION 04.11.25sell limit projection for XAU/USD (Gold) on the 1-hour timeframe, dated November 4, 2025.
Here’s the breakdown of the setup:
Trend Context:
The blue diagonal line labeled “BROKED 1H UPTREND CHANNEL” indicates that the price has broken below a previous uptrend, suggesting a potential bearish reversal.
Sell Entry Zone:
The “BREAKED ZONE” (around 4,007.863) is the projected sell limit entry area. The trader expects price to retest this level before continuing downward.
Stop Loss:
Placed above the resistance zone at approximately 4,023.449, protecting against a false breakout.
Target / Take Profit Levels:
Support S1: Around 3,984.000, likely the first take-profit (TP1).
Support S2: Around 3,966.380, the main target price (TP2) for the sell setup.
Trade Plan Summary:
Entry: ~4,007.86
Stop Loss: ~4,023.45
Take Profit: ~3,966.38
Bias: Bearish (sell after retest of broken trendline and resistance)

XAU/USD Intraday Plan | Watching 3957–3918 for Buyer ReactionGold remains in consolidation after failing to break above the 4042 resistance yesterday. The rejection from the MA200, followed by a break below the 3989 support level.
Price is now trading around 3982, approaching the First Reaction Zone (3957–3918). If this zone fails to hold, further weakness could expose the Support Zone (3884–3851), followed by the HTF Support Zone (3820–3781) as deeper reaction levels.
To shift momentum back to the upside, buyers need to reclaim 3989 and 4042, with the MA200 continuing to act as a major dynamic resistance.
📌 Key levels to watch:
Resistance:
3989
4042
4090
4142
Support:
3957
3918
3884
3851
🔎 Fundamental Focus:
There are no major economic releases on the calendar today, but traders should remain cautious as political headlines and broader fundamental developments can still drive sharp moves in gold.

Gold Price Outlook – Trade Setup (XAU/USD)📊 Technical Structure
OANDA:XAUUSD Gold is struggling to stay above $3,980, with clear resistance forming at $3,997–$4,005, just below the psychological $4,000 barrier. The price structure indicates a bearish short-term bias: rallies toward resistance may attract sellers targeting the $3,964–$3,956 support zone.
A sustained break below $3,956 would likely extend the decline toward $3,945, while only a decisive close above $4,010 would invalidate the downside bias.
🎯 Trade Setup
Entry: $3,997 – $4,005 (resistance retest)
Stop Loss: $4,007
Take Profit: $3,964 / $3,956
Risk-Reward Ratio: ≈ 1 : 4.67
🌐 Macro Background
Gold prices remain under pressure near $4,000 after the Federal Reserve’s hawkish tone boosted the U.S. Dollar.
As FXStreet’s Lallalit Srijandorn wrote: “Gold trades in negative territory near $4,000 as traders dial back expectations for additional Fed rate cuts.” 【FXStreet】
Fed Stance: Chair Jerome Powell stated another rate cut this year is “not a foregone conclusion.” Markets now assign roughly 70% odds of a 25bps cut in December, down from over 90% a week ago.
Data Impact: The ISM Manufacturing PMI fell to 48.7 in October (vs. 49.5 expected), highlighting slowing U.S. manufacturing — a potential drag on the dollar if weakness deepens.
Upcoming Event: Traders are watching ADP employment data (Wednesday) for labor market clues; weaker results may offer short-term relief for gold.
However, with the Fed maintaining a restrictive stance and the USD regaining momentum, gold’s upside remains capped in the near term.
🔑 Key Technical Levels
Resistance: $3,997 – $4,005
Support: $3,964 – $3,956
Psychological Level: $4,000
📌 Trade Summary
Gold remains confined below $4,000 amid hawkish Fed rhetoric and mixed U.S. data.
Short-term strategy favours selling rallies near $4,000, targeting $3,956, with stops above $4,007.
Only a breakout above $4,010 would shift bias to neutral.
⚠️ Disclaimer
This analysis is for reference only and does not constitute trading advice. Trading involves significant risk, and proper risk management is essential.

Candle Range Theory (CRT) Predicts Major Drop to BTLhe market just executed a perfect high-timeframe manipulation play right at a key institutional zone! This setup screams Distribution phase according to the CRT model.
🔑 The CRT Breakdown:
The Accumulation/Range Phase: Price consolidated horizontally below the 4h Bearish FVG, creating a clear range and collecting liquidity.
The Manipulation Phase (The Sweep): We saw the classic "False Breakout" above the range, perfectly sweeping the Buy-side Liquidity (BSL) just below the strong Bearish FVG 4h level ($4,024 area). This move trapped late-movers into long positions. 🎣
CRT Confirmation Candle: The subsequent candle action gave us the marked "Thick closure candle to scare bulls". This is the market's confirmation that the manipulation is complete and the directional move is about to start, using the volume/range from that candle to define intent.
The Distribution Phase (The Drop): Price is now breaking down, effortlessly slicing through the smaller FVGs (Fair Value Gaps) below $4,005. This shows clear displacement and an imbalance in supply. 🌊
🎯 The Target:
With the high-level sweep complete, the market is now magnetised to the next major pool of liquidity: the BTL (Buy-side Trapped Liquidity), which is the clear low on the 4h chart near $3,927.16.
If the $4,000 psychological support breaks decisively, expect a fast move down to clear that BTL!
Risk Management is Key! Protect capital as the $4k level can be volatile.
Bias: Strongly Bearish
Entry Confirmation: Clean close below the $4,000 zone.
Target: BTL at $3,927.16
What's your take? Is $4,000 the final defense line? Let me know! 👇
Greetings,
MrYounity

XAU/USD BULLISH CONTINUATION SETUPAnalysis:
On the XAU/USD (Gold vs USD) chart, price action shows a strong bullish structure forming after multiple Change of Character (CHoCH) and Break of Structure (BOS) confirmations. The market recently created an equal low (EQL) around the 3990–3995 zone, indicating potential liquidity build-up below.
Price has since rebounded from this demand area and is currently trading near the entry zone (around 4007–4008), suggesting a possible bullish continuation if structure holds.
Key observations:
Demand Zone: 3990–3995 region — a high-probability area where buyers previously stepped in.
Entry Level: Around 4007 — ideal for a long setup upon bullish confirmation.
Target Zone: 4060–4066 — aligning with the previous weekly high, acting as a strong liquidity target.
Stop Loss (Implied): Below 3988 zone, under equal lows for risk management.
Bias:
Bullish — as long as price holds above 3990 and maintains structure, the next push toward 4060–4066 remains likely.

#XAUUSD(GOLD):We are still bearish, this week is decider! Gold experienced a decline during today’s Asian session before recovering sharply to the 4030 area. Currently, the price is consolidating within a narrow range between 4010 and 4030. This behaviour suggests a period of accumulation, where buyers and sellers are unable to establish a clear directional advantage. Given the anticipated volatility in the coming week, particularly with macroeconomic data releases, traders should exercise caution and implement disciplined risk management strategies.
The initial decline in the Asian session may have been driven by short-term profit-taking and liquidity searches by major market participants. However, the swift recovery to 4030 indicates strong buying interest at lower levels, suggesting that gold remains in a bullish trend on larger timeframes. This range-bound movement between 4010 and 4030 is forming a temporary consolidation zone.
A detailed examination of the 1-hour chart reveals multiple touchpoints within this range, indicating strong short-term support at 4010 and resistance near 4030. Candlestick patterns suggest indecision, with several doji and spinning-top formations, further confirming the likelihood of price manipulation and liquidity grabs throughout the week.
Like and comment for more such chart analysis!
Team Setupsfx_

XAUUSD 4H Bearish setupThe price has tested the brown EMA ribbon (a dynamic resistance area) several times and failed to close above it. This indicates strong selling pressure near 4,045–4,065.
The latest rally failed to break the prior swing high, maintaining the bearish market structure.
Entry Zone: Around 4,035–4,045 (rejection zone)
Stop Loss: Above 4,065 (structure + EMA rejection area)
Targets:
TP1: 3,983 Minor support within prior structure – short-term profit-taking zone
TP2: 3,941 Mid-level Fibonacci extension; key liquidity zone
TP3: 3,901 Full measured move of the prior swing; strong bearish continuation target

XAUUSD, BUY TILL 4045XAUUSD, if this running M5 Candle will clsoe above the 4016, market will surely going to touch 4045 level very easily,

Gold Trade Set Up Nov 3 2025Price is making HL/HH on the 1h and is now testing 15m Supply so i will only be looking for buys if price continues to make a HH but if price can respect this supply and make bearish internal structure on the 5m-15m i will look for sells down towards SSL

XAUUSD/GOLD 1H BUY PROJECTION 03.11.25🟩 Technical Summary:
Structure: Price has broken out of a 1H downtrend line, signaling a potential bullish reversal.
Pattern Confirmation: A Bullish Engulfing candle confirms buying momentum.
Zones Marked:
Resistance R1: Around 4,020 zone
Resistance R2: Around 4,030–4,035 zone
4H Target Price: ~4,075–4,080 zone
Support Zone: Near 3,995–4,000 (Stoploss area).
📈 Projection Logic:
Price breaks 1H downtrend.
Retests near the trendline breakout zone (~4,000–4,010).
Pushes towards R1 and R2.
Final 4H target projected near 4,075–4,080.
🎯 Buy Setup Example:
Buy Entry: 4,005 – 4,010 (after retest)
Stoploss: 3,985 – 3,990
Target: 4,075 – 4,080
Risk–Reward: Roughly 1:3+
