Gold Short Trigger — PRZ Rejection or One More Push?This Gold( OANDA:XAUUSD ) idea is focused on the 15-minute timeframe and is in line with the previous 1-hour idea I shared, where the first target was reached.
Now, let’s see if on the 15-minute chart we can spot a short trigger for gold—stay with me!
Gold appears to be moving within an ascending channel (possible) over the past few hours and is currently near a Potential Reversal Zone (PRZ) and a Time Reversal Zone (TRZ).
I expect gold, upon entering these reversal areas, to resume its decline and fall at least toward the lower line of the ascending channel, around $4,987. If the lower line of the descending channel breaks, we could anticipate a further drop toward the support zone($4,914-$4,878).
First Target: $4,987
Second Target: Support zone($4,914-$4,878)
Third Target: $4,827
Stop Loss(SL): $5,087
Points may shift as the market evolves
What’s your view for the final trading hours of this week? And what trend do you expect for gold next week? Let me know!
💡 Please respect each other's opinions and express agreement or disagreement politely.
📌 Gold Analyze (XAUUSD), 15-minute time frame.
🛑 Always set a Stop Loss(SL) for every position you open.
✅ This is just my idea; I’d love to see your thoughts too!
🔥 If you find it helpful, please BOOST this post and share it with your friends.
Xauusdsignal

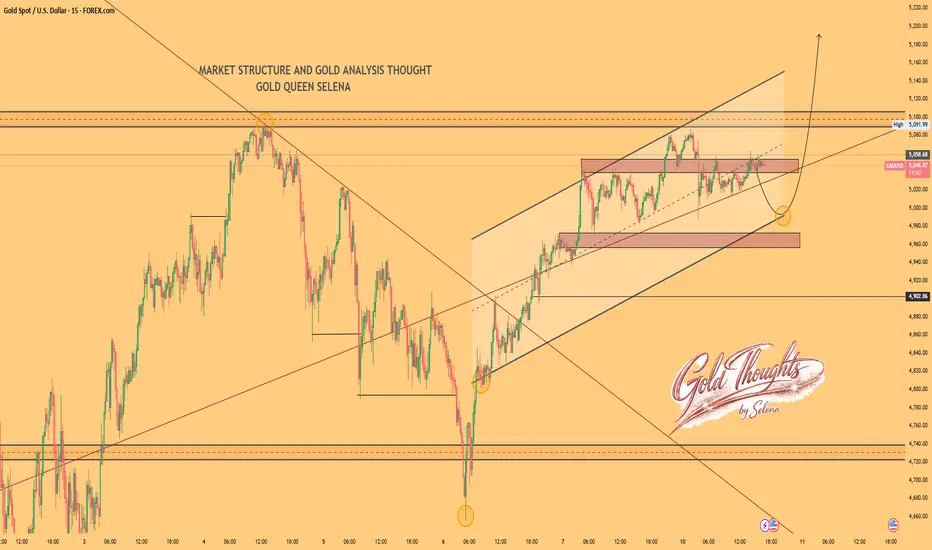
Selena | XAUUSD · 30M – Bullish Structure Inside Rising ChannelFOREXCOM:XAUUSD PEPPERSTONE:XAUUSD
After the aggressive sell-side sweep, buyers regained control and pushed price back into a structured bullish channel. The current strong consolidation under 5,100 suggests accumulation before a potential expansion move. As long as price holds above the internal demand at 4,960–4,980, upside liquidity remains the primary objective.
Key Scenarios
✅ Bullish Case 🚀
• Hold above 5060
• 🎯 Target 1: 5,120
• 🎯 Target 2: 5,180
• 🎯 Target 3: 5,240+
❌ Bearish Case 📉
• Breakdown below 4,960
Current Levels to Watch
Resistance 🔴: 5,100–5,120
Support 🟢: 4,960–4,980
⚠️ Disclaimer: This analysis is for educational purposes only. Not financial advice.

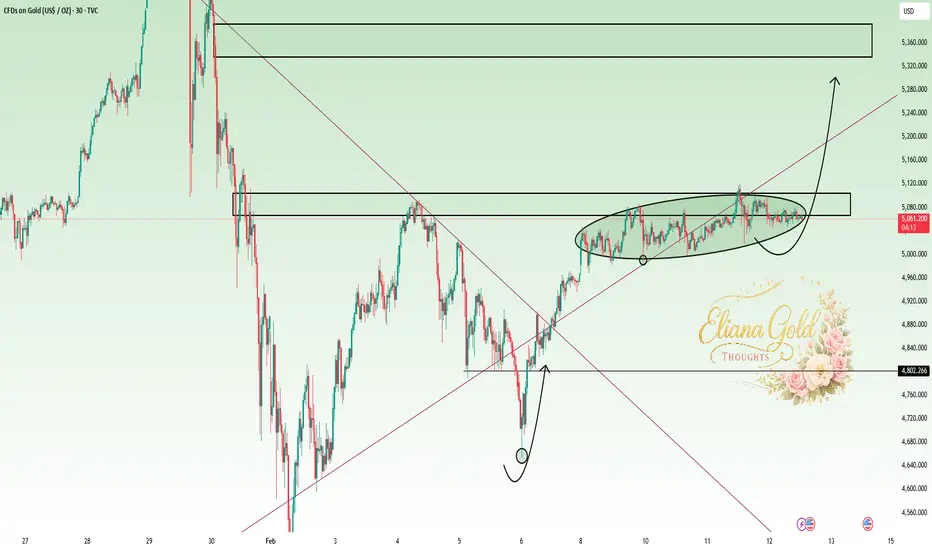
Eliana | XAUUSD · 30M – Bullish Compression Below ResistancePEPPERSTONE:XAUUSD OANDA:XAUUSD
Market Overview
After the sell-side liquidity grab near 4,680, buyers reclaimed structure and pushed price back into bullish territory. The current sideways compression under 5,120 indicates absorption of supply. A sustained hold above 5,000 keeps the bullish bias intact while liquidity sits above 5,120.
Key Scenarios
✅ Bullish Case 🚀
• Hold above 5,000 trendline
• 🎯 Target 1: 5,120
• 🎯 Target 2: 5,200
• 🎯 Target 3: 5,300+
❌ Bearish Case 📉
• Break below 5,000
• 🎯 Target 1: 4,920
• 🎯 Target 2: 4,820
• 🎯 Target 3: 4,680
Current Levels to Watch
Resistance 🔴: 5,080–5,120
Support 🟢: 5,000–4,980
⚠️ Disclaimer: This analysis is for educational purposes only. Not financial advice.
Double Top at Premium Zone | Why XAUUSD May Hunt Lows Again
This is not a random drop — it’s structured continuation after a major bearish displacement.
After an aggressive crash from the bullish leg, Gold delivered a clean 50% retracement into a premium zone. Instead of continuation higher, price built a double top and spent time ranging — a classic distribution phase where late buyers get trapped while smart money positions for continuation.
🧠 Market Structure (4H Context):
• Strong impulsive crash shifted momentum bearish
• 50% retracement acted as resistance, not support
• Double top formation at premium zone
• One-day range = accumulation/distribution before expansion
• Breakdown confirms weakness, not noise
📉 Current Bias:
The recent drop from range highs suggests continuation toward the origin of the last bullish reaction — the key support where previous buyers stepped in. Liquidity below remains the main draw until structure shifts.
🎯 Key Logic Behind the Idea:
• Premium retracement rejection
• Trendline support failure
• Range high liquidity sweep → bearish expansion
• Market moving from distribution → markdown phase
⚠️ Invalidation:
Sustained acceptance back above the double-top range removes bearish bias. Until then, rallies look corrective.
This analysis is built on structure, patience, and liquidity — not predictions or hype.
If you understand why the 50% retracement became resistance instead of support, drop your view below — let’s see who’s really reading price action.

Gold H1: Trendline Retest Before the Next Impulse?Gold is pulling back into a key confluence zone while macro volatility remains elevated.
Is this a breakdown… or just a liquidity reload before continuation?
📊 Technical Overview (H1)
Overall structure: Higher highs & higher lows intact
Price broke below short-term support → now retesting ascending trendline
Current pullback approaching major H1 FVG demand
This is a classic trendline retest + imbalance reaction area.
🟢 Key Support Zone
Major FVG Demand:
4,800 – 4,820
This zone aligns with:
Ascending trendline
Prior bullish impulse origin
Liquidity resting below recent lows
If price sweeps liquidity into 4,805 and shows strong H1 rejection → bullish continuation probability increases.
🔴 Resistance & Upside Targets
Near-Term Resistance:
4,983 – 5,000
Expansion Target:
5,080 – 5,120
If bullish continuation confirms:
TP1: 4,983
TP2: 5,080
TP3: 5,120
❌ Invalidation
Sustained H1 close below 4,780
→ Trendline failure
→ Structure shifts to deeper correction

Slight fluctuations. Pay attention to trading opportunities.After two weeks of significant volatility, gold's price action has begun to narrow this week, entering a period of consolidation on the daily chart. The trading range is expected to gradually shrink. It's not true that greater volatility equates to greater profits; risk and reward are always proportional. Higher volatility means greater instability, especially for short-term traders. It's crucial to wait for a new trend to emerge.
Friday's positive CPI data propelled the bulls to break above 5000, reaching a high of 5033 before encountering resistance and trending downwards. Currently, it's maintaining a slight consolidation.
While the overall trend remains bullish, caution is advised regarding potential technical adjustments on the weekly chart. For now, it's recommended to trade within this range. Watch the 5030-5050 resistance level above and the key support level below at 44950. The last trading day of the week will likely see gold prices hover within this range unless there are unexpected news events.I will post more strategies in the channel.

XAUUSD LONG VIEWS 45MIN !!Key Scenarios
✅ Demand Case 🚀 →Demand Zone 4974
🎯 Target 1: 4986
🎯 Target 2: 4996
Analysts warn that leaves them exposed to a volatile market unrelated to their main business where prices are forecast to retreat even as traditional processing fees continue to decline.

#XAU/USD Sell Trade Scenario.Here’s an up-to-date XAU/USD Sell trade outlook (technical + fundamental) to help you assess whether positioning for a Downside makes sense right now.
Thank You......

Eliana | XAUUSD · 15M – Rising Structure | Breakdown Risk PEPPERSTONE:XAUUSD OANDA:XAUUSD
After a strong recovery from the sell-side liquidity sweep, XAUUSD formed a controlled bullish leg. However, repeated rejections from the supply zone and failure to impulsively break higher suggest potential distribution. The current structure favors a corrective move if trendline support fails.
Key Scenarios
✅ Bullish Case 🚀 →
• Strong hold above 4,980 + trendline
• 🎯 Target 1: 5,070
• 🎯 Target 2: 5,120
❌ Bearish Case 📉 →
• Breakdown below 4,980 demand + trendline
• 🎯 Downside Target 1: 4,900
• 🎯 Downside Target 2: 4,800 (liquidity zone)
Current Levels to Watch
Resistance 🔴: 5,070 – 5,100
Support 🟢: 4,995 → 4,980
⚠️ Disclaimer: This analysis is for educational purposes only. Not financial advice.

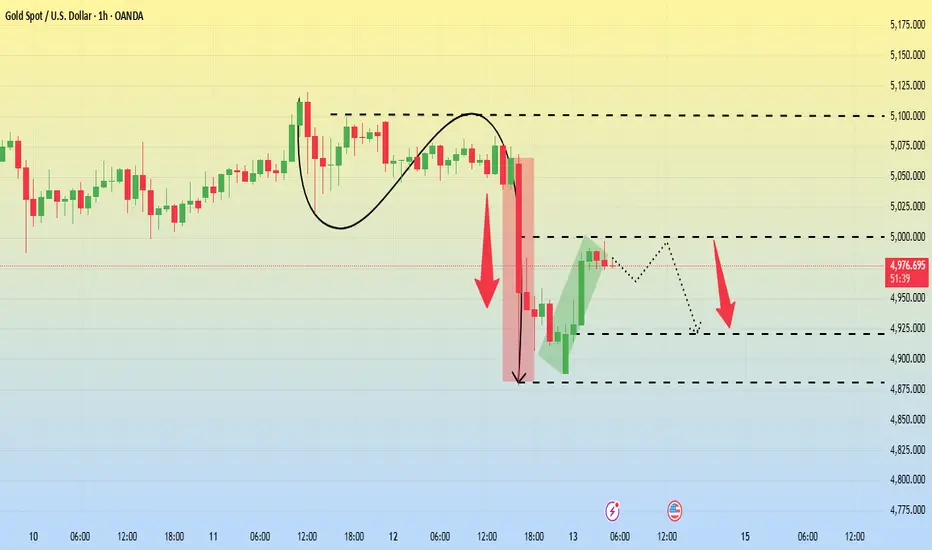
A rebound correction. Sell at the 5000 resistance level.On Thursday, gold prices experienced a dramatic rollercoaster ride after a brief surge. In early Asian trading, prices briefly rose to around 5100, with bulls showing strong momentum. The European session was relatively calm, remaining within a range.
During the US session, gold prices plummeted due to stronger-than-expected US employment data, falling sharply by $240 to a low of around $4,878 before finding support and closing near the low. The day's volatility was extreme and caught the market off guard.
As we mentioned on Thursday, a calm market often conceals a larger trend, and a breakout from the trading range could lead to a sudden shift in market direction.
Currently, the trend remains in a corrective rebound pattern, with upward movement proving difficult. The 5000 level forms a strong resistance zone, while 4880 provides short-term support. A break below this level would likely lead to even lower lows.
For short-term trading, it is recommended to short at the 5000 level, with a profit target of around 4950-4920. The strategy remains unchanged until the release of the US January CPI data; please pay attention to the trading hours.
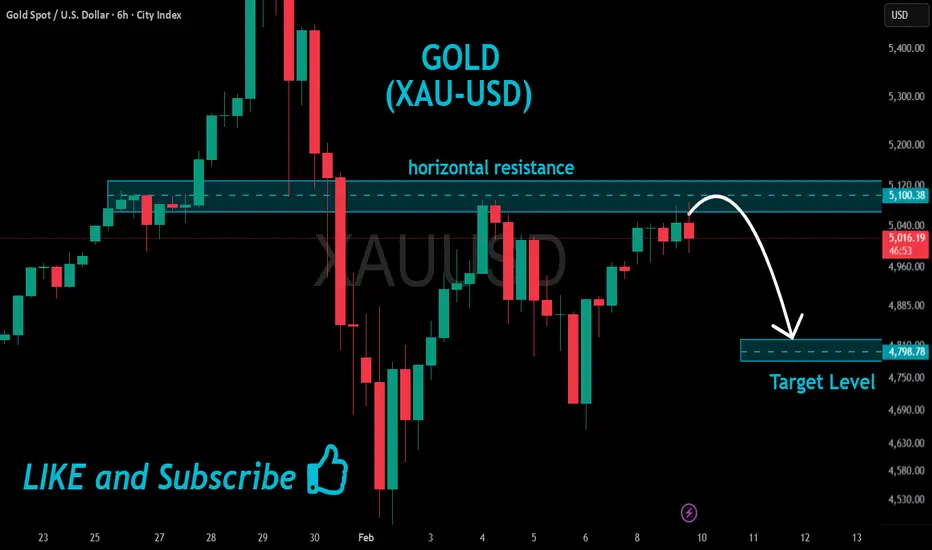
GOLD Short From Resistance!
HI,Traders !
#GOLD is once again
About to retest a horizontal
Resistance level of 5100.38
Which is a strong supply
Area from where a local
Bearish pullback is to
Be expected ! xauusd
Comment and subscribe to help us grow !
Selena | XAUUSD · 30M – Post Breakdown Recovery SetupPEPPERSTONE:XAUUSD FOREXCOM:XAUUSD
After distribution inside the upper channel, sellers triggered a sharp liquidity grab below 4,920. The reaction from 4,900 shows strong buyer absorption. Price is now stabilizing above the demand zone, forming a potential higher low within a broader bullish context.
Key Scenarios
✅ Bullish Case 🚀
• Hold above 4,920 demand
• 🎯 Target 1: 5,020
• 🎯 Target 2: 5,080
• 🎯 Target 3: 5,150
❌ Bearish Case 📉
• Break below 4,900
• 🎯 Target 1: 4,820
• 🎯 Target 2: 4,750
• 🎯 Target 3: 4,680
Current Levels to Watch
Resistance 🔴: 5,020–5,080
Support 🟢: 4,920–4,900
⚠️ Disclaimer: This analysis is for educational purposes only. Not financial advice.

XAU/USD Price Outlook – Trade Setup📊 Technical Structure
Gold sharply rejected from the upper channel resistance near the $5,060 area and briefly broke below the ascending channel structure, triggering a fast selloff toward the $4,900 demand zone.
Price has now reacted strongly from the $4,936–$4,913 support zone, reclaiming short-term structure and attempting a recovery back toward the broken resistance area.
The current structure suggests a pullback-then-continuation scenario:
Short term: corrective rebound
Intraday bias: mildly bullish while above $4,913
Major resistance remains near $5,043–$5,066
As long as price holds above $4,913, buyers retain recovery control.
🎯 Trade Setup (Bullish Recovery Bias)
Entry Zone: $4,936 – $4,913
Stop Loss: $4,901
Take Profit 1: $4,980
Take Profit 2: $5,043
Extended Target: $5,066
Risk–Reward Ratio: Approx. 1:3.72
📌 Invalidation:
A sustained break below $4,900 would invalidate the recovery structure and expose $4,880 → $4,840 support region.
🌐 Macro Background
Gold rebounded after falling to a weekly low near $4,878 as traders position ahead of the US CPI report.
Strong NFP reduced expectations of a March Fed rate cut (USD supportive)
However, weak Jobless Claims signaled labor market softening (gold supportive)
Markets still expect at least two Fed cuts in 2026
Risk sentiment remains fragile, supporting safe-haven demand
Therefore, CPI will likely determine whether gold breaks $5,060 or returns below $4,900.
🔑 Key Technical Levels
Resistance Zone: $5,043 – $5,066
Intermediate Resistance: $4,980
Support Zone: $4,936 – $4,913
Breakdown Level: Below $4,900
Upside Structure Trigger: Above $5,043
📌 Trade Summary
Gold is attempting a rebound after a liquidity sweep below channel support.
Preferred strategy: Buy dips above $4,900 targeting a retest of $5,043–$5,066 resistance, while remaining cautious ahead of US CPI volatility.
⚠️ Disclaimer
This analysis is for reference only and does not constitute trading advice. Financial markets involve significant risk; proper risk and position management are essential.

Gold - Preparing the final blow off top!💰Gold ( OANDA:XAUUSD ) will rally a final +20%:
🔎Analysis summary:
Just in January alone, Gold is up another +25% so far. Looking at this very bullish parabolic rally, Gold remains super strong and is still not done with the bullrun. Until Gold retests the ultimate resistance trendline, it can easily rally another +20% from the current levels.
📝Levels to watch:
$6,000
SwingTraderPhil
SwingTrading.Simplified. | Investing.Simplified. | #LONGTERMVISION

XAUUSD- 4H Setup Price shows continued downside pressure after rejection from the 5077 high. Momentum favors sellers as structure shifts lower.
🔻 Bearish Confluences
Lower highs & lower lows on intraday structure
Rejection from resistance / supply zone near prior breakdown area
Bearish momentum continuation (strong impulsive sell leg)
Price trading below short-term moving averages
📉 Fibonacci Measured Move Targets
Using the swing from 5077 → 4900 as the 100% move (177 points):
100% = 4900
The following levels act as potential continuation targets if 4900 breaks below with momentum.
127.2% = ~4852
161.8% = ~4791
Bias remains bearish below structure resistance.
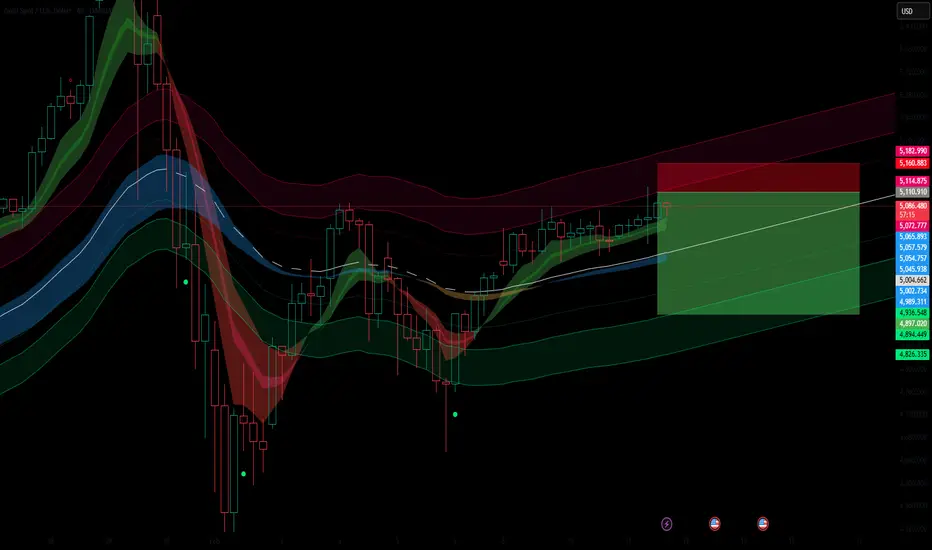
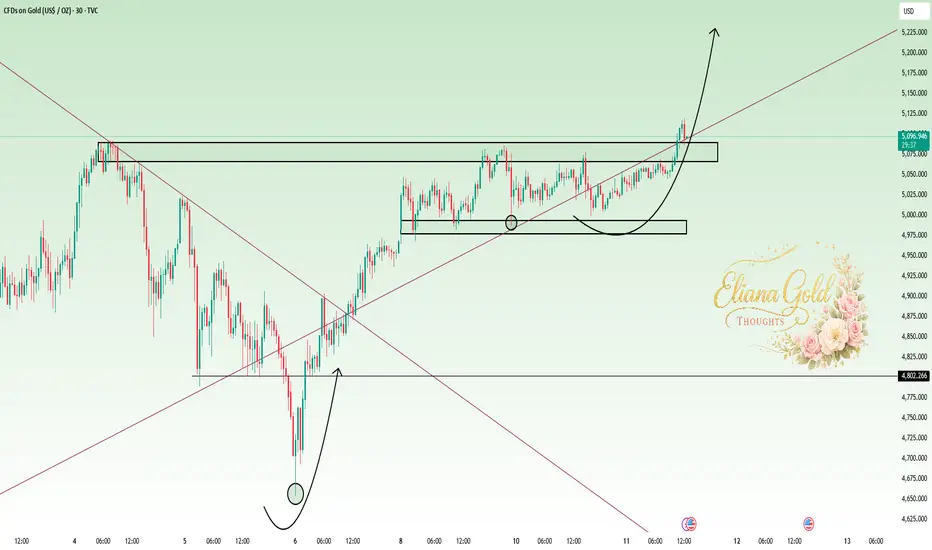
Eliana | XAUUSD · 30M – Bullish Continuation StructureOANDA:XAUUSD PEPPERSTONE:XAUUSD
After sweeping liquidity near 4,660, buyers aggressively reclaimed structure and established bullish momentum. The pullback into 5,000 was absorbed, indicating strong demand continuation. Current price action shows compression beneath resistance, suggesting breakout potential if supply is cleared decisively.
Key Scenarios
✅ Bullish Case 🚀
• Hold above 4,985 support
• 🎯 Target 1: 5,110
• 🎯 Target 2: 5,180
• 🎯 Target 3: 5,250
❌ Bearish Case 📉
• Breakdown below 4,985
• 🎯 Target 1: 4,900
• 🎯 Target 2: 4,802
• 🎯 Target 3: 4,700
Current Levels to Watch
Resistance 🔴: 5,080 – 5,110
Support 🟢: 4,985 – 5,000
⚠️ Disclaimer: This analysis is for educational purposes only. Not financial advice.
Selena | XAUUSD · 15M – Ascending Channel | Compression FOREXCOM:XAUUSD PEPPERSTONE:XAUUSD
After a strong bullish reversal from the sell-side liquidity sweep near the lower demand, XAUUSD transitioned into a controlled bullish channel. The market is now consolidating below resistance, which typically precedes either a continuation breakout or a corrective pullback toward demand before the next leg.
Key Scenarios
✅ Bullish Case 🚀 →
• Acceptance above 5,100 resistance
• 🎯 Target 1: 5,150
• 🎯 Target 2: 5,200
❌ Bearish Case 📉 →
• Rejection from resistance + channel breakdown
• 🎯 Downside Target 1: 4,980
• 🎯 Downside Target 2: 4,950
• 🎯 Downside Target 3: 4,900
Current Levels to Watch
Resistance 🔴: 5,090 – 5,120
Support 🟢: 5,000 → 4,950
⚠️ Disclaimer: This analysis is for educational purposes only. It is not financial advice.
The XAUUSD Monster Trade is Alive & Well: My Next Move for GOLDIn this video I reveal the mechanics behind my "Monster Trade" strategy specifically for XAUUSD. You will learn how to scale into winning positions, mathematically remove risk by banking 50% profits, and leave "runner" positions active to capture massive macro moves. This isn't about scalping; it's about building life-changing wealth by riding the higher-timeframe bullish bias.
Bulleted Key Takeaways
💰 The 50% Rule: How to bank early profits to create a "risk-free" buffer for long-term holds.
📈 Pyramiding Logic: The exact way to add positions on pullbacks without over-leveraging.
🛡️ Psychological Edge: Why having a "capital buffer" eliminates the fear and anxiety of market volatility.
🎯 Targeting 10,000 R: Visualizing the power of compounding runners over months, not minutes.

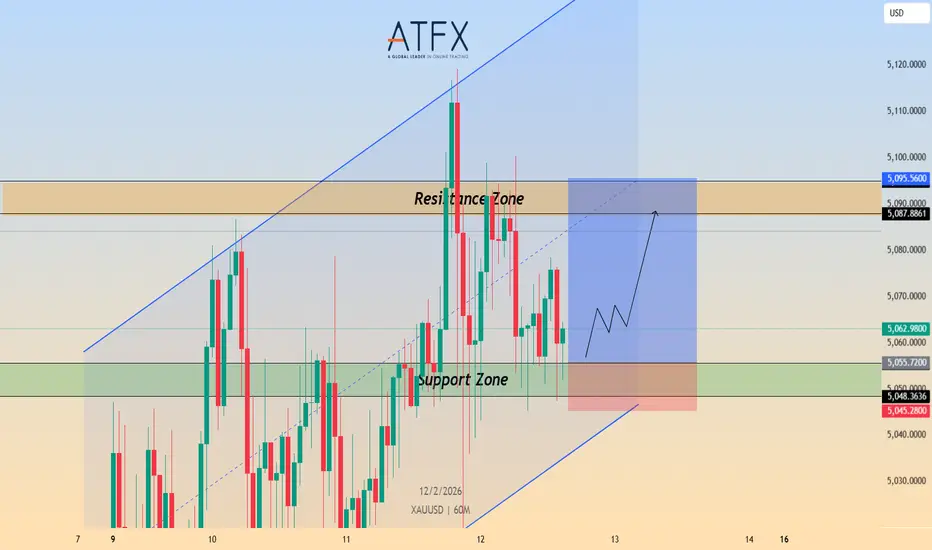
Gold Price Outlook – Trade Setup (XAU/USD)📊 Technical Structure
OANDA:XAUUSD Gold remains within a short-term ascending channel structure despite intraday weakness following strong US NFP data.
Price is currently holding above the key support zone (5,048–5,055) after a pullback from the resistance band near 5,087–5,095.
As long as the support zone remains intact, the broader short-term bias stays cautiously bullish, with scope for another attempt toward the upper resistance region.
However, failure to hold above 5,045 would expose the lower channel boundary.
🎯 Trade Setup (Bullish Bias)
Entry Zone: 5,048 – 5,055
Stop Loss: 5,045
Take Profit 1: 5,087
Take Profit 2: 5,095
Risk–Reward Ratio: Approx. 1:3.82
📌 Invalidation:
A sustained break below 5,045 would shift momentum bearish and invalidate the long setup.
🌐 Macro Background
Gold faces pressure after a stronger-than-expected US Nonfarm Payrolls report reduced expectations for a March Fed rate cut. Markets now price nearly a 95% probability of no change in March.
Despite this, the Federal Reserve is still expected to deliver two rate cuts later in 2026, limiting USD upside momentum.
Additionally, renewed concerns over Fed independence continue to cap aggressive USD strength.
Traders now await US CPI data and Weekly Jobless Claims for the next directional catalyst.
🔑 Key Technical Levels
Resistance Zone: 5,087 – 5,095
Support Zone: 5,048 – 5,055
Bearish Breakdown Level: Below 5,045
Upside Extension Target: 5,120
📌 Trade Summary
Gold remains structurally supported above 5,048 despite post-NFP volatility.
Preferred strategy: Buy dips above support, targeting a move back toward the resistance band, while staying cautious ahead of US inflation data.
⚠️ Disclaimer
This analysis is for reference only and does not constitute trading advice. Financial markets involve significant risk; proper risk and position management are essential.
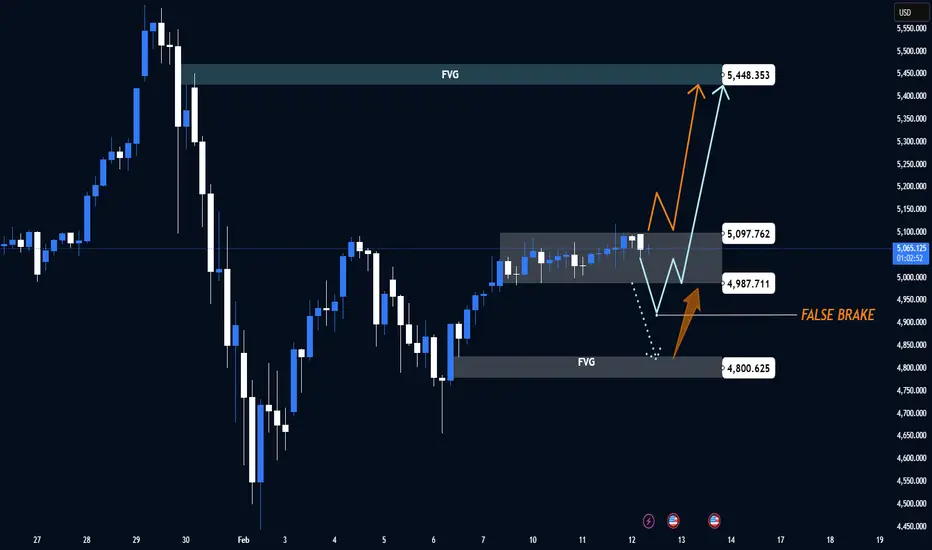
XAUUSD H1 – False Break or Expansion Toward 5,448?Gold is compressing beneath a major imbalance while macro uncertainty keeps volatility elevated.
This is a classic liquidity environment — either a fake breakdown to sweep stops or a clean expansion toward higher liquidity.
📊 Technical Structure (H1)
Short-term structure: Bullish recovery intact
Price holding above prior demand base
Consolidation forming under internal resistance
Market is trading between two major imbalances (FVG zones), preparing for expansion.
🟢 Key Demand & Support
Internal Support / Reaction Zone:
4,987 – 5,000
Major Demand (FVG):
4,800 – 4,820
This lower zone is critical.
A sweep into 4,800 followed by strong rejection = high probability false break setup.
🔴 Resistance & Liquidity Targets
Near-Term Resistance:
5,097
Major FVG Supply:
5,430 – 5,448
If bullish continuation confirms, price is likely targeting this upper imbalance.
🎯 Trading Scenarios
Scenario 1 – False Break (Liquidity Sweep)
Price dips into 4,800 zone
H1 closes back above 4,900
Then continuation toward:
TP1: 5,097
TP2: 5,430
TP3: 5,448
Scenario 2 – Direct Breakout
H1 acceptance above 5,100
Momentum continuation into upper FVG 5,430–5,448
Invalidation
Sustained H1 close below 4,780 → structure shifts bearish
🌍 Macro Context
Gold remains sensitive to:
Fed rate expectations
US Treasury yields
USD strength
Geopolitical risk flows
Any shift in inflation expectations or dovish Fed signals increases upside probability.
Stronger USD / rising yields may trigger the liquidity sweep first.
Continued fluctuations. Be aware of range breakouts.Gold remains oscillating between $5020 and $5120, with the range compressed to less than $100. The longer the consolidation lasts, the stronger the breakout will be. Currently, there is no clear trend between bulls and bears; the only difference is in the price levels. Sell short near the high point of a rebound or buy near the support level after a pullback. It is worth noting that if the range is broken, you need to stop loss or close the position in time.
Secondly, the impact of fundamental data is limited. What often happens is the adjustment or attitude of Trump's policies. These are not predictable by fundamentals and are driven by unexpected events. The price reaction is broken within the range, and the original sideways trend will be broken.
Technically, the market is in a range-bound oscillation, with neither rallies nor pullbacks being sustained, but a breakout from the existing range is possible at any time.
In the short term, consider shorting above $5120. For long positions, consider establishing positions in the $5030-$5050 range and holding them after a breakout.

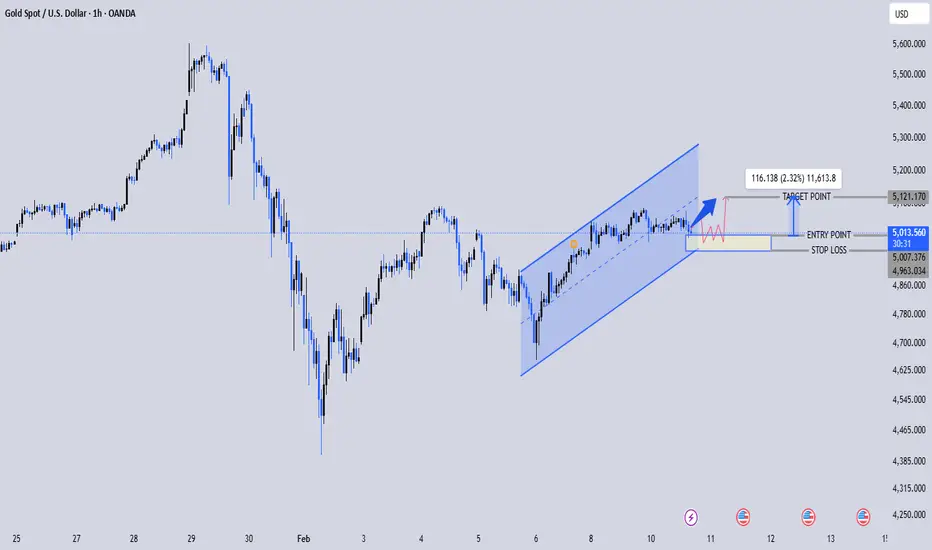
XAUUSD Bullish Channel Continuation Toward 5,110Market Structure
Strong impulsive recovery from the 4,600s zone.
Higher highs + higher lows forming inside the rising channel.
Price currently consolidating near the upper-mid section of the channel around 5,015.
That consolidation box you marked? That’s a classic bullish continuation base if buyers defend it.
📈 Bullish Scenario
Entry zone: ~5,010–5,020 (demand inside channel support)
Stop loss: Below 4,963 (below recent swing low & channel support)
Target: 5,110–5,120 (channel resistance + projected measured move)
If price holds above 5,000 psychologically and continues forming higher lows on lower timeframes, this breakout toward 5,110 is very realistic.
The measured move (≈116 points) aligns nicely with the upper boundary — confluence is strong here.
⚠️ Risk Factor
If price breaks and closes below:
4,990 short-term structure weakens
4,963 invalidates the bullish setup completely
Then we could see a deeper pullback toward mid-channel or even lower boundary.
💡 Overall Bias
Bias remains bullish while inside the ascending channel.
This is a continuation setup, not a reversal play.
GOLD(XAUUSD): Distribution Started Price Heading Towards $5400?Dear Traders,
Gold has completed accumulation phase and its now has started the distribution phase which is likely to take price to $5400 where we could see strong resistance. So use the accurate risk management while trading gold and other financial instruments.
Like and comment for more!
Team Setupsfx_
