Today's gold trading strategy, I hope it will be helpful to youGold resumed its upward momentum on Monday, primarily driven by multiple positive factors. The market widely expects the Federal Reserve to maintain a wait-and-see stance ahead of its monetary policy meeting, with the upcoming inflation data set to serve as a key guide. Meanwhile, the U.S. government’s fiscal deadlock has introduced uncertainty, providing additional safe-haven premium for gold. The persistence of heightened tensions in the Middle East has further highlighted gold’s hedging function.
In the long run, the steady gold purchase demand from global central banks and ETF holdings have formed solid support for gold prices, effectively offsetting short-term volatility. Additionally, the performance of traditional safe-haven currencies such as the Swiss franc and Japanese yen, together with the U.S. dollar, has jointly influenced gold’s appeal.
From the 4-hour chart analysis, gold oscillated below the critical level of 4,380. However, driven by safe-haven buying in the evening, it broke through this resistance level strongly, indicating that bulls have regained dominance. This breakthrough confirms the short-term strong pattern, and the key focus for the intraday downside is the 4,300 level, which has now transformed into a new support zone.
In terms of operation, the strategy should shift to following the trend and going long, prioritizing opportunities to enter positions on pullbacks to lower levels. This rapid rally and recovery of lost ground have once again verified the strength of the current bullish momentum. Given the high market volatility, it is advisable to remain patient, wait for price corrections to enter long positions, and set stop-losses properly.
Today's Gold Trading Strategy
xauusd@buy:4310-4320
pt:4340-4350
sl:4295
Xauusdsignal

21/10/68 : XAUUSD ( Europe / London Session )Using it from Europe Session until 7.00PM , I'll new analysis and update at 8.00PM
Resistance
4365-4370
4353-4359
4347
Support
4336
4325-4331
4314-4320

Gold Analysis – Volatility Rules the GameYesterday marked another strong bullish session for Gold, as the price completely erased Friday’s losses, confirming that buyers are far from done. Regardless of how high the market has already climbed, momentum remains firmly on the bullish side.
Technically, Gold managed to reclaim and break above the 4285–4300 resistance zone, which triggered a sharp acceleration toward the recent all-time high around 4380.
At the time of writing, the market is undergoing a normal retracement, which is a healthy technical reaction after such an aggressive move. The 4300 area has now turned into key short-term support, and as long as bulls defend this level, the probability of a new ATH remains high.
From a trading perspective, however, volatility has reached extreme levels. This type of price action often favors large players with fundamental reasons rather than discretionary traders. For that reason, I prefer to stay on the sidelines today, waiting for volatility to stabilize before engaging again.

4365 Achieved Excellent profits Booked [1350 PIPS Gained]Thanks to traders who followed and stay Active with me on bullish rally
As highlighted in yesterday’s session update:
My Position:
The ongoing bull rally has played out perfectly, with both of my targets achieved ahead of schedule. I identified strong support around $4,220 & 4190 along condition H4 Candle for bullish rally. Iinitiated aggressive swing buys from that zone. When $4,190 was retested, I held off for a healthy pullback before re-entering.
At $4205& $4,225, I scaled in aggressively (four entries) aiming for $4,345, which was reached — locking in solid overnight gains.
I’m pleased with the overall performance during this multi-month bullish phase and plan to keep accumulating on dips until the $4,490 level is reached from my main re-entry zones.
Additional Tip:
Once again, I caution traders — avoid counter-trend selling.
Many get trapped trying to short Gold in a strong uptrend. Stay aligned with the trend — it’s still firmly bullish.🚀

Gold Price Outlook – Trade Setup (XAU/USD)📊 Technical Structure
Gold has once again tested the $4,380 resistance zone, where repeated rejections highlight a strong supply barrier. Price is now consolidating toward the $4,293–$4,301 support zone, which coincides with a rising trendline. If buyers defend this level, the bullish structure remains valid with potential to revisit $4,377–$4,384. A deeper pullback below $4,285 would weaken the bullish outlook and expose $4,260–$4,270.
🎯 Trade Setup
Entry: 4,293–4,301 (support retest)
Stop Loss: 4,288
Take Profit: 4,377 / 4,384
R:R: ≈ 1 : 6.18
🌍 Macro Background
Gold’s rally has stalled near $4,380 as markets shift focus to US-China trade talks. While safe-haven demand remains strong, optimism around potential negotiations has allowed the US Dollar to recover modestly. Meanwhile, the prolonged US government shutdown and Trump’s threat of a 155% tariff on China from November 1 add fresh uncertainty, supporting the case for safe-haven flows. Additionally, markets are pricing in two more Fed rate cuts this year, keeping gold well-bid on dips. Investors will closely monitor US CPI data on Friday and earnings from major US companies for directional cues.
🗝️ Key Technical Levels
Resistance: 4,377 / 4,384 / 4,390
Support: 4,301 / 4,293 / 4,260
📌 Trade Summary
Gold remains in a buy-on-dips mode as long as $4,301 support holds. Short-term pullbacks offer potential entry opportunities toward $4,380 resistance, but repeated rejections at this zone highlight the importance of risk management.
⚠️ Disclaimer
This analysis is for reference only and does not constitute trading advice. Trading involves significant risk, and proper risk management is essential.

XAU/USD | The Art of Trendline Liquidity & OB ReactionGold continues to respect the structural rhythm of Smart Money flow. Price recently formed Equal Highs (EQH) before a potential retracement into OB + FVG confluence zone, where liquidity beneath trendline support remains untapped.
The idea anticipates a sweep of short-term liquidity before a possible bullish continuation — aligning with the current market structure shift.
⚙️ Concepts used: OB | FVG | EQH/EQL | Trendline Liquidity | Market Structure
🧠 This idea is shared purely for educational and analytical purposes — not a signal.
🔁 Feel free to share your perspective in the comments — every chart tells a story!

Gold has resumed its upward trend. Choosing the right entry poinGold prices rebounded over 2% on Monday, recouping Friday's losses, driven by market speculation that the Federal Reserve will continue its easing cycle next week. A weaker dollar and falling Treasury yields led to a sharp rebound in gold after hitting a daily low of $4,219/oz.
Gold hit a new high of 4,381.4 in US trading on Monday, forming a short-term double top with last week's high of 4,380.
Gold prices are currently stabilizing at the 5-day moving average. The current trend suggests a bullish outlook. A certain degree of price pullback during the uptrend offsets the earlier bullish trend, solidifying the upward trend. The current trend is a pullback in the Asian session followed by a second rise in the European and American markets. We must adapt to this trend and choose the right entry points amidst market fluctuations.
From the 1-hour chart, in the short term, pay attention to the high pressure of 4380-4385, and pay attention to the first support level of 4320 below. This position is the middle track of the Bollinger band and also overlaps with the MA20 moving average. Secondly, pay attention to the MA30 moving average near 3295. Short-term Trading Strategy:
Buy stocks in batches when the price retreats to around 4315-4320, with a stop-loss of $10. Profit range: 4360-4380.
If the upward trend fails to break through resistance for a long time, try shorting with a small position at the high point, with a profit of 20-30 pips.
I will post more real-time trading strategies in the channel, welcome to communicate.

GOLD|When the market loses balance, dominance leaves a footprint🔍 Market Context
After establishing a short-term peak in the 4,385 – 4,372 USD range, gold has entered a phase of strong technical correction , with consecutive red candles breaking the short-term upward structure.
The sellers temporarily dominate, pushing the price through the H1 upward trendline. However, the support zone below (Liquidity Zone + Order Block Bullish) is beginning to show absorption force, indicating the possibility that buyers might return at discounted price levels.
💎 Technical Analysis
Previous Bullish BoS: confirms the main trend is still long-term bullish .
FVG Down Zone: 4,285 – 4,260 USD → an unfilled price balance area during the decline, potentially a place for price to retrace to “fill the gap” before choosing a direction.
Liquidity Zone $$$: 4,222 – 4,218 USD → a short-term support area where new buying liquidity appears.
Order Block Bullish: 4,203 – 4,185 USD → a confluence area between OB and Fibo 0.786, where large capital might return.
Deep Bullish OB: 4,142 – 4,128 USD → the final defense zone for the main upward trend.
Order Block Bearish: 4,372 – 4,385 USD → a critical resistance area, likely to react if the price retraces.
The current structure shows gold is in a retracement – liquidity rebalancing phase, lacking sufficient signals to reverse the trend.
📈 Trading Scenarios
1️⃣ Main Scenario – Buy reaction at Liquidity Zone 4,222 – 4,203 USD
Entry: 4,222 – 4,203
SL: 4,185
TP: 4,260 → 4,318 → 4,372
✅ Condition: Strong rejection candles (rejection / engulfing bullish) appear at the support zone or small reversal BoS.
➡️ This is a “buy the dip” setup following the main trend, leveraging the liquidity zone and confluence OB.
2️⃣ Secondary Scenario – Sell reaction at FVG Down 4,285 – 4,260 USD
Entry: 4,260 – 4,285
SL: 4,300
TP: 4,222 → 4,203
✅ Condition: Strong bearish candles or rejection signals appear at the FVG zone.
➡️ This setup is for scalping traders or short-term shorts in the unfilled price balance area.
⚠️ Risk Management
Do not FOMO buy when the price has not confirmed the 4,222 zone.
If the price breaks below 4,185 → wait for a re-test to continue selling towards the 4,128 zone.
Maintain moderate volume, as the market is in a rebalancing phase – liquidity is still noisy.
💬 Conclusion
Gold is in a transitional phase after a strong decline .
The 4,222 – 4,203 USD zone will be key to determining whether the medium-term upward trend continues.
If this zone holds, gold is likely to retest the 4,318 – 4,372 USD range.
👉 Reasonable Strategy:
Buy reaction at 4,222 – 4,203 USD when confirmed.
Sell technically at FVG 4,260 – 4,285 USD if clear rejection appears.
🔥 “When the market loses balance, the strongest side will leave a trace – and this time the trace lies around the 4,220 USD zone.”

Gold Enters High Zone — Wait for Breakout and Follow the TrendThis is the 4-hour gold chart, and the primary focus right now is whether a double-top pattern is about to form.
From a trend perspective, the recent pullback to around 4180 has already completed a trend confirmation. Normally, another rally from here would be expected to break above the previous high. However, the challenge lies in the fact that this previous high is also a historical peak, which brings significant uncertainty — will it turn into a double top, or will it confirm support and trigger a stronger new uptrend?
At this stage, it’s difficult to make a definitive judgment, so I prefer to remain cautious with my trading decisions.

ElDoradoFx PREMIUM – GOLD ANALYSIS (21/10/2025, ASIA SESSION)Gold saw a strong rebound during the US session, rallying from the previous session’s corrective low near 4318 and pushing back toward the key resistance area around 4380–4385. This confirms buyers are still active, but price is currently testing a rejection zone, indicating potential exhaustion near recent highs. The Asia session opens with consolidation after a strong bullish impulse, suggesting either a continuation move if momentum sustains or a healthy pullback opportunity.
⸻
📊 2️⃣ Technical Breakdown
📅 D1 (Daily)
• Structure remains strongly bullish, printing higher highs and higher lows.
• Candle closed bullish but with upper wick rejection near 4381 (previous weak high).
• RSI remains in overbought territory near 80, signalling risk of short-term corrective moves.
⏳ H1
• Price broke above the bearish intraday channel structure and retested 4320–4318 demand zone before impulsing upward.
• Current consolidation sits below 4380–4385 resistance, awaiting liquidity.
• 50 EMA and 200 EMA remain below price, preserving bullish structure, but momentum is slowing.
📉 15M–5M
• Micro consolidation forming below 4380, indicating indecision.
• MACD histogram showing fading buying strength; possible retracement early Asia before continuation.
• Short-term liquidity resting under 4345–4335, aligning with potential retracement area.
⸻
📐3️⃣ Fibonacci Analysis (Last confirmed swing)
🔹 Swing Low: 4318
🔹 Swing High: 4381
📍Golden Zone (61.8%–50%): 4345 – 4358
✅ This aligns with prior structure + EMA support → high confluence reload zone for bulls if retested.
⸻
🎯4️⃣ High-Probability Trade Scenarios
✅ Scenario A: Buy (Continuation – Preferred if pullback holds)
👉 Entry Zone: 4358–4345 (Golden Zone / EMA confluence)
🎯 TP1: 4381 TP2: 4395 TP3: 4410
🛑 SL: Below 4335
⚠️ Scenario B: Aggressive Breakout Buy
👉 Break Above: 4385 (clear candle close + retest)
🎯 TP1: 4395 TP2: 4410 TP3: 4425
🛑 SL: Below 4370
📉 Scenario C: Sell (Countertrend – Only if rejection confirmed)
👉 Break Below: 4335 (structure failure + retest)
🎯 TP1: 4318 TP2: 4305 TP3: 4285
🛑 SL: Above 4355
⸻
📰5️⃣ Fundamental Watch (Asia)
✅ No major Asian macro catalysts.
📉 DXY stabilizing near 106.00 after mild drop → neutral to slightly bullish for gold.
👀 US PMI data later may create pre-Asia caution.
⸻
📍6️⃣ Key Technical Levels
Type Levels
Major Resistance 4381 / 4395 / 4410
Intraday Resistance 4370 / 4385
Golden Zone 4358 – 4345
Major Support 4335 / 4318
Deeper Support 4305 / 4285
Trendline Support Still intact from 4318
⸻
📈7️⃣ Analyst Summary
Gold regained bullish momentum but is now stalling under a key rejection zone. Overbought conditions suggest a retracement is likely before continuation. The safest high-probability setup is a pullback into the Fibonacci Golden Zone for continuation buys. A confirmed break above 4385 opens clean bullish continuation; however, a failure and breakdown below 4335 signals bearish control.
⸻
✅8️⃣ Final Bias Summary
Condition Bias
Above 4358 ✅ Bullish (Continuation Zone)
Above 4385 🚀 Strong Bullish Breakout
Between 4358–4335 ⚖️ Neutral / Waiting for direction
Below 4335 🔻 Bearish corrective wave expected
⸻
🥇 ElDoradoFx PREMIUM 2.0 – PERFORMANCE 20/10/2025 🥇
📊 GOLD TRADE RESULTS:
🟢 BUY +20 pips
🟢 BUY +210 pips
⚪️ SELL LIMIT – Deleted (No Entry)
⚪️ BUY LIMIT – Not Triggered
🔻 SELL +110 pips
🟢 BUY +150 pips
🟢 BUY +90 pips
---
💰 TOTAL GOLD PIPS WON: ✅ +580 pips
📈 RESULT: 7 Signals → 5 Wins | 0 SL | 2 No-Entry
🎯 ACCURACY (on active trades): 100% Wins on executed signals
---
🔥 Clean momentum day with strong BUY-side follow-through and precise executions.
If you followed along — your account should be smiling 📈💎
👏 Congratulations if you profited! ✅✅✅🚀🚀🚀

Buy Near Secondary Support, Beware of Double Top FormationThe price has entered the historical high area above 60 based on short-term support, and the 2H pattern is still bullish, but we must pay attention to selling pressure.
Take the secondary support (yellow line in the figure) as the main reference and go long on pullback.

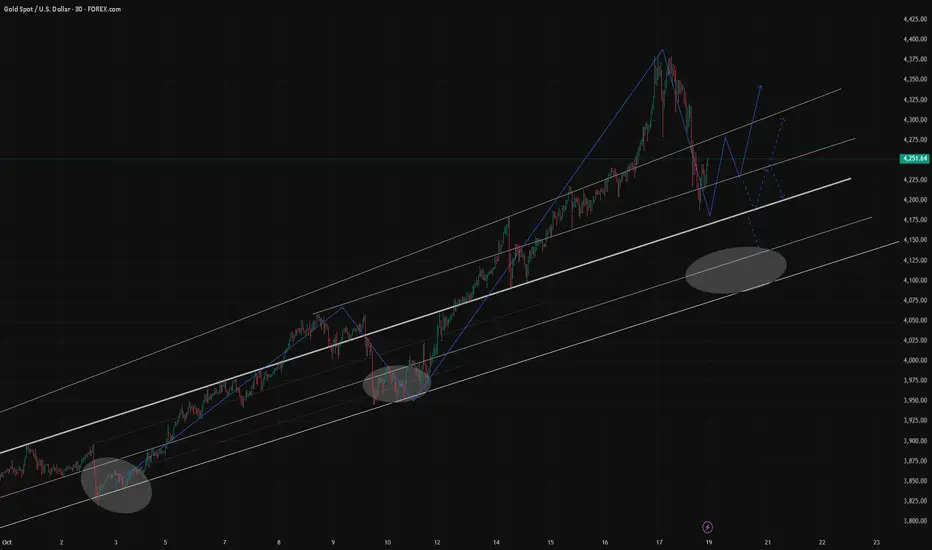
XAU/USD Bullish Reversal from Buy Zone – Targeting $4,392t: Gold Spot / USD (XAU/USD)
Timeframe: 30-minute
Current Price: $4,253.975
Trend: Recently broke below an ascending channel but bounced from a support zone.
🔍 Key Features on the Chart:
Ascending Channel (Yellow lines)
Price was previously moving inside a well-defined ascending channel.
It broke below the channel, suggesting a possible trend shift or correction.
Buy Zone (Purple Box ~ $4,200 - $4,220)
A demand zone where buyers stepped in.
Price bounced strongly from this zone, indicating support is respected.
Projected Price Path (Blue Zigzag Arrow)
Indicates a possible bullish wave structure (higher highs and higher lows).
Suggests a continuation of the uptrend after the correction.
Target Level: $4,392.539 (Blue Line)
A projected resistance or take-profit zone.
Price is expected to reach this level based on the bullish scenario.
🧠 Interpretation:
Bullish Bias: The chart suggests that the correction might be over after finding support in the "Buy Zone".
Entry Zone: Around $4,200–$4,220 appears to be a strong buy area.
Target: $4,392.539 (approx. +140 points from current level).
Risk Consideration: If price drops below the buy zone significantly, the bullish bias may be invalidated.
✅ Summary of Strategy:
Potential Buy: From current levels or on pullback toward the $4,220–$4,200 zone.
Stop-Loss: Below the buy zone (e.g., under $4,180 or based on your risk tolerance).
Target: Around $4,392.
If you'd like, I can help you:
Calculate potential risk/reward.
Convert this into a trading plan.
Monitor updates (with live data).

Gold has now broken through the resistance level at 4280As our mentioned before, Gold has now broken through the resistance level at 4280 and continues to rise,It may form a short-term bottom structure and further test the 4362 level. A break above the previous high of 4379 would open the door to further upside.
Buy 4280 - 4285
TP 4300 - 4310 - 4320
SL 4270
Daily-updated accurate signals are at your disposal. If you run into any problems while trading, these signals serve as a reliable reference—don’t hesitate to use them! I truly hope they bring you significant assistance

XAU/USD – Key Resistance Zone Test Ahead of Breakout DecisionCME_MINI:NQ1! GPW:FW201! GPW:FCDR1! GPW:FDNP1! GPW:FW401! GPW:FPEO1! GPW:FCDR1! GPW:FALE1! GPW:FMBK1! Gold Spot (XAU/USD)
Timeframe: 15-minute chart
🔍 Technical Analysis Summary
1. Trend Context
The chart shows a recent downtrend after a strong bullish rally.
A descending channel is drawn with two “TRADE LINE” boundaries — upper and lower.
Price is currently trading near the upper boundary of this bearish channel.
2. Resistance Zone
The highlighted resistance area around $4,270–$4,280 aligns with:
The upper trade line of the channel.
A previous support-turned-resistance level.
This makes it a key decision zone for potential reversals or breakouts.
3. Scenario 1 – Bullish Breakout (Blue Path)
If price breaks and closes above the resistance zone and upper channel:
A bullish move could target around $4,382 (the marked upper target).
Confirmation would come with a retest of the broken resistance that holds as new support.
This move aligns with a trend reversal structure (break of market structure).
4. Scenario 2 – Bearish Rejection (Purple Path)
If price fails to break above the resistance and gets rejected:
Expect a pullback continuation within the descending channel.
The next downside target is around $4,185, as labeled on the chart.
This would maintain the short-term bearish momentum.
🧭 Summary Outlook
Scenario Condition Target Bias
Bullish breakout Break & close above $4,280 $4,382 Reversal potential
Bearish rejection Rejection from resistance zone $4,185 Continuation of downtrend
⚠️ Key Watchpoints
Watch for price action confirmation (strong candle close) near the resistance zone.
A false breakout is possible; confirmation via retest is crucial.
Volatility spikes around this level could indicate institutional interest.

Gold Weekly Review — Historic Volatility & Next Week’s Key LevelThis week, gold experienced a historic level of volatility, a truly remarkable movement that left many traders astonished.
During the session, prices tested the 4200–4180 support zone for the first time. The nearly $200 decline effectively released the heavy selling pressure that had been building up in recent days, while also creating new opportunities for bullish entries.
As expected, once prices entered the support region, they rebounded strongly, closing above 4250 with a recovery of nearly $70 (all of which I had clearly indicated in advance).
From the 30-minute chart, the candlestick structure still suggests further upside potential. However, given the weekend uncertainty, any unexpected bearish news could trigger a pullback when markets reopen on Monday.
If no major negative developments occur, bullish momentum may continue to drive gold higher. Resistance is likely to be concentrated around the 4280–4300 zone — once price enters this region, both short-term buyers and trapped long positions may start adjusting their holdings, which could increase the likelihood of a short-term correction.
On the 4-hour chart, this nearly $500 rally has just completed its first test of the MA30 support. The MA5 (near 4270) currently acts as the key resistance, followed by MA10 (around 4292).
If during consolidation, the price can hold above MA20 (around 4246), it will likely attract renewed buying interest, potentially driving prices back toward 4380 or even higher.
Conversely, if prices remain under pressure and fail to stay above the MA20, attention should shift to the MA30 support. A break below this level could open the way to a test of the MA60(near 4100).
Therefore, for next week’s trading, these levels will be our key focus points.
As I mentioned earlier this week, the medium-term long positions have been closed, and we will wait for new opportunities to emerge. If the market drops toward 4100 or even lower, I will consider re-entering long positions from those lower levels.
A friendly reminder — always align your trading strategy with your own risk tolerance and financial situation. Medium-term setups require patience and strong risk-bearing capacity. If your current condition doesn’t allow for that, please avoid blind following to prevent unnecessary losses.
Lastly, note that gold still has two unfilled gaps around 4019–4024 and 3887–3898. If the trend turns bearish, these gaps may present potential trading opportunities.
That’s all for today.
We’ll discuss specific intraday trading opportunities when the market opens.
If you have any questions or need guidance, feel free to leave me a message.
Gold Trade Set Up Oct 20 2025Price has pushed up during London and swept BSL and is now testing a resistance area and 75 fib. If price stays closes under and make bearish structure on the 15m i will look for sells down towards SSL but if price closes above resistance and continues to make bullish structure on the 15m the target will be PDH

Price Rebounds Above 4,300 After Finding Support Near 4,200After a sharp pullback last Friday and a continued decline in the early session, the price is now finding clear support around the 4,200 level. Having rebroken above 4,300, it is likely to extend its upward movement
Buy@4250 - 4260
TP 4280 - 4290 - 4300 - 4320

BUY GOLD - XAUUSD- Amazing low risk high reward trade!Based on our deep analysis we can see that XAU/USD (gold) will head to the upside. Great time to BUY - it has broken all major resistance levels and has nowhere else to go except upwards. It is also struggling to break past powerful support levels. Buy gold!

THE KOG REPORTTHE KOG REPORT:
In last week’s KOG Report we gave the bias level as bullish above 4003 and the red box we would be looking for to break to then confirm the move into the region we wanted. The move played well from the opening going on to complete all the red box targets together with our algo targets on gold.
Although it being risky we wanted to short from the given region, but due to price breaking through without even halting, we updated traders with the higher region we were looking to target, which also worked well.
On Friday, we managed to identify the pattern we wanted and activated a target of 4197 together with the break below the bias level. This for us again worked well to end the week with a wonderful short and then a TAP AND BOUNCE from the indicator level giving those who missed the short and opportunity to capture a 200pip long to end the week.
A phenomenal week in Camelot, not just on Gold but the many other pairs we trade and analyse.
So, what can we expect in the week ahead?
So, this week I have a bit of a concern with this bearish move. I have a sneaky suspicion that they may not have completed upside as yet, and instead, want to get traders in to thinking the retracement has started. Just a inkling for now so let’s see how the week opens and what region we attack first.
Above, I have a reversal on the hourly and the 4H chart but the daily, weekly and monthly are still suggesting higher pricing. Ideally, we need another bearish day for price to leave the 4200’s and come close to the 4150 level to hold before we decide we’re going to either consolidate and accumulate here or get a deeper pull back. Below, we have 4220 which is the level that will need to break for us to go lower with the initial target below being 4165 and below that 4129.
Our key level here initially is the 4295 level and above that 4310. 4310 is the line in the sand for bulls to attempt to break to go higher and complete the move back above to create another all time high. Failure, and we should get more confirmation of a deeper pull back that should attempt to target the lower 4000 mark.
As usual, we’ll let the algo confirm the move, the indicators will tell us which way to stay in, and the liquidity indicator will tell us when to play caution. For now, the path is on the chart, let’s see how we open and begin the week.
KOG’s bias of the week:
Bullish above 4230
Bearish below 4220
RED BOXES:
Break above 4255 for 4265, 4270, 4284 and 4304 in extension of the move
Break below 4237 for 4230, 4220, 4210, 4206, 4185 and 4177 in extension of the move
Please do support us by hitting the like button, leaving a comment, and giving us a follow. We’ve been doing this for a long time now providing traders with in-depth free analysis on Gold, so your likes and comments are very much appreciated.
As always, trade safe.
KOG

Gold prices fluctuate. Betting on extraordinary rate cuts.Precious metals continued their previous surge last week. Gold set new records for five consecutive days, reaching a high of nearly $4,380, a new all-time high.
The ongoing US government shutdown, the Federal Reserve's renewed interest rate cut cycle, high debt levels, escalating Sino-US trade frictions, and the ongoing Russia-Ukraine conflict continue to fuel demand for gold as a safe haven, de-dollarizing, and asset allocation.
Last Friday, gold also fell sharply by nearly $200 to a high of around 4380, and hit a low of around 4188. Despite the sharp market decline, the price still rose by nearly 6% last week, marking its ninth consecutive week of gains. Mainly due to the bad loan problems of two US banks, global demand for safe-haven assets has surged.
From the daily chart, gold is still maintaining a slight upward trend. Last Friday's pullback coincided with the MA5 support level. This is most likely the maximum extent of gold's pullback. A complete shift from a bullish to a bearish trend is currently difficult. At the very least, it must first fall below the MA5 moving average before there will be further room for retracement. As it remains above the moving average and there is no particularly negative information for gold, the trend may continue to remain at a high level.
From the 1-hour chart, the Bollinger Bands are gradually narrowing, and prices are likely to remain range-bound. Current support lies near the lower Bollinger Band at 4215, while upward pressure is expected in the 4270-4280 range.
Although prices fell below the lower Bollinger Band last Friday, they subsequently rebounded. This trend continued in the Asian session on Monday, reaching near the middle Bollinger Band. Prices are still holding above the lower Bollinger Band and trading at a high level.
Overall, the trend remains relatively strong until the price breaks below 4215. With prices trading above this level, buying on dips in the short term is still a viable option.
More real-time trading strategies are being released in the channel, so stay tuned.

XAUUSD analysis – 1H OB SetupThe overall market structure remains bullish, forming consistent higher highs and higher lows.
Currently, price is showing signs of a controlled pullback after a strong impulsive leg, and the most probable scenario is a retest of the 1H Order Block around 4110–4130.
That zone holds unmitigated buy orders and sits right below local equal lows — a perfect liquidity pocket before continuation.
We’ll wait for price to sweep that area and confirm a new bullish leg through a lower timeframe confirmation (BOS + FVG + OB alignment) before entering longs.
If the zone reacts cleanly, the next target will be the recent highs (around 4270–4300).
Only a clean break below 4100 would invalidate the bullish scenario for now.
📊 ProfitaminFX | Gold, BTC & EUR/USD
📚 Daily setups & educational trades

GOLD:Ranging between 4200-4280,awaiting guidance from news flows📈Gold exhibited a trend of surging higher and then pulling back today. In the early session, stimulated by news of localized conflicts in the Middle East, risk-aversion sentiment picked up, driving gold prices higher. After the opening, prices surged rapidly to 4,273.99. However, signs of de-escalation emerged afterward, cooling risk-aversion sentiment.
Meanwhile, factors such as early signs of a decline in U.S. auto loan rates and fading expectations of a Fed rate cut led some funds to shift from gold to U.S. dollar assets, resulting in a drop in gold prices.
📝From a technical perspective, the key resistance level above is around 4280. If gold can hold firmly above this level, it may form a short-term bottom structure and further test the 4362 level. A break above the previous high of 4379 would open the door to further upside. The support level below is near 4200; if this support fails to hold, gold prices may fall further to 4150 or even lower.
📝From a fundamental perspective, there are many uncertain factors in the market. While there are hints of news such as a Russia-Ukraine ceasefire and China-U.S. trade negotiations, the outcomes remain uncertain. If the negotiations do not go smoothly, it may once again benefit gold. Additionally, the probability of a U.S. government shutdown has increased, which provides some support for gold prices.
♦Overall, the Gold is likely to fluctuate within the 4200–4280 range in the short term, waiting for further guidance from fundamental news.
Buy 4220 - 4225 TP 4235 - 4245 - 4255 SL 4210
Sell 4270 - 4275 TP 4265 - 4255 - 4245 SL 4280
Daily-updated accurate signals are at your disposal. If you run into any problems while trading, these signals serve as a reliable reference—don’t hesitate to use them! I truly hope they bring you significant assistance

ElDoradoFx PREMIUM – GOLD ANALYSIS (20/10/2025, LONDON SESSION)Gold is currently trading around 4,228 after failing to sustain above 4,260 in the previous session. The pair has entered a corrective phase, forming a near-term lower high structure on intraday charts. Despite the pullback, the broader bullish trend remains intact, but momentum has temporarily shifted bearish. The upcoming London session will determine whether buyers step in from key retracement zones or if a deeper retracement develops.
⸻
📊 2. Technical Breakdown
✅ Daily (D1)
• Overall trend remains bullish with a corrective dip.
• Last candle shows a bearish wick from the 4,260 rejection zone.
• RSI cooling from overbought territory → indicating controlled correction.
✅ Bias: Bullish long-term, corrective near-term.
✅ 1H Chart (H1)
• Price broke minor intraday support and is currently consolidating near 4,228.
• Trading below 50 EMA, indicating reduced short-term momentum.
• Minor lower highs forming → sellers in control short-term until a bullish reclaim occurs.
📉 Bias: Neutral to bearish below 4,241, bullish above 4,241.
✅ 15M–5M
• Price structure shows intraday descending sequence.
• Small bullish attempts seen near 4,220–4,230, but no confirmed reversal yet.
• Momentum (MACD) still bearish but stabilizing.
📌 Bias: Waiting for either rejection or continuation signal around key zones.
⸻
📐 3. Fibonacci Analysis
Swing Low: 4,197
Swing High: 4,260
Level Price Confluence
38.2% 4,241 Minor intraday resistance & EMA zone
50% 4,229 Current consolidation price
61.8% 4,220 Trendline + previous demand
78.6% 4,209 Liquidity sweep zone
✅ Golden Zone: 4,229 – 4,220 → key reaction area for bullish continuation.
⸻
🎯 4. High-Probability Trade Scenarios
✅ A) Bullish Continuation (Primary Bias if Golden Zone holds)
✔ Entry Trigger: Bullish confirmation inside 4,229–4,220
🎯 TP1 → 4,241 | TP2 → 4,250 | TP3 → 4,260
🛑 SL: Below 4,209
⸻
✅ B) Momentum Buy (Break & Retest)
✔ Trigger: Break & retest above 4,241 (Fib + EMA reclaim)
🎯 TP1 → 4,250 | TP2 → 4,260 | TP3 → 4,279
🛑 SL: Below 4,229
⸻
⚠️ C) Bearish Continuation (Countertrend)
✔ Trigger: Break & retest below 4,220
🎯 TP1 → 4,209 | TP2 → 4,197 | TP3 → 4,180
🛑 SL: Above 4,236
⸻
📰 5. Fundamental Watch
Time Event Impact
All day Middle East sentiment risk Supports gold if tensions rise
London open DXY reaction Strong USD = pressure on gold
Later US session PMI data expected Can shift intraday direction
DXY currently weak near 104.50 → supports possible rebound in gold if structure holds.
⸻
📌 6. Key Technical Levels
Resistance Support
4,241 4,229
4,250 4,220
4,260 4,209
4,279 4,197
📍Trendline support aligns strongest around 4,220.
⸻
📣 7. Analyst Summary
Gold is in a corrective pullback phase inside a long-term uptrend. The Golden Zone (4,229–4,220) is the key battleground between bulls and bears. If price reacts positively and H1 structure shifts bullish above 4,241, continuation toward 4,260 is likely. However, failure to hold above 4,220 could extend the retracement toward 4,197.
⸻
🎯 8. Final Bias Summary
Condition Outlook
✅ Holds 4,229–4,220 Expect bullish continuation
📈 Breaks & retests above 4,241 Momentum reversal confirmed
❌ Breaks below 4,220 Bears take control toward 4,197
⚠️ Break above 4,260 Bull run continuation resumes
📌 Awaiting London confirmation from Golden Zone for bullish re-entry.
