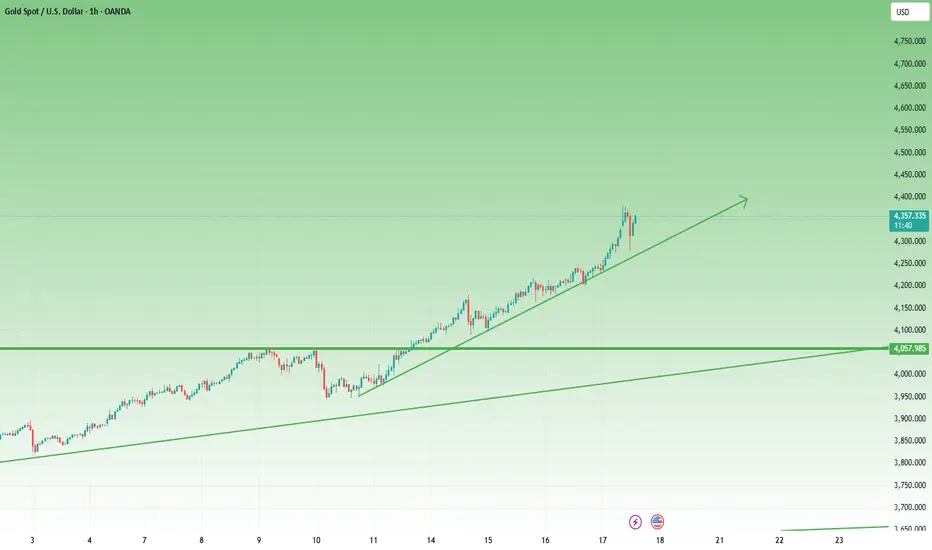
Interest rate cuts and safe-haven support gold. 4,400 is unstoppInformation Summary:
Spot gold surged strongly in early Asian trading on Friday, surging over 1.2% to a record high of $4,379.38 per ounce. Gold prices have risen nearly 9% this week and are expected to continue rising for nine consecutive weeks. This surge is primarily driven by strong market expectations of Federal Reserve rate cuts in October and December, coupled with a surge in SPDR gold holdings, which has boosted bullish sentiment.
In addition to monetary policy expectations, multiple positive factors are fueling gold's upward momentum. The risk of a US government shutdown and the tense international trade situation continue to attract safe-haven funds to gold. At the same time, the continued gold purchases by central banks of many countries around the world and the long-term trend of "de-dollarization" have fundamentally consolidated the support for gold. Amidst increasing geopolitical and economic uncertainty, gold's safe-haven properties are becoming more prominent, and analysts believe that a challenge to the $4,400 mark may be just around the corner.
Market Analysis:
Technically, after a strong breakout above key resistance at $4,200, gold is now approaching the psychologically important $4,400 level, maintaining its short-term bullish trend.
The trading strategy recommends focusing on whether the market can continue to be strong, but be wary of the risk of profit-taking at high levels. A conservative strategy should prioritize buying on dips, with the key support range moving up to $4,310-4,300. If prices fall back to this area and find effective support, it would be a good opportunity to go long with the trend, targeting a new high of $4,400. However, it is crucial to note that an unexpected break below $4,300 could trigger a significant technical correction, potentially leading to a deeper correction towards $4,250.
Therefore, caution is advised when pursuing long positions at current highs, with strict stop-loss orders in place.
Trading strategy:
Buy stocks in batches when the price dips back to the 4320-4315 range. Set a stop-loss at 4310. Profit range: 4360-4370-4390.
Xauusdsignal

Bulls are taking off. Please maintain your bullish strategy.Gold rose steadily after the Asian market opened on Thursday, reaching a high near 4242 before retreating. It reached a low near 4203 before continuing its advance, a so-called symbolic pullback.
The magnitude of this move does appear to be favorable, offering traders an opportunity to enter the long position. However, this strong market also creates confusion for traders. Going long during the rally fears a price correction, while going short fears continued bullish momentum. Current trading is heavily influenced by luck.
The US market continued its upward trend on Thursday, reaching a high near 4330. The strength continued in early Asian trading on Friday, reaching a high near 4380. Amidst this frenzied market, all we can do is patiently wait for a pullback before entering the long position. After all, conservative trading is more rational at this point.
Support below is near 4315, a peak-to-trough reversal point. This level can also be considered as a short-term entry point. Faced with the absolute dominance of bulls, the market has become somewhat helpless, and continuing to chase long positions carries the risk of a pullback. Quaid recommends strictly controlling stop-loss orders to avoid significant losses from a deep price correction.
Trading Strategy:
Go long on a pullback near 4315-4310, with a stop loss at 4305 and a profit range of 4380-4390.
Aggressive traders can enter the long position after a 20-point pullback, but please consider your trading capital carefully before entering.

ElDoradoFx PREMIUM – GOLD ANALYSIS (17/10/2025, LONDON SESSION)Prepared by: ElDoradoFx Premium Analyst Team
⸻
🧭 Market Overview
Gold remains in a strong bullish cycle, printing higher highs and higher lows across all major timeframes. However, after multiple rejections near $4,379–$4,380, the market is showing temporary exhaustion, hinting at a possible short-term retracement before continuation.
RSI readings above 85 on the daily chart suggest the metal is overbought, yet momentum structure remains intact.
⸻
📊 Technical Breakdown
1️⃣ Daily Chart (D1)
• Structure: Clear bullish trend continuation.
• RSI: 86.0, signaling potential short-term correction.
• Key Support: 4,316 – 4,273 (previous resistance now turned support).
• Bias: Bullish but extended — watch for retracement into 38.2%–61.8% Fib zone.
2️⃣ 1H Chart (H1)
• Price rejected resistance at 4,379, forming a lower high with weakening MACD histogram.
• 50EMA and 200EMA both sloping upward — overall momentum remains long-term bullish.
• Support Zone: 4,336–4,318 (Fibonacci confluence).
• Bias: Short-term corrective retracement expected before new buying momentum resumes.
3️⃣ 15M–5M Charts
• Consolidation within a tight intraday channel.
• Liquidity above 4,379 remains uncollected — likely target after correction.
• MACD turning flat, confirming short-term pause.
⸻
📐 Fibonacci Analysis (Last Swing: 4,273 → 4,379)
Level Price Confluence
38.2% 4,336 Near EMA50 & intraday support
50.0% 4,326 Mid-channel support
61.8% 4,318 Trendline intersection / re-entry zone
📊 Fibonacci Golden Zone: 4,318–4,336
→ Optimal area to look for bullish confirmation patterns before re-entry.
⸻
🎯 High-Probability Trade Scenarios
✅ BUY SCENARIO (Primary Bias)
• Break & Retest: Above 4,364, confirming short-term bullish continuation.
• Retest Zone: 4,350–4,355
• Targets:
• TP1 → 4,379
• TP2 → 4,395
• TP3 → 4,410
• Stop-Loss: Below 4,338
⚠️ SELL SCENARIO (Countertrend Opportunity)
• Break & Retest: Below 4,336, signaling potential correction phase.
• Retest Zone: 4,336–4,345
• Targets:
• TP1 → 4,318
• TP2 → 4,300
• TP3 → 4,273
• Stop-Loss: Above 4,355
🚀 AGGRESSIVE BREAKOUT BUY
• Trigger: Clean breakout above 4,379 and candle closure.
• Retest Zone: 4,372–4,379
• Targets: 4,395 → 4,410 → 4,428
• Stop-Loss: Below 4,355
⸻
📰 Fundamental Outlook
• US Data: Light calendar until NY session; traders watching inflation expectations.
• DXY: Below 104.80, maintaining downward bias, supportive for gold.
• Yields: Neutral; no fresh upside momentum observed.
• Global Sentiment: Slightly risk-off, benefiting gold as a hedge.
⸻
⚙️ Key Technical Levels
Type Levels
Resistance 4,379 / 4,395 / 4,410
Support 4,336 / 4,318 / 4,273
Pivot Zone 4,350–4,355 (London liquidity area)
⸻
🧾 Analyst Summary
Gold remains structurally bullish while holding above 4,336, though an intraday pullback into the Fibonacci Golden Zone (4,318–4,336) would offer better long entry opportunities.
A confirmed break above 4,379 can open a clean path toward 4,410–4,428.
If 4,336 fails to hold, expect a healthy retracement toward 4,300–4,273 before the next bullish impulse.
⸻
📈 Bias: Bullish above 4,336 — Corrective phase expected before continuation.
📉 Alternative Bias: Bearish short-term below 4,336 (retracement only).

17/10/68 : XAUUSD ( Europe / London Session )Using it from Europe Session until 7.00PM , I'll new analysis and update at 8.00PM
Resistance
4396-4401
4386-4391
4381
Support
4370
4360-4365
4349-4355

Gold – Madness in MotionGold rose this week — so far (and I really want to stress so far ) — by around 10%. That’s massive by any standard.
On Monday, I tried to catch a dip and missed it. Since Tuesday, I’ve been on the sell side — completely wrong on direction , yet somehow still managed to finish positive overall.
Yesterday my stop got hit, but after what happened overnight, it turned out to be just a scratch. With this kind of volatility, a recovery of 250pips can happen in ten minutes.
Looking at the chart — it’s bullish, no question. Should it be bought? Hmmmm...
Looking at the volatility… for me, it’s become untradeable.
Can it keep going higher? Of course.
How high? Nobody knows.
At this point, any prediction is just throwing numbers in the air.
Trading corrections, as I’ve tried to do, is a guessing game. I’ve had some luck so far, but after yesterday's stop loss, I’m stepping aside.
My take: stay out. Let others make money if they can.
A 1,000-pip rise and an equal reversal — all while I was asleep (and trust me, I sleep very little) — is too crazy. Stops can be wiped for bulls just as easily as for bears.
At some point, it will settle down and define its levels.
Until then — it’s not for me anymore.
Gold Price Outlook – Trade Setup (XAU/USD)📊 Technical Structure
OANDA:XAUUSD Gold surged to a fresh record near $4,380 before retracing lower, now consolidating around $4,320–$4,330. The support zone sits at $4,301–$4,290, while the resistance zone is located at $4,368–$4,377. Price action shows a sharp pullback from highs, but bulls still hold ground above the key support. A rebound scenario could see a push back toward the resistance, while a decisive break below $4,285 would invalidate the bullish setup.
🎯 Trade Setup (Bullish Scenario)
Entry: $4,301–$4,290 (near consolidation & above support)
Stop Loss: $4,285
Take Profit 1: $4,350
Take Profit 2: $4,368
Take Profit 3: $4,377
Risk/Reward: ≈ 1 : 4.91
🗝️ Key Technical Levels
Resistance: $4,350 / $4,368 / $4,377
Support: $4,301 / $4,290
🌍 Macro Background
Gold remains supported by Fed rate cut bets, US-China trade frictions, and prolonged US government shutdown fears.
Fed Policy: Powell and Waller signalled two more cuts this year, reducing the opportunity cost of holding gold.
US-China Tensions: Additional port fees and tariff threats fuel safe-haven demand.
US Government Shutdown: Entering its third week, weighing on the USD and indirectly boosting gold.
Geopolitics: Some easing in Ukraine risks could cap upside, but macro drivers remain gold-positive.
📌 Trade Summary
Gold remains in a strong uptrend despite intraday corrections. A long setup near $4,301–$4,290 with stops under $4,285 offers a favourable risk-reward toward $4,368–$4,377. Safe-haven demand and dovish Fed expectations continue to support bullish momentum.
⚠️ Disclaimer
This analysis is for reference only and does not constitute trading advice. Trading involves significant risk, and proper risk management is essential.

Gold breaks through again. Watch for entry opportunities.Information Summary:
Gold continued its upward trend in early Asian trading on Friday, reaching a new all-time high of 4,380. Trade tensions, the ongoing US government shutdown, and bets on a Federal Reserve rate cut all fueled gold's gains. Furthermore, a plunge in US bank stocks dragged down US stocks, fueling risk aversion that further accelerated gold's upward momentum.
Concerns about the credit quality of the US economy and escalating friction over tariffs have also boosted demand for safe-haven assets. Furthermore, the renewed conflict between Russia and Ukraine, with the US supplying Tomahawk cruise missiles to Ukraine, has heightened gold's safe-haven appeal. In an era of heightened global uncertainty, gold remains an asset worth watching. Traders are advised to closely monitor market expectations for the Federal Reserve meeting, news related to the international trade situation, and geopolitical developments.
Market Analysis:
Gold is hitting new highs daily. Recently, I've been reminding everyone to buy on dips. The bull market remains strong. On Thursday, the price surged by $177, reaching a high of 4380. If the market continues to break through 4400, the next target will be 4450.
Gold bulls remain firmly in control, extending their record-breaking rally with no signs of fatigue. The 1-hour chart shows no significant pullbacks. In the short term, gold trading above 4300 is considered strong. Continue buying gold even if it retreats. Patiently wait for opportunities.
Trading strategy:
Short-term gold long position at 4310-4315, stop loss at 4300, profit range at 4370-4390;
Key points:
First support level: 4335, second support level: 4310, third support level: 4300
First resistance level: 4380, second resistance level: 4400, third resistance level: 4428

ElDoradoFx PREMIUM 2.0 – GOLD (17/10/2025, ASIA SESSION)Gold is currently trading around 4,362, maintaining strong bullish momentum after breaking the 4,350 psychological level. The market remains in an extended uptrend, but RSI and structure show overbought signs, so a short-term correction or retest may occur before continuation.
⸻
🔍 Technical Outlook
D1: Strong bullish structure with higher highs and higher lows. RSI (88.1) indicates extreme overbought — possible short-term pullback.
H1: Price reached the top of the ascending channel at 4,379 (new high) and is now consolidating below. Momentum remains positive above 4,340, but divergence is forming.
15M–5M: Minor rejection from 4,379–4,380 resistance zone; MACD showing slowing bullish histogram — suggesting potential retest before next leg up.
⸻
📊 Fibonacci Golden Zone (Latest Swing)
Swing Low → 4,291
Swing High → 4,379
🎯 Golden Zone = 4,324–4,338
This aligns with 50EMA + channel midline — ideal retracement area for new buy entries if price dips.
⸻
🎯 High Probability Entry Zones (Break & Retest)
✅ BUY SETUP (Main Bias)
• Break & Retest: Above 4,363 → Retest zone 4,350–4,355
🎯 TP1 → 4,379 TP2 → 4,395 TP3 → 4,410
🛑 SL below 4,338
⚠️ SELL SETUP (Short-Term Countertrend)
• Break & Retest: Below 4,338 → Retest zone 4,338–4,345
🎯 TP1 → 4,324 TP2 → 4,310 TP3 → 4,294
🛑 SL above 4,355
🚀 BREAKOUT BUY (Aggressive Setup)
• Break & Retest: Above 4,379 (new high) → Retest 4,372–4,379
🎯 TP1 → 4,395 TP2 → 4,410 TP3 → 4,428
🛑 SL below 4,355
⸻
🕐 Fundamental Watch
• DXY slightly weaker near 104.85, favoring gold’s bullish continuation.
• Yields remain capped — positive for metals.
• No major Asia-session news expected — technicals will drive price action.
⸻
⚠️ Key Levels
Resistance → 4,379 / 4,395 / 4,410
Support → 4,338 / 4,324 / 4,310
⸻
✅ Summary
Gold remains bullish while above 4,338 (Golden Zone support).
A break & retest above 4,363 opens room for continuation toward 4,395–4,410.
Failure to hold above 4,338 may trigger a healthy pullback to 4,310–4,294 before new buyers step in.

Gold Broke The ceiling of the Bullish Flag to claim $4K Pivot The price of gold has consecutively surge in price for the past 2 months to break the ceiling of the bullish flag pattern formed based on the 4-hour chart.
The asset has gained 35% so far earning almost $1200 prior the surge. With investors sentiment shifting to the asset Gold might claim the 4k resistant this last quarter.
With the RSI at 83, the asset is currently overbought with possible retracement to the $4200 Zone before the next legged up.

GOLDI think this chart is bullish to 6400$ and complete TVC:GOLD 2-leg target.
Best support for pullback 1900$ to 900$ that i think not touch this supports but this rally is very strange.
Please control your money management.

Gold: Full verification of today's trend prediction👏Our prediction for today's gold trend has been validated by the market:
1.Key Level Prediction: We previously indicated that after consolidating with oscillations during the daytime, gold would require close attention to the breakthrough and stabilization of the 4250 level, a break above this level was expected to sustain an upward momentum. The actual market movement showed that after completing its daytime fluctuations, gold successfully broke through 4250, stabilized above it, and immediately initiated an upward rally.
2.Target Range Achievement: Based on the breakthrough logic, we set the preset upward target range at 4280 – 4300. By the end of today’s trading session, gold had successfully reached this range, peaking at 4298.64. The accurate realization of the target validates the effectiveness of our judgment on bullish momentum and resistance levels.
💡Our today’s prediction for gold was built on the core framework of "technical key level breakthrough + trend continuity": it focused on the "sustained bullish momentum following a breakthrough of key resistance", and incorporated an analysis of market sentiment and volume logic. Ultimately, this resulted in a high degree of alignment between the prediction and the actual market trend.

4300 is just the beginning, it is expected to reach 4500Affected by the continued impact of the US government shutdown, gold in the US market rose strongly. After hitting a high of 4292, it quickly fell back and rebounded, setting a new historical high of 4298. But judging from the current trend, this is obviously not the peak of gold prices. If the short-term rise continues, it is expected to test the pressure of the 4,300 integer mark.
As the short-term trend line is broken, the previous resistance is gradually transformed into support. Pay attention to the short-term support range of 4275-4260 below. If this range can be held, gold will set a new high.
OANDA:XAUUSD

Gold (XAU/USD) Breakout Rally Toward New Highs!Analysis:
Gold (XAU/USD) continues its strong bullish momentum on the 4-hour chart, forming a series of higher highs and higher lows, confirming a sustained uptrend. The recent breakout above the resistance zone near $4,150–$4,170 indicates renewed buying interest and momentum buildup.
After a brief retest of the breakout area, price has started climbing again — a sign of trend continuation supported by bullish candle formations and strong market sentiment.
Technical Outlook:
Support Zone: $4,140 – $4,170 (previous resistance turned support)
Bullish Confirmation: Continuation pattern with clean structure and volume support
Momentum Bias: Strongly bullish while above $4,150
🎯 Target: $4,300 – $4,320 zone
🛑 Stop Loss: Below $4,140 to limit downside risk
📈 Summary:
As long as gold stays above the breakout level of $4,170, the market remains bullish, with upside potential toward $4,300–$4,320, aligning with the next major resistance area.

Gold: Keep an eye on the 4280–4300 rangeAs we predicted for today’s target range, gold is currently fluctuating between 4230 and 4250. After stabilizing above 4230, it once again staged a strong rally, peaking at 4250.91 before pulling back with a certain decline — this also confirms the resistance effect at the 4250 level today.
However, we confirm that a break above 4250 can be achieved in an instant. After breaking through and stabilizing above 4250 next, we will focus on the resistance zone around 4280–4300. For short-term support below, the key focus remains on the range of 4200–4175.

A strong market. Timing is crucial.Gold prices continued their upward trend for the fifth consecutive day, reaching a new record high. Concerns about the economic risks posed by the US government shutdown, international trade wars, and escalating geopolitical tensions continue to drive capital flows into gold, a traditional safe-haven asset.
Furthermore, recent speeches by most Federal Reserve officials have paved the way for interest rate cuts, making the market virtually certain that an October rate cut is a foregone conclusion, with even a 100% probability of a December cut. The government shutdown, which has lasted 15 days and is costing approximately $15 billion in lost economic output daily, has also led to a decline in the US dollar index, which has fallen for two consecutive trading days, further bolstering gold's upward momentum.
On the 4-hour chart, prices continue to trade along the upper Bollinger Band. Despite a slight pullback early on, they have rebounded strongly, with current support levels moving up to around 4240-4230. Bullish momentum remains strong in the short term. Quaid believes the trading strategy remains focused on buying on pullbacks. However, caution is advised when following orders mid-trade to prevent sudden price pullbacks from causing losses. Please follow our channel for more real-time trading strategies.
Trading Strategy:
Buy in batches between 4240 and 4230, with a 10-point stop-loss. Profit range: 420-4280-4300.

16/10/68 : XAUUSD ( US Session )Using it from US Session until 11.00AM , I'll new analysis and update at 12.00PM
Resistance
4260-4265
4250-4255
4245
Support
4234
4223-4229
4213-4218

Gold’s Next Play: Liquidity Sweep or Smart Money Reaccumulation?> Gold has been in a clear premium zone, engineering multiple liquidity pools at the highs ($$$). A clean FVG and valid OB remain below — potential footprints of institutional rebalancing.
The current structure may hint toward an inducement move (IDM) before price seeks deeper liquidity and possible reaccumulation. Smart Money often plays its hand quietly — the key is to observe reaction, not prediction.
This setup is built purely for educational and analytical purposes, focusing on Smart Money Concepts (SMC), Liquidity Theory, and Institutional Order Flow.
Patience defines precision. Let the market unfold its intent — not every move deserves a chase.
Stay tuned — I’ll continue sharing SMC-based trade ideas, educational breakdowns, and gold analysis on this profile 🔥
💬 Comment your view below — let’s build a strong community of smart money traders!
#InsideTradeVision | #XAUUSD | #SMC | #LiquiditySweep | #PriceAction | #SmartMoney

Gold Trade Set Up Oct 16 2025Gold is trading above PDH and broke structure on the 1h creating a new HH but i first want to see a sweep of SSL/London lows followed by a 15m bullish candle close to then a push higher to ATH

ElDoradoFx PREMIUM – GOLD (16/10/2025, US SESSION)Professional Technical & Fundamental Breakdown by ElDoradoFx
Gold is currently trading near 4,241, consolidating below the resistance zone 4,246–4,250, after a strong bullish rally in the London session. The market structure remains bullish, but there are signs of temporary exhaustion at the top of the ascending channel.
⸻
🔍 Technical Outlook
Daily (D1):
• Price continues forming higher highs, maintaining strong bullish momentum.
• RSI remains extremely overbought (85.4), suggesting limited upside before a corrective move.
• MACD still bullish but starting to flatten — showing early divergence risk.
1H (H1):
• Price touched the upper channel trendline at 4,247 and rejected slightly, forming a weak high.
• EMAs (50 & 100) are below price supporting structure; however, bullish momentum is slowing down.
• RSI at 64.7 — healthy but approaching overbought intraday conditions.
15M–5M:
• Multiple BOS confirmations and minor pullbacks indicate bulls still in control.
• MACD shows positive momentum but histogram is flattening — suggesting a possible short-term retracement before continuation.
• Immediate intraday support located at 4,228–4,230 zone.
⸻
📊 Fibonacci Golden Zone (Latest Swing)
Swing Low → 4,203
Swing High → 4,247
🎯 Golden Zone = 4,223–4,230
This zone aligns with 50EMA and channel mid-support — ideal re-entry point if price pulls back before resuming the uptrend.
⸻
🎯 High Probability Entry Zones
✅ BUY SETUP (Main Bias)
Entry Zone: 4,223–4,230 (Golden Zone)
🎯 TP1 → 4,242 TP2 → 4,255 TP3 → 4,268
🛑 SL below 4,210
⚠️ SELL SETUP (Short-Term Countertrend)
Entry only if price fails again to break 4,247 and closes below 4,228
🎯 TP1 → 4,215 TP2 → 4,203 TP3 → 4,185
🛑 SL above 4,250
🚀 BREAKOUT BUY (Aggressive Setup)
Buy above 4,247 (Clean Breakout)
🎯 TP1 → 4,260 TP2 → 4,275 TP3 → 4,290
🛑 SL below 4,228
⸻
🕐 Fundamental Outlook
• DXY trading flat around 105.05, failing to extend upside — mildly supportive for gold.
• Yields remain steady, adding temporary equilibrium to the market.
• Fed speakers later today could trigger intraday volatility; trade with caution near resistance zones.
⸻
⚠️ Key Levels to Watch
Resistance → 4,246 / 4,255 / 4,268
Support → 4,230 / 4,223 / 4,210 / 4,203
⸻
✅ Summary
Gold remains in a strong bullish structure.
If 4,223–4,230 holds, expect continuation toward 4,255–4,268.
Failure to hold 4,228 could open retracement toward 4,203–4,185 before resuming upside.

Gold hits a new high. Go long on a pullback to 4180-4190.Gold continued its upward trend for the fifth consecutive day, with the current price approaching 4250 points as global anxiety persists. Investors are concerned about the economic risks posed by the US government shutdown, international trade wars, and escalating geopolitical tensions, which continues to drive flows into the traditional safe-haven asset of gold.
Traders now appear to have almost fully priced in the possibility of two more US Federal Reserve rate cuts this year. This has pushed the US dollar to a one-week low and bolstered the case for further near-term appreciation in gold. Meanwhile, gold bulls appear unfazed by extremely overbought conditions on short-term charts. This further validates the commodity's positive short-term outlook ahead of speeches by several influential Federal Open Market Committee (FOMC) members.
Although the bullish trend is quite obvious, it is difficult to keep track of the entry point in real time. The recent price increases are almost all in a straight line. Trading during the rise is risky but suitable for the current market. However, a more stable transaction is to wait for the price to pull back before going long.
From the current technical perspective, the Asian market rose in the early morning, and rebounded strongly after a slight correction in the European session. The short-term strong support is around 4180. It is relatively stable to go long at this price. The upward point should focus on 4060 and above. Of course, you cannot guess the top.
It should be noted that if there is an unexpectedly large adjustment space, you can pay attention to around 4160 below.

Continue to go long. When to enter?Gold started to rise steadily in the early Asian session on Wednesday, reaching a high of around 4218 but unexpectedly fell back quickly. It reached a low of 4164 and continued to rebound rapidly, and then has been fluctuating around the 4180-4200 range.
It continued to rise after opening on Thursday, setting a new high. The current high has reached around 4242. The strong upward trend is also the basic operation in the near future. However, the sudden and unexpected drop amidst this steady upward trend has left the market feeling somewhat frustrated and has discouraged many traders from chasing the gains.
In the short term, gold's volatility in the US market may be accumulating momentum for the next round of bullish gains. The daily chart remains strong, making it difficult to predict the top. Judging from the recent market performance, all pullbacks are traps set by the bulls, and the bulls are currently continuing to consolidate above 4230. Quaid recommends waiting patiently for the pullback before continuing to go long.
In the short term, buy around 4210-4205, with a profit range of 4240-4250 and a stop loss of 4195.

Gold Plan | Where will gold drop today?🔍 Market Context
Gold continues to maintain a short-term upward trend following a series of Break of Structure (BoS) , confirming active buying from lower zones.
Currently, the price is approaching the ATH GOLD zone and heading towards the Liquidity Sell Zone 4,281 USD – a densely liquid area where short-term sell reactions from major players may occur.
After a hot rise, technical correction risks are starting to increase. Lower zones like 4,186 – 4,152 – 4,130 USD will be potential “accumulation zones” for institutional buyers in the upcoming pullback.
💎 Technical Analysis
ATH GOLD: 4,275 – 4,280 USD
Liquidity Sell Zone: 4,281 – 4,285 USD → high liquidity resistance area, may trigger short-term reversal reactions.
Liquidity Zone $$$: 4,186 – 4,152 USD → crucial support area in the uptrend, where technical reactions are expected.
FVG – BoS Zone: 4,152 – 4,148 USD → “price balance” zone yet to be filled, likely to be retested.
OB Deep Zone: 4,130 – 4,120 USD → deep demand zone converging with Fibo 0.786 – ideal area for large capital to re-accumulate.
Overall structure remains bullish , but in the premium zone – an area where institutions typically distribute orders to gain liquidity before adjusting.
📈 Trading Scenarios
1️⃣ Main Scenario – Sell reaction at Liquidity Zone 4,281 USD
When the price hits the 4,275 – 4,281 USD zone and clear reversal signals appear (rejection candles, bearish engulfing, or minor structure break),
→ open short-term sell orders (scalp/intraday).
Target: 4,186 → 4,152 USD.
Stop Loss: above 4,285 USD.
➡️ This is a typical “liquidity sweep – technical reaction” scenario, capitalising on short-term sell-offs at high liquidity peaks.
2️⃣ Secondary Scenario – Buy back following the main trend after correction
When the price corrects to the 4,186 – 4,152 USD zone or deeper to OB Deep 4,130 USD ,
and clear upward confirmation signals appear (strong rejection or minor BoS increasing again),
→ open buy orders in line with the main trend.
Target: 4,230 → 4,275 USD.
Stop Loss: below 4,120 USD.
➡️ Trend-following scenario – waiting for price correction to discount zones to accumulate in line with the larger trend.
⚠️ Risk Management
Do not FOMO buy when the price is hitting the 4,275 – 4,281 USD zone.
Prioritise short-term sells with clear confirmations or buys at lower OB zones.
Keep light volume when trading against the main trend.
Observe reactions at the 4,186 zone – this is the key level of the day.
💬 Conclusion
Gold is at the peak of the current rise , short-term profit-taking pressure may appear around the 4,281 USD zone.
If strong reactions occur, a correction to the 4,186 – 4,152 USD zone is reasonable for market rebalancing.
The larger trend remains upward , so lower OB zones will be reasonable buy opportunities for the next wave.
👉 Reasonable Strategy:
Sell reaction at 4,281 USD when reversal signals appear.
Buy back at 4,186 – 4,152 – 4,130 USD when confirmation signals appear.

Gold: Go long around the 4205–4210Gold has risen for the fifth consecutive day, briefly breaking through the all-time high of 4241.99, before pulling back to around 4210 as the U.S. Dollar Index regained lost ground.
From the 4-hour chart perspective, focus on the short-term support range of 4196–4200 in the near term, with key emphasis on the critical support zone of 4160–4180. Based on its recent performance, all pullbacks are traps set by bulls. Currently, bullish momentum remains intact as prices consolidate above 4230. The only viable approach is to wait patiently for retracements before entering long positions.
For intraday gold trading, we recommend entering long positions around the 4205–4210 range, with targets set near 4230 and 4250. Given the strong bullish trend, there is no clear top in sight. Operationally, prioritize buying on dips; avoid trading in the middle range and refrain from chasing rallies recklessly. Exercise patience and wait for entries at key levels.
Buy 4205 - 4210
TP 4230 - 4250
SL 4195
Daily-updated accurate signals are at your disposal. If you run into any problems while trading, these signals serve as a reliable reference—don’t hesitate to use them! I truly hope they bring you significant assistance
