Gold: Breaks through 4200 to hit a new all-time high📈Gold has once again refreshed its all-time high, supported by escalating concerns over U.S.-Asia trade and expectations that the Federal Reserve may cut interest rates twice more within the year.
📝The strong rally of gold this time is mainly driven by two key factors:
First, global trade worries have intensified. U.S. President Trump stated on Tuesday that he might suspend edible oil trade with Asian countries—a move that triggered a sharp surge in market safe-haven demand. In response, Asian countries have warned of retaliatory measures, further worsening trade tensions.
Second, expectations for Fed rate cuts have heated up. Federal Reserve Chair Jerome Powell hinted at another 0.25-percentage-point interest rate cut this month, and the market generally expects two rate cuts to be implemented within the year. The low-yield environment has significantly reduced the opportunity cost of holding non-interest-bearing assets, providing sustained support to the precious metals market.
In today’s early session, gold bulls stabilized in the 4140 zone and gained momentum again. As of now, gold has broken through the $4,200 mark to reach a new all-time high. For gold’s current trend, we remain bullish, with upside targets at 4,300 and 4,500. Do not attempt to predict the top until there are clear signs of a peak. Undoubtedly, the primary trading strategy remains "buying on dips." Key support levels to watch include today’s intraday low and the short-term uptrend support that has been in place since 4,090. If this support holds, the bullish momentum will remain strong and gold will continue to hit new highs. Key resistance zones to focus on above are 4,210–4,215, followed by 4,245–4,240.
Nevertheless, investors must closely monitor changes in geopolitical situations and signals from the Federal Reserve, adjust strategies flexibly, and strictly control risks.
💎Buy 4160 - 4165
TP 4180 - 4190 - 4200
SL 4150
Daily-updated accurate signals are at your disposal. If you run into any problems while trading, these signals serve as a reliable reference—don’t hesitate to use them! I truly hope they bring you significant assistance
Xauusdsignal

ElDoradoFx PREMIUM – (16/10/2025, LONDON SESSION)Professional Technical & Fundamental Breakdown by ElDoradoFx
Gold is currently trading around 4,223, rebounding from the Asian low 4,203 after a liquidity sweep. The metal remains within its ascending structure but is showing signs of exhaustion below 4,242, which remains the daily high and the main resistance barrier.
⸻
🔍 Technical Outlook
Daily (D1):
• Strong bullish trend remains intact; candles consistently printing higher lows.
• RSI at 84.9, heavily overbought, signaling limited upside without a correction.
• MACD still bullish but starting to flatten — watch for potential divergence.
1H (H1):
• Price retested the ascending channel support and bounced from the 50EMA + 100EMA confluence (4,203–4,213).
• Currently approaching minor resistance 4,228–4,235 — rejection here could trigger another pullback.
• RSI neutral at 58–60, showing potential equilibrium before breakout or rejection.
• MACD histogram turning positive again, confirming short-term buyer momentum.
15M–5M:
• Clear BOS and sweep of liquidity below 4,203, followed by strong bullish engulfing — intraday bullish bias.
• 5M chart shows early momentum loss near 4,228, caution for fake breakouts.
• Volume recovering after Asian quiet period; London likely to set the directional tone.
⸻
📊 Fibonacci Golden Zone (Latest Swing)
Swing Low → 4,203
Swing High → 4,242
🎯 Golden Zone = 4,213–4,219
This area aligns with moving average support and mid-channel retest — high-probability reentry point for continuation buys.
⸻
📌 High Probability Entry Zones
✅ BUY SETUP (Main Bias)
Entry Zone: 4,213–4,219 (Golden Zone)
🎯 TP1 → 4,235 TP2 → 4,242 TP3 → 4,255
🛑 SL below 4,203
⚠️ SELL SETUP (Countertrend)
Sell only below 4,203 (Break & Retest)
🎯 TP1 → 4,185 TP2 → 4,176 TP3 → 4,165
🛑 SL above 4,213
🚀 BREAKOUT BUY (Aggressive Setup)
Buy above 4,242 (Clean Breakout)
🎯 TP1 → 4,255 TP2 → 4,268 TP3 → 4,280
🛑 SL below 4,225
⸻
📅 Fundamental & Macro Overview
🕐 London session begins with cautious optimism as traders await U.S. data.
💵 DXY stabilizing near 105.10, slightly weaker, supporting gold’s rebound.
📈 U.S. yields remain capped, keeping the medium-term bullish structure intact.
⚙️ No high-impact news in early London hours — expect technical-led volatility.
⸻
⚠️ Key Levels to Monitor
Resistance → 4,228 / 4,235 / 4,242 / 4,255
Support → 4,219 / 4,213 / 4,203 / 4,185
⸻
✅ Summary
Gold is holding its bullish structure with strong recovery momentum from 4,203.
As long as 4,213–4,219 holds, bias remains bullish toward 4,235–4,242.
A confirmed break below 4,203 would shift bias short-term bearish toward 4,185–4,165.

XAUUSD – Safe-Haven Flows Continue to Support GoldMarket Context:
Gold has attracted strong buying for the fourth consecutive session, supported by a mix of global risk factors: renewed US–China trade tensions, rising geopolitical uncertainty, and growing fears of a prolonged US government shutdown.
Meanwhile, dovish expectations from the Federal Reserve are keeping the USD under pressure — further enhancing the appeal of gold as a non-yielding safe-haven asset.
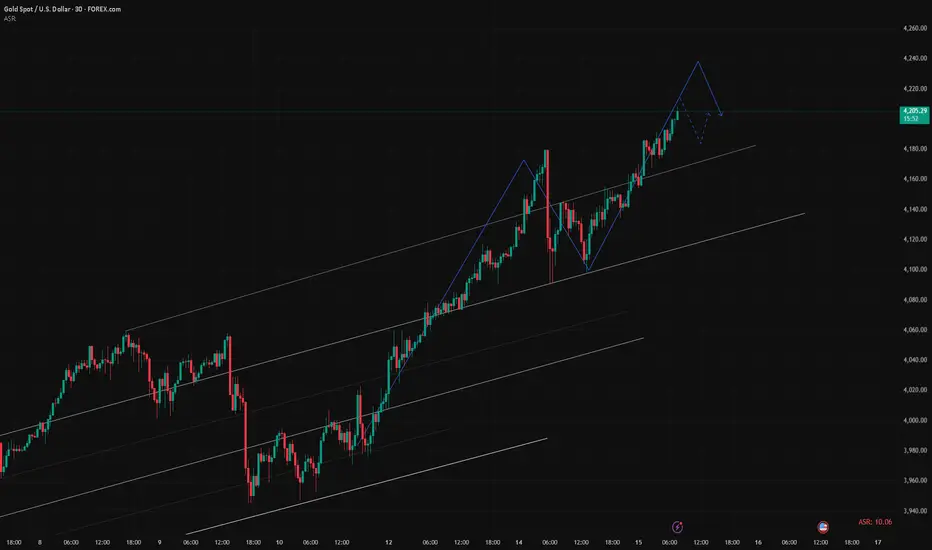
During the Asian session, XAU/USD printed a fresh all-time high, with bulls now eyeing a potential extension toward the 4,200 USD/oz region amid escalating global concerns.
Technical Outlook (M30):
Gold continues to respect its ascending channel structure, maintaining dynamic support between 4,167 – 4,154.
As long as price holds above 4,139, the broader trend remains bullish, with the next liquidity target sitting at 4,240 – 4,241.
Key Zones to Watch:
Liquidity Sell Zone: 4,240 – 4,242
ATH Zone / Short-Term Resistance: 4,190 – 4,200
OBS Buy Zone – CP Trendline Support: 4,141 – 4,139
Secondary Buy Zone: 4,114 – 4,112
Trading Plan:
🔹 BUY Zone
Entry: 4.141 – 4.139
SL: 4.134
TP: 4.145 → 4.150 → 4.155 → 4.160 → 4.170 → 4.180
🔹 BUY Zone
Entry: 4.114 – 4.112
SL: 4.106
TP: 4.120 → 4.125 → 4.130 → 4.140 → 4.150
🔹 SELL Zone (Scalp Reaction)
Entry: 4.240 – 4.242
SL: 4.248
TP: 4.235 → 4.230 → 4.225 → 4.220 → 4.210 → 4.200
Summary:
The bullish market structure remains intact as long as price holds above the 4,139 zone.
Watch for potential long opportunities from 4,141 – 4,139, where the confluence of trendline and order block support could trigger fresh demand.
Bulls remain in control, targeting the 4,240 – 4,241 liquidity area in the coming sessions.
📊 What’s your take — will gold break above 4,200 or pause for a correction first?
👉 Follow MMFLOW TRADING for daily market structure insights and institutional-style setups.
🟣 Chart: XAUUSD M30 – Smart Money Flow structure highlighting liquidity pools, CP confluence and key buy/sell zones.

16/10/68 : XAUUSD ( Europe / London Session )Using it from Europe Session until 7.00PM , I'll new analysis and update at 8.00PM
Resistance
4255-4260
4245-4250
4240
Support
4229
4218-4224
4207-4213

Is the bull market over? Here's the strategy.Information Summary:
Gold continued its upward trend in early Asian trading Thursday, reaching a new all-time high near $4,226. This was primarily due to growing bets on a Fed rate cut and geopolitical concerns, which led investors to flock to the safe haven of gold.
In addition, Fed Chairman Powell's dovish stance and the Beige Book, which revealed concerns about stagflation, boosted demand for safe assets. So far this year, gold prices have risen by over 60% due to geopolitical uncertainty, expectations of a Fed rate cut, central bank purchases, and strong inflows into ETFs.
Market Analysis:
Gold maintained its bullish trend, reaching a new all-time high on Wednesday, breaking through the 4,200 mark. The daily chart shows continued bullish momentum with strong volume. The 10-day moving average (MA) and 7-day moving average (MA) continue to form a golden cross, with the 5-day moving average moving upwards towards 4,140. The RSI indicator remains in the overbought zone, above 80.
Bollinger Bands on the 4-hour and 1-hour charts are opening upwards, indicating that the price is trading within the upper mid-range range. The current gold bull market isn't over yet. Each sharp drop is merely a correction. Until the bullish trend ends, the top pattern remains undetermined, so avoid blindly guessing the top.
It's important to note that recent trends have all been new highs in the Asian session, declines in the European session, and sideways fluctuations in the US session. The trading strategy remains to buy on dips.
Key Points:
First Support Level: 4190, Second Support Level: 4175, Third Support Level: 4160
First Resistance Level: 4235, Second Resistance Level: 4240, Third Resistance Level: 4250

Gold — High Consolidation, Beware of a Sharp DropGood morning!
Yesterday, gold fell back near 4220 and tested the support near 3176 several times during the session. During the US trading session, the support moved up to the 4202-4196/80 area. As of now, this support is still maintained and the price has returned to above 4200.
On the smaller charts, some indicators still favor bullish sentiment, but divergence has emerged on the 2H/4H charts, suggesting that the market may need to consolidate before a new round of gains can begin. Therefore, caution is crucial during trading.
Therefore, in future trading, it is more advisable to sell at high levels. Trend-setting bulls should wait until consolidation is complete before entering the market.
Important Support:
30M: Near 4185. Focus on the 4180-4176 area.
1H: Near 4157.
4H: Near 4137, followed by the 4107-4088 area.
In the current environment, we cannot guess the top, but based on the technical pattern, if the price is higher than 4230, we should be cautious in chasing the rise. It is recommended to look for selling opportunities. In the current market, it is better not to trade than to blindly follow the trend. Once there is no news support, from the technical pattern alone, adjustments may occur at any time, and the amplitude is expected to be large, so everyone should be prepared to deal with it.

ElDoradoFx PREMIUM 2.0 – (16/10/2025, ASIA SESSION UPDATE)Gold closed the U.S. session around 4,208, consolidating below the psychological resistance at 4,218, where repeated rejections confirm a short-term supply zone. While the broader trend remains bullish, intraday charts show early exhaustion and divergence — suggesting Asia may start with a controlled pullback before the next impulse.
⸻
🔍 Technical Outlook
Daily (D1):
• Strong bullish continuation structure remains intact.
• RSI still in overbought territory (84), signaling potential pause or minor retracement.
• MACD positive but showing the first signs of flattening momentum.
1H (H1):
• Price remains within the ascending channel; multiple failed attempts to break 4,218 resistance.
• Immediate support around 4,197–4,192 (previous NY demand area).
• A clean break below 4,192 could open room toward 4,180–4,165.
• RSI (63) cooling down; MACD histogram decreasing, confirming loss of buying pressure.
15M–5M:
• Short-term CHoCH detected below 4,210; liquidity sweeps at the top suggest potential correction.
• 20EMA and 50EMA starting to converge — watch for momentum shift if 20EMA crosses below.
• MACD histogram fading with bearish crossover forming.
⸻
📊 Fibonacci Golden Zone (Latest Swing)
Swing Low → 4,165
Swing High → 4,218
🎯 Golden Zone = 4,176–4,184
This area aligns with 1H EMA confluence and the mid-channel structure — a potential “buy-the-dip” zone for continuation setups.
⸻
📌 High Probability Entry Zones
✅ Bullish Re-entry (Primary Setup)
Buy between 4,176–4,184 (Golden Zone)
🎯 Targets → 4,206 → 4,218 → 4,230
🛑 SL below 4,165
⚠️ Bearish Setup (Short-Term Correction)
Sell below 4,192 (Break & Retest confirmation)
🎯 Targets → 4,180 → 4,165 → 4,150
🛑 SL above 4,206
🚀 Breakout Buy (Aggressive)
Buy above 4,218 (Clean breakout)
🎯 Targets → 4,230 → 4,245 → 4,260
🛑 SL below 4,200
⸻
📅 Fundamental & Macro Outlook
🕐 Asia expected to open with reduced liquidity after CPI-driven volatility.
🕐 DXY stable around 105.25, keeping gold supported but capped near resistance.
🕐 Watch for Chinese market sentiment — stronger yuan could support temporary dips.
🕐 U.S. yields remain firm; this limits upside acceleration for gold short-term.
⸻
⚠️ Key Levels to Monitor
• Resistance: 4,206 / 4,218 / 4,230
• Support: 4,192 / 4,184 / 4,176 / 4,165
⸻
✅ Summary
Gold continues in a controlled bullish structure, but momentum is fading at the top.
Expect Asia session to test 4,184–4,176 (Golden Zone) before a potential rebound.
If price holds above 4,176, upside continuation toward 4,218–4,230 remains likely.
A confirmed close below 4,165 would shift the short-term bias to bearish correction.
--------
🥇 ElDoradoFx PREMIUM 2.0 – PERFORMANCE 15/10/2025 🥇
📊 GOLD TRADE RESULTS:
🔻 SELL LIMIT +40 pips
🟢 BUY (Swing) +420 pips (from 13/10)
🟢 BUY +60 pips
🔻 SELL –40 pips
🟢 BUY +60 pips
🟢 BUY +50 pips
🟢 BUY +320 pips
🔻 SELL +20 pips
🔻 SELL +110 pips
---
💰 TOTAL GOLD PIPS WON: +1,040 pips
📈 RESULT: 9 Signals → 8 Wins | 1 Loss
🎯 ACCURACY: 89 %
---
🔥 Consistent profits and flawless swing setups across GOLD!
👏 Congratulations if you profited ✅✅✅🚀🚀🚀

XAUUSD: The bullish structure remains intact📈Gold has strengthened further after staging a deep V-shaped rebound yesterday. It broke through the historic 4,200 level during the day, hitting a high near 4,218.
📝Whether looking at the 4-hour chart or the daily chart, the bullish trend remains solid. As such, long positions should remain the core trading strategy.
💡Today, we also took short-term short positions, but exited promptly once the market pulled back. Therefore, short positions can only be traded on an opportunistic basis with quick entries and exits. Long positions should still be the primary approach. Do not attempt to "call the top". there is no clear peak in sight. Today’s high will only be tomorrow’s low.
💎Buy 4160 - 4165
TP 4180 - 4190 - 4200
SL 4150
Daily-updated accurate signals are at your disposal. If you run into any problems while trading, these signals serve as a reliable reference—don’t hesitate to use them! I truly hope they bring you significant assistance

Prices remain high. The bullish trend remains intact.The overall market remains bullish, and pullbacks present opportunities for buying. Gold, as expected, broke through the 4200 level today before quickly falling and rebounding.
From a technical perspective, gold has risen strongly and quickly corrected its price after setting a new high, but it still received support from buyers at low levels, and the price rebounded quickly after hitting a low of 4164.
The 1-hour chart shows that it is in a flag-shaped consolidation pattern, and the support level is moving steadily upward. Key support has now risen to $4180. As long as gold prices hold above this level, the uptrend remains intact. The moving average system continues to form a golden cross and diverge in an upward bullish arrangement. The bullish momentum of gold still exists and continues to maintain a strong pattern.
The 4-hour chart has effectively broken through the previous range of resistance, with the next key target near $4230. Quaid recommends placing long positions above 4180, with targets potentially moving towards 4230-4250.

Gold surged and then retreated. Latest Analysis.On Wednesday, gold continued its recent record-breaking run, finding buying support for the fourth consecutive trading day. Against a backdrop of favorable fundamentals, gold prices hit a new all-time high of $4,218.19.
Persistent geopolitical tensions, escalating trade frictions, and market concerns about a prolonged US government shutdown have all contributed to the key factors supporting this surge in safe-haven assets. It is important to note that despite technical indicators indicating overbought conditions, gold bullish momentum has not weakened, suggesting that the path of least resistance remains upward and the recently established upward trend is likely to continue.
In early Asian trading, gold bulls stabilized in the 4,140 area and re-energized, breaking through the record high of $4,200. Until there is a clear signal of a peak, do not blindly guess the top location. In the short term, a buy-on-low approach is recommended, with key support focused on the intraday low and the short-term uptrend support from 4,090.
The first resistance level to watch is around 4210-4215, followed by 4240. Support is expected to be around 4180-4160. For gold, a short-term strategy is to buy on pullbacks.
Trading strategy:
Buy gold in batches on pullbacks between 4180-4160, with a stop-loss of $10. Profits are expected to be above 4200.

How far does gold grow?Hello friends
Well, you see that after almost 4 years of suffering, gold has broken its suffering and has had a good rise.
Now, the support areas have been identified, which I obtained with Fibonacci. You can see the resistances of gold, which are currently at important resistance, but in this strong upward trend, it is not logical and principled to think about selling, and we should try to enter the price pullbacks.
Numbers that can be good support in order.
3800
3500
3300
.
Now what do we do if the resistance breaks?
Well, the same resistance becomes our support and we can use it.
Given the great growth that the price has had, it is expected that we will have a correction or that the price will rest.
*Trade safely with us*

Gold Hits 4200 — A Key Turning Zone for the Next MoveGood afternoon, everyone!
After completing the 4067 resistance-to-support transition, gold continued its upward momentum and is now approaching the 4200 level — a new local high and a critical psychological resistance zone.
While some profit-taking pressure is expected near this level, the overall bullish structure remains intact, meaning any pullback could present buying opportunities for traders who missed earlier entries.
If the price retreats from around 4200, watch for support near 4176–4167.
If gold extends higher and stabilizes above 4210, focus on 4193–4187 as the next support area.
The main intraday support sits near 4176, and the primary trading bias remains buying on dips.
⚠️ Note: Upon the first rise above 4220, short-term profit-taking pressure may appear. Avoid chasing the price blindly and stay disciplined.
If the price climbs toward 4250, expect heavier selling pressure and heightened volatility — trade cautiously.
Today's Strategy:
✅ Buy near 4176 (buy the dip)
⚠️ Sell near 4220 (short near resistance)
For conservative traders, focus on buying on pullbacks; for aggressive traders, use scalp entries and manage risk tightly.
Gold Tarde Set Up Oct 15 2025Im still bullish on gold but i want to see a test of 15m supply to then see SSL/London lows swept followed by a 15m Bullish candle close to then target previous swing high and ATH

15/10/68 : XAUUSD ( US Session )Using it from US Session until 11.00AM , I'll new analysis and update at 12.00PM
Resistance
4220-4225
4210-4215
4204
Support
4192
4182-4187
4170-4176

ElDoradoFx PREMIUM 2.0 – (15/10/2025, US SESSION UPDATE)📅 U.S. Session – 15 Oct 2025
💹 Prepared by ElDoradoFx Premium 2.0 Team
⸻
🧭 Market Overview
Gold is currently trading near 4,198, after failing to sustain the breakout above 4,206–4,218. The price is showing temporary weakness as intraday structure shifts toward a corrective phase within the bullish channel.
A deeper retracement may develop before new buyers step in, especially ahead of U.S. CPI reaction and liquidity sweeps.
⸻
🔍 Technical Outlook
D1 (Macro Trend)
• The daily candle remains bullish, but nearing exhaustion at channel resistance (4,218).
• RSI ≈ 84 → deep in overbought territory.
• MACD still strong but showing divergence — hinting possible short-term correction.
➡️ Macro bias: Bullish but stretched; expect retracement before continuation.
⸻
H1 (Intraday Structure)
• The structure remains within the rising channel, but momentum is slowing.
• 20EMA and 50EMA are flattening — suggesting short-term equilibrium.
• Current support: 4,187–4,182 zone, resistance: 4,206–4,218.
• A confirmed break below 4,182 opens space for a deeper pullback to 4,165–4,150.
➡️ Bias: Neutral-bullish → correction likely before next impulse.
⸻
15M–5M (Execution Zone)
• A CHoCH (change of character) formed around 4,206, confirming short-term bearish pressure.
• MACD shows fading momentum, RSI near 50 (neutral).
• Lower timeframe liquidity likely to target 4,180–4,175 before reaccumulation.
⸻
📊 Fibonacci Golden Zone
• Swing Low → 4,165
• Swing High → 4,206
🎯 Golden Zone = 4,174 – 4,179
This aligns perfectly with 1H demand zone and 200EMA — high-probability area for bullish re-entry.
⸻
🎯 High Probability Trade Scenarios
✅ Bullish Re-entry (Main Setup)
• Entry: 4,174–4,179 (Golden Zone)
• Targets: 4,193 → 4,206 → 4,218
• Stop-loss: Below 4,165
📗 Ideal low-risk entry after corrective pullback.
⸻
⚠️ Bearish Short-Term Setup (Countertrend)
• Entry: On confirmed break and close below 4,165
• Targets: 4,150 → 4,139 → 4,122
• Stop-loss: Above 4,182
📕 Short-term sell only if the structure fully breaks.
⸻
📈 Breakout Buy Setup
• Entry: Break and close above 4,218
• Targets: 4,230 → 4,245 → 4,265
• Stop-loss: Below 4,200
📗 Strong continuation confirmation toward new highs.
⸻
📅 Fundamental Watch
🕐 Key Event: U.S. CPI release later today — high volatility expected.
🕐 DXY holding around 105.25, showing indecision.
🕐 Pre-news consolidation expected, with breakout likely post-data release.
⸻
⚠️ Key Levels to Monitor
• Resistance: 4,206 / 4,218 / 4,230
• Support: 4,182 / 4,174 / 4,165 / 4,150
• Breakout Zones:
🔼 Buy above 4,218
🔽 Sell below 4,165
⸻
✅ Summary
Gold remains bullish overall, but a short-term retracement is unfolding as price loses steam near 4,206–4,218 resistance.
Look for a dip into 4,174–4,179 (Golden Zone) for new buying opportunities,
or a confirmed break below 4,165 for intraday correction.
Patience and precision are key ahead of the U.S. CPI volatility window.
⸻
— ElDoradoFx PREMIUM 2.0 Team 🚀

Setting new highs, it is right to go long on the pullbackI reminded everyone yesterday that once the W-shaped formation is confirmed and structural support is provided for the bulls, the upward trend will continue. The final result is in line with our expectations again. Gold is still fluctuating upward. If this trend continues, it is expected to reach 4210-4230.
As the price of gold continues to rise and returns to a unilateral upward trend, the short-term highs and support are also moving up. From the perspective of the big cycle trend, the current daily MA5 moving average and the 4H middle track have also come to around 4088-4090, which is also the position that short-term bulls need to focus on defending. Before failing to effectively fall below this position, we can still maintain the bullish trend unchanged, and any decline can be regarded as an opportunity for bulls to enter the market.
Judging from the hourly chart, the current gold price has reached the 42,000 integer mark. The continuous upward fluctuation has caused the current technical indicators to enter the overbought risk zone. Do not blindly chase the rise in the short term and be alert to the market's potential correction demand. The short-term support can be seen at 4180-4165. If gold subsequently falls back to this short-term support, we can consider continuing to go long on gold.
OANDA:XAUUSD
GOLD Will Keep Growing!
HI,Traders !
#GOLD is trading in an
Uptrend and the price
Made a bullish breakout
Of the key horizontal
Level of 4143.76$ and the
Breakout is confirmed so
We are bullish biased
And we will be expecting
A further bullish continuation !
Comment and subscribe to help us grow !

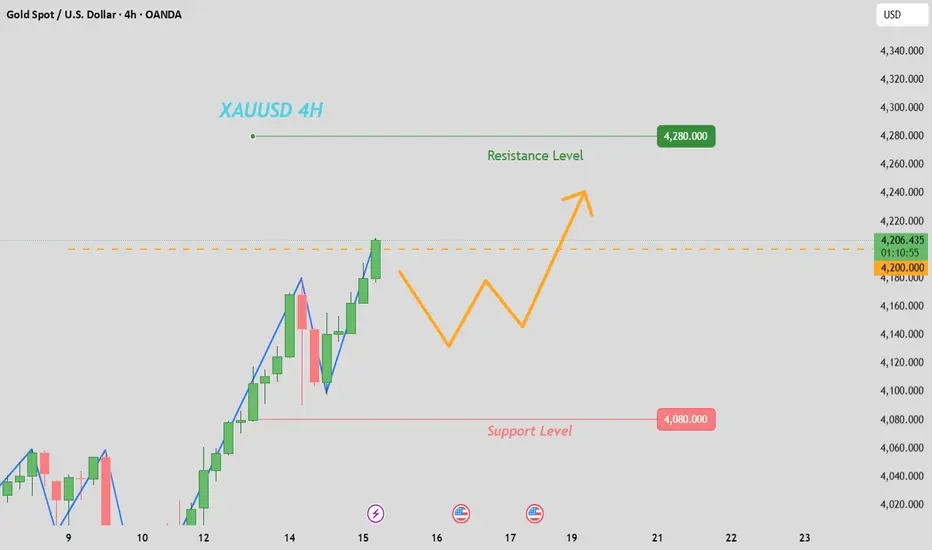
XAUUSD: Testing the solidity of 4200 levelAs we predicted in our analysis yesterday, gold is currently approaching the critical 4200 level, focusing on testing the solidity of the resistance at this level. Once the price stabilizes above the 4200 mark, it is expected to accelerate upward and launch an assault on the 4280-4300 area.
Is Gold XAUUSD due for a Retrace? VWAP & Volume Profile Plan🏆 Gold (XAUUSD) Market Update 🏆
Gold (XAUUSD) has rallied strongly and is now pushing into new highs 📈. In my view, price looks overextended — when applying the VWAP indicator, we can clearly see that price has stretched three deviations away from VWAP ⚖️.
I’m also analyzing the Volume Profile to identify value areas that could serve as key support zones on any retracement 🔍. While my overall bias remains bullish, I’d like to see price return to equilibrium — roughly the 50% retrace of the recent price swing (on the 4-hour timeframe, measured from the order block low) 📊.
Additionally, I’m observing a potential Three-Drive Pattern forming, which could hint at a short-term correction before any continuation higher 🔄.
⚠️ Disclaimer: This content is for educational purposes only and not financial advice.

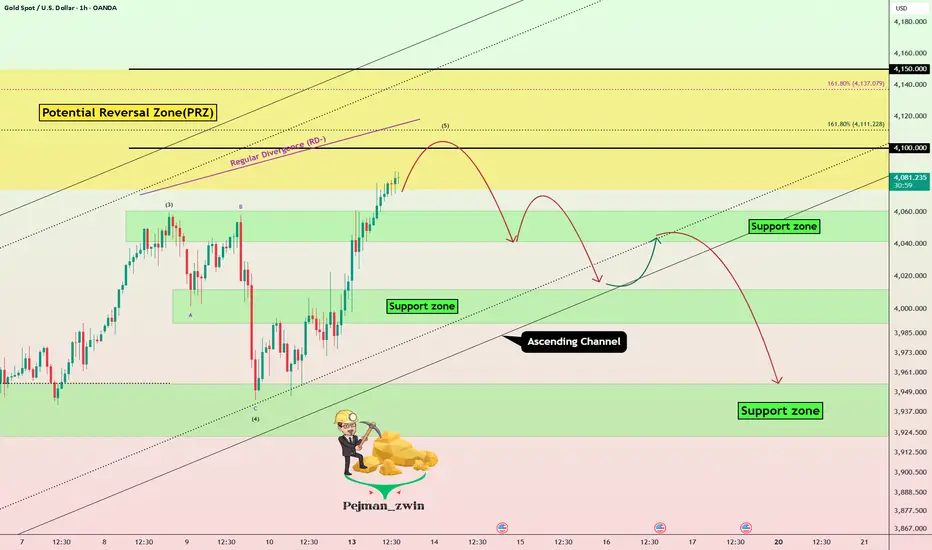
Gold Near $4,100 PRZ – Time for a Reversal?Just like we discussed last week, Gold ( OANDA:XAUUSD ) moved exactly as expected and hit its targets .
Now, as we start the new week, Gold is continuing to form a New All-Time High(ATH) and is currently near a Potential Reversal Zone(PRZ) and the $4,100 round number .
From an Elliott Wave perspective , it looks like Gold is completing wave 5, which could top out in this PRZ.
We’re also seeing a Regular Divergence(RD-) between the two consecutive peaks , which suggests that Gold might start a correction soon.
I expect Gold to begin a correction and at least drop down to the lower line of the ascending channel after breaking the Support zone($4,061 – $4,041) .
Note: If Gold breaks the lower line of that ascending channel, we can expect further downside.
Note: Also, keep in mind that Powell speaks tomorrow, which could influence Gold’s movement. As I mentioned, a bullish DXY outlook could also help push Gold lower.
Second Target: $3,963
Stop Loss(SL): $4,153(Worst)
Please respect each other's ideas and express them politely if you agree or disagree.
Gold Analyze (XAUUSD), 1-hour time frame.
Be sure to follow the updated ideas.
Do not forget to put a Stop loss for your positions (For every position you want to open).
Please follow your strategy; this is just my idea, and I will gladly see your ideas in this post.
Please do not forget the ✅ ' like ' ✅ button 🙏😊 & Share it with your friends; thanks, and Trade safe.
GOLD: Pullback risk needs to be guarded against📈At the opening of trading today, gold’s performance aligns perfectly with our judgment yesterday. After breaking through 4100 the previous day, gold has continued its upward trend today. within just one trading day, it has surged toward the extended target range of 4170, peaking at around 4179 before encountering resistance near 4180 and pulling back. If the market breaks above the resistance zone of 4180-4183, attention should then shift to the key 4200 level above. Once gold firmly holds above 4200, it cannot be ruled out that it will accelerate its advance toward the 4280-4300 area.
📝However, we can see that today’s price is close to the upper edge of the upward channel—a zone that usually faces significant resistance. Today’s price action of surging higher and then pulling back also reflects, to a certain extent, the suppressing effect of the upper edge of the upward channel on the price, with short-term upward momentum weakening somewhat.
💡In the short term, due to overbought conditions on the technical side and pressure from profit-taking, London Gold may undergo a certain degree of correction. Nevertheless, the medium-to-long-term upward trend remains intact. Investors need to pay close attention to the speeches by Federal Reserve Governor Bowman and Fed Chair Powell tonight; their remarks could alter market expectations for interest rate cuts, which in turn may trigger sharp short-term fluctuations in gold prices.
💎Buy 4120 - 4125
TP 4150 - 4160 - 4170
SL 4100
Daily-updated accurate signals are at your disposal. If you run into any problems while trading, these signals serve as a reliable reference—don’t hesitate to use them! I truly hope they bring you significant assistance

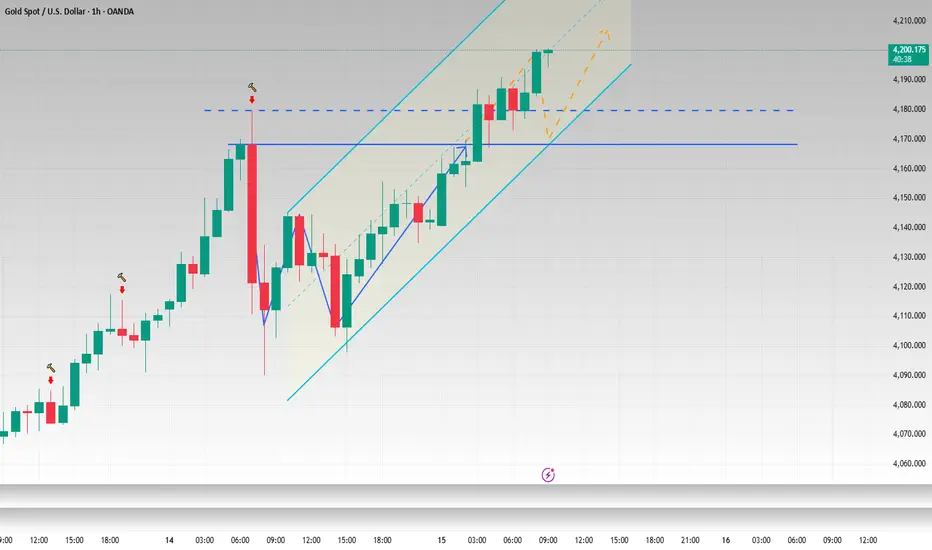
ElDoradoFx PREMIUM 2.0 – (15/10/2025, LONDON SESSION)📅 London Session – 15 Oct 2025
💹 Prepared by ElDoradoFx Premium 2.0 Team
⸻
🧭 Market Overview
Gold remains firm around 4,190, holding within a tight ascending channel after a strong recovery from 4,150.
The overall trend remains bullish, with price action building structure for a potential continuation breakout above 4,193.
However, RSI and MACD indicate slight exhaustion — suggesting a possible minor pullback before continuation.
⸻
🔍 Technical Outlook
D1 (Macro Trend)
• The daily candle continues the bullish sequence — higher highs and higher lows.
• RSI ≈ 83 → still overbought but stable.
• MACD remains strongly positive with momentum plateauing.
• Daily support sits around 4,147–4,100.
➡️ Bias: Strong bullish trend, minor correction possible before further rally.
⸻
H1 (Intraday Structure)
• Gold trades above both 20EMA and 50EMA, maintaining trend structure.
• Clear BOS confirmed at 4,165, now consolidating near 4,190–4,193 (previous high zone).
• RSI near 60, showing balanced momentum; MACD flat but above zero.
• Channel top resistance → 4,193–4,200, channel base → 4,165–4,170.
➡️ Bias: Bullish bias remains intact while above 4,165.
⸻
15M–5M (Execution Zone)
• Micro BOS after minor CHoCH at 4,183 indicates strength.
• 5M structure aligned for potential breakout above 4,193.
• If price rejects 4,193, a retracement toward 4,170–4,165 expected (Golden Zone).
⸻
📊 Fibonacci Golden Zone
• Swing Low → 4,165
• Swing High → 4,193
📈 Golden Zone = 4,171 – 4,175
Ideal re-entry zone aligning with 50EMA & intraday trendline support.
⸻
🎯 High Probability Trade Scenarios
✅ Bullish Continuation Setup
• Breakout Price: Above 4,193 (confirmed close).
• Entry: Retest of 4,190–4,193.
• Targets: 4,205 → 4,218 → 4,235
• Stop-loss: Below 4,175.
📗 Trend continuation with strong structural and EMA alignment.
⸻
⚙️ Golden Zone Re-entry (Buy on Dip)
• Entry: 4,171–4,175 (Golden Zone).
• Targets: 4,190 → 4,200 → 4,218
• Stop-loss: Below 4,160.
📗 Low-risk setup with EMA confluence and Fibonacci support.
⸻
⚠️ Short-Term Sell (Correction Setup)
• Breakout Price: Below 4,165 (confirmed).
• Entry: Retest 4,165–4,170.
• Targets: 4,150 → 4,139 → 4,122
• Stop-loss: Above 4,175.
📕 Counter-trend trade if structure breaks — only valid with clear confirmation.
⸻
📅 Fundamental Watch
🕐 CPI data due today — high impact event likely to trigger volatility.
🕐 DXY trades near 105.20, providing temporary resistance to gold’s upside.
🕐 Expect pre-news consolidation, followed by expansion during U.S. session.
⸻
⚠️ Key Technical Levels
• Resistance: 4,193 / 4,200 / 4,218
• Support: 4,175 / 4,165 / 4,150 / 4,139
• Breakout Zones:
🔼 Buy above 4,193
🔽 Sell below 4,165
⸻
🧩 Summary
Gold remains bullish, consolidating near the upper boundary of the ascending channel.
A break above 4,193 could extend gains toward 4,218–4,235,
while a drop below 4,165 opens a short-term retracement to 4,139–4,122.
Expect controlled volatility ahead of CPI — manage risk carefully.
⸻

GOLD Intraday Chart Update for 15 Oct 25GOOD Morning Traders,
As long as GOLD sustains above 4080 FMP Level it will remains bullish however the only way to join Trend Rally is following Psychological Levels with 3080 chain
Major Support zone for the day is located @ 4130-4150 below this zone GOLD will move Towards 4100 or even 4080
Above 4150 Psychological Level GOLD Next Target will be 4230 FMP Level or even 4250
Disclaimer: Forex is Risky
