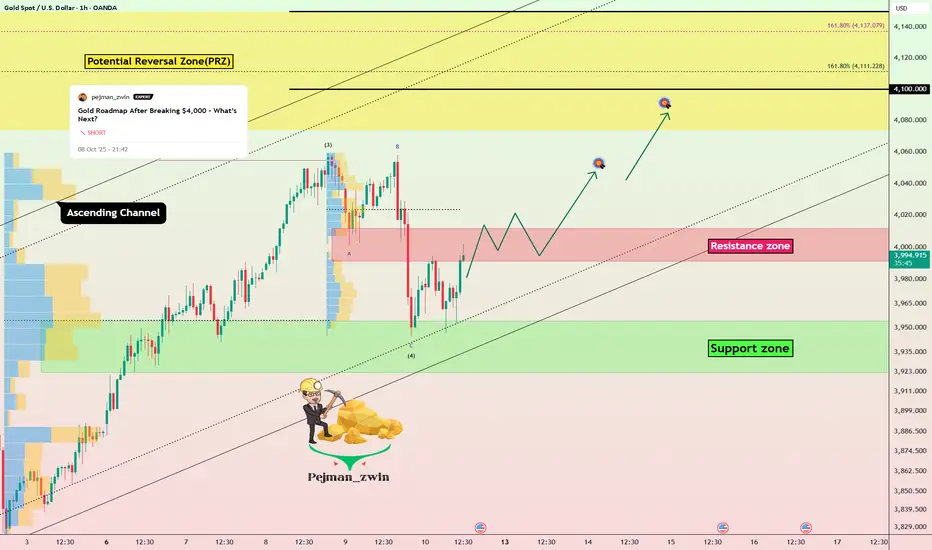
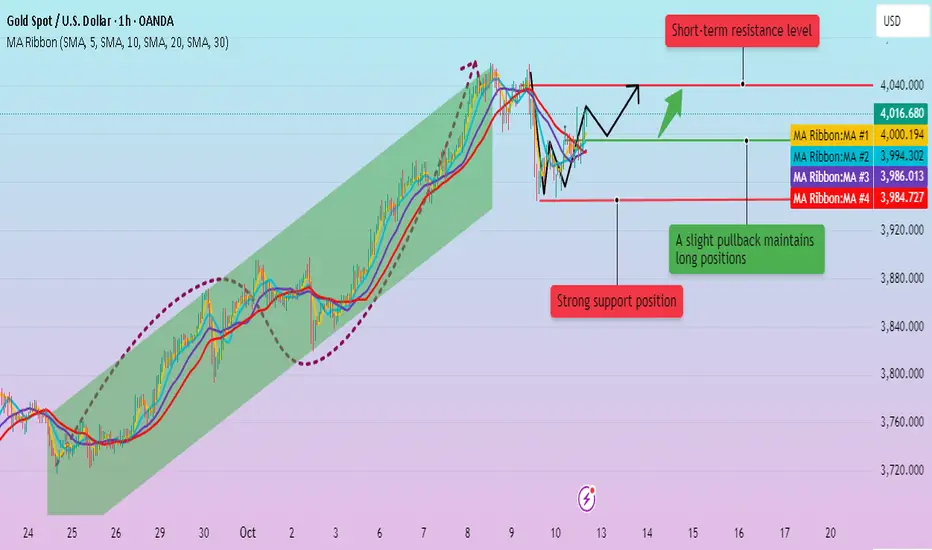
Gold Breakout Setup After Completing CorrectionGold ( OANDA:XAUUSD ) fell to $3,963 , as I expected in my previous idea .
Gold is currently moving near the lower line of the ascending and the Resistance zone($4,012 – $3,991) . If Gold touches $4,003 , we can expect a break of the Resistance zone($4,012 – $3,991) .
In terms of Elliott Wave theory , it seems that the Zigzag Correction(ABC/5-3-5) of Gold in the form of wave 4 has been completed, and we can expect a rise in Gold in the coming hours after the break of the Resistance zone($4,012 – $3,991) .
I expect Gold to break the Resistance zone($4,012 – $3,991) in the coming hours and rise to at least $4,047(First Target) .
Second Target: Potential Reversal Zone(PRZ)
Stop Loss(SL): $3,918(Worst)
Support zone: $3,954 – $3,923
-----------------------------
Today, we’ll be watching two reports :
Prelim UoM Consumer Sentiment and Prelim UoM Inflation Expectations.
If we see a significant deviation from expectations, it could trigger noticeable volatility in Gold .
-----------------------------
Please respect each other's ideas and express them politely if you agree or disagree.
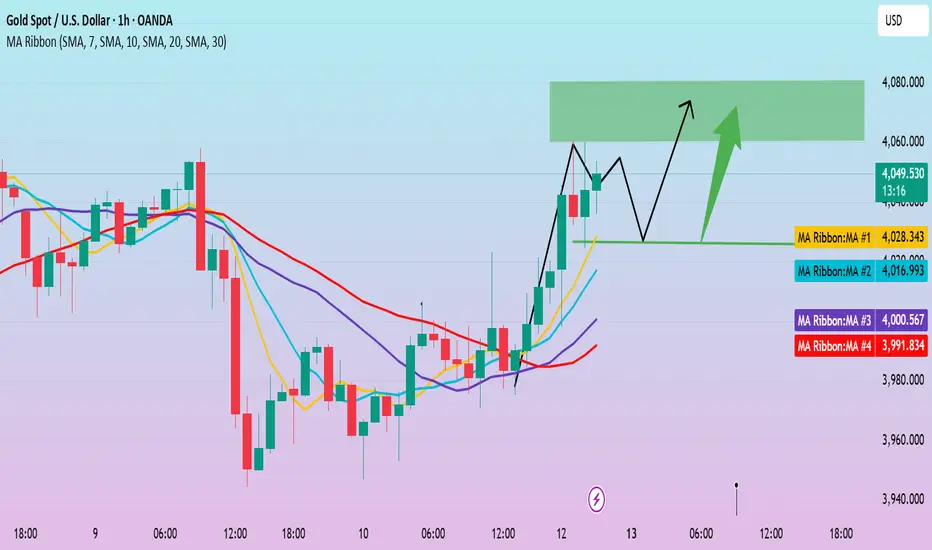
Gold Analyze (XAUUSD), 1-hour time frame.
Be sure to follow the updated ideas.
Do not forget to put a Stop loss for your positions (For every position you want to open).
Please follow your strategy; this is just my idea, and I will gladly see your ideas in this post.
Please do not forget the ✅ ' like ' ✅ button 🙏😊 & Share it with your friends; thanks, and Trade safe.
Xauusdsignal
XAUUSD – Safe-Haven Flows Continue to Support GoldMarket Context:
Gold remains firm as renewed US–China trade tensions and rising geopolitical risks drive safe-haven flows into XAUUSD.
Expectations of further rate cuts from the Federal Reserve continue to weaken the US Dollar, reinforcing bullish momentum for the metal.
Current Outlook:
As long as price action stays within the ascending channel, gold is likely to extend toward the 4,090–4,100 liquidity zone.
If a reaction occurs near 4,092–4,095, a short-term corrective move could follow.
Despite short-term overbought signals, the broader market structure still supports the bullish side.
Key Levels:
Liquidity Buy Zone 1: 4,039 – 4,037
Liquidity Buy Zone 2: 4,017 – 4,015
Liquidity Sell Zone: 4,092 – 4,095
Major Support: 4,010 – 4,000
Major Resistance: 4,110 – 4,126
Trading Plan:
🔹 BUY ZONE
Entry: 4,039 – 4,037
Stop Loss: 4,032
Take Profit: 4,044 → 4,048 → 4,052 → 4,056 → 4,060 → 4,070
🔹 BUY ZONE
Entry: 4,017 – 4,015
Stop Loss: 4,010
Take Profit: 4,022 → 4,026 → 4,030 → 4,040 → 4,050 → 4,060
🔹 SELL ZONE (Scalp Opportunity)
Entry: 4,092 – 4,095
Stop Loss: 4,100
Take Profit: 4,090 → 4,085 → 4,080 → 4,070 → 4,060
Summary:
The current structure remains bullish as long as the 4,015 – 4,020 zone holds firm.
Safe-haven demand and expectations of Fed easing continue to favour the upside.
Watch for potential liquidity sweep around 4,092 before any higher continuation.
📊 What’s your view — will gold break out or face rejection near 4,090?
👉 Follow MMFLOW TRADING for more structured daily plans and professional insights.

Gold continues to surge. Is it unstoppable?Last week, a single social media post by President Trump wiped out $2 trillion in US stock market value, with the S&P 500 index falling 2.7% that day, its worst performance since early April. The reality of this incident demonstrates that Trump's authoritarian trade policies continue to influence the fate of the global economy.
In early Asian trading on Monday, gold briefly hit $4,060, a new all-time high. With market concerns easing slightly, it is currently fluctuating around the 4,050 high.
Looking at the 4-hour chart, Quaid believes gold prices still have the potential to reach new highs. Current support is around 4,035, followed by 4,020.
If support at 4,035 is broken, gold could potentially reach the 4,080-4,090 high. This is because 4,035 is at the 0.618 Fibonacci support level, while 4,020 is at the 0.50 level.
However, the possibility of a deeper pullback to 4020 cannot be ruled out. As long as gold remains above 4020 in the short term, it remains strong.
For short-term operations, Quaid recommends that you can go long around 4035. If the price breaks through 4060, the target may reach 4080-4090.

Risk aversion is intensifying. Is the rally accelerating?In early Asian trading on Monday, gold continued to rise, rising 1% at one point to a record high of $4,060 per ounce. Due to the tense international trade situation, escalating geopolitical risks, expectations of a Federal Reserve rate cut, and political turmoil in many countries, the safe-haven demand for gold remained high. As a non-interest-bearing asset, gold has once again proven its status as the "king of safe havens" amidst uncertainty shrouding global markets.
Gold is currently maintaining its trend, with a strong bullish structure intact, and has seen eight consecutive weeks of gains on the weekly chart. From a technical perspective, the RSI indicators on the daily and weekly charts have both reached 80, indicating overbought conditions. However, the daily MA10/7-day moving averages continue to open upward and gradually move up. After several rounds of adjustments last week, the market finally closed above the 5-day moving average of 4,000.
Technically, gold remains primarily bullish on dips, but be wary of sharp pullbacks after overbought levels. Recent market volatility is significant, so strict risk management is essential when participating in the market, and opportunities for entry during pullbacks are crucial.
Trading Strategy:
Long around 4025, stop-loss at 4015, profit range 4060-4080;
Short around 4080-4085, stop-loss at 4095, profit range 4040-4020;
Gold |US–China Tensions Ease, Gold Eyes a New Breakout Above ATH🌍 Macro Overview: Cooling US–China Tensions
Geopolitical pressure between the US and China appears to be easing after China’s Ministry of Commerce clarified that export controls on rare earth materials do not mean an export ban — a clear attempt to reopen constructive dialogue with Washington.
Meanwhile, US Vice President JD Vance signaled a softer stance toward Beijing, stating:
“We highly value the friendship between President Trump and President Xi Jinping.”
“President Trump hopes the US won’t need to use leverage against China.”
“President Trump is ready for a fair and reasonable negotiation with Beijing.”
➡️ These remarks suggest a temporary de-escalation in geopolitical risks, improving overall risk sentiment and prompting investors to shift focus back to technical structures and liquidity zones on gold.
💎 Technical Outlook (XAU/USD H1)
After a sharp drop from its All-Time High (ATH), gold found strong support at the 3975–3985 Support Zone, coinciding with a Change of Character (ChoCh) reversal area.
Price has since established an ascending channel, moving back toward the upper liquidity zone (4020–4030) — a critical area where short-term profit-taking may occur before another leg higher.
⚙️ Key Technical Levels
Liquidity Zone $$$ (4020–4030): Short-term resistance; potential pullback zone.
Liquidity Zone $$$ (3990–4005): Key demand area where buy orders are likely stacked.
Breakout Support: 4008 — now acting as near-term structure support.
ATH Zone: 4045–4050 — key upside target; a confirmed breakout could open room toward 4100.
📈 Trade Scenarios
Primary Scenario (Buy on Dip):
Look for price to retest the 3995–4005 liquidity zone for long entries.
Target: 4025 → 4050.
Stop loss: below 3980.
Extended Bullish Scenario:
If price holds above 4050, the next expansion target lies at 4080–4100.
⚠️ Risk Notes
The US–China diplomatic tone remains fragile; sudden rhetoric shifts could trigger volatility.
Wait for a confirmed H1 close above 4025 to validate bullish continuation before scaling in.
🧭 Summary
The easing in US–China tensions has reduced safe-haven demand for gold in the short term, but technical momentum still favors the bulls.
As long as the 4000 psychological level holds firm, XAU/USD is well-positioned to retest and potentially break above the 4050 ATH zone, targeting 4100+ in the coming sessions.

Gold vs Dollar – Bullish Confirmation & Risk Management PlanXAU/USD "The Gold vs US Dollar" - Metal Market Cash Flow Management Strategy ⚡ (Swing/Day Trade)
📊 Trading Plan:
✅ Bias : Bullish confirmation spotted as Hull Moving Average shows an upside pullback trend.
✅ Entry Idea : Flexible entry with layering strategy (scaling in with multiple limit orders) :
$3650
$3660
$3670
$3680
( You can add more layers depending on your risk and strategy preference. )
🛡️ Risk Management:
Suggested Protective Stop Loss : around $3630 (after breakout levels).
⚠️ Note : Please adjust SL based on your personal strategy and risk tolerance — this is not a fixed recommendation.
🎯 Target Outlook:
Short-term resistance expected near $3740 (where moving averages converge + overbought conditions may trigger profit-taking traps).
Idea: secure profits before market reversals.
⚠️ Note : Target levels are flexible. You can adjust according to your own plan and market conditions.
🔑 Key Points:
Hull MA Pullback → signals bullish continuation.
Layered Entry → improves average price & manages volatility.
Exit Discipline → respect your risk plan, don't rely solely on posted SL/TP.
🔗 Related Pairs to Watch (Correlation & Flow):
🟢 OANDA:XAGUSD (Silver/USD) → Often moves in tandem with gold, can confirm metal market strength.
🟢 TVC:DXY (US Dollar Index) → Inverse correlation with gold; weak USD = stronger gold.
🟢 FX:EURUSD → Euro strength usually aligns with gold bullish momentum.
🟢 FX:USDJPY → Safe-haven flows: when JPY strengthens, gold tends to follow.
✨ “If you find value in my analysis, a 👍 and 🚀 boost is much appreciated - it helps me share more setups with the community!”
#XAUUSD #Gold #Forex #DayTrading #SwingTrading #HullMA #TradingStrategy #RiskManagement #Metals #FXAnalysis #DXY #TechnicalAnalysis

$4024 Gold: 8-Week Record. BUY Pivot $398x! Hello, traders!
Gold just wrapped up an impressive 8-week winning streak, closing the session at $4,024.40/oz (Futures). This rally was immediately triggered by President Donald Trump's unexpected threat of new tariffs on China, which fueled a rush toward safe-haven assets.
Fundamentals & Technical Bias: Buying the Pivot
Core Drivers: Escalating trade conflict (Trump), continued Fed rate cut expectations, and global political instability (US Shutdown, France risk) are solidifying gold's safe-haven status.
Technical Recovery: After a deep correction to $394x, gold recovered quickly and closed firmly above $399x. This confirms that buying pressure is dominant and the bullish momentum remains strong.
Priority Bias: BUY (Long). $398x is the critical short-term pivot point.
Risk Warning: Only switch to SELL (Short) if the price rapidly breaks below $398x due to negative news.
Key Price Levels:
Resistance: $4064, $4084, $4104, $4124
Support: $3984, $3951, $3934
Trading Strategy (Prioritize BUY at the Pivot)
BUY ZONE (Pivot $398x): $3984 - $3982
SL: $3974
TPs: $3992, $4002, $4012, $4022, $4032
SELL ZONE (Counter-Trend): $4024 - $4026
SL: $4034
TPs: $4016, $4006, $3996, $3986, $3976
Will the threat of a trade war push gold toward $4100 next week? 👇
#Gold #XAUUSD #4KGold #TrumpTariffs #8WeeksUp #Pivot #TradingView

Gold Performance Recap for the weekThe XAU witnessed a "surge, pullback and rebound" trend this week, recording the largest weekly volatility since 2025.
The movement can be divided into three phases:
1 Monday: A record-breaking sharp rally
2 Tuesday-Wednesday: High-level consolidation and a second rally
3 Thursday-Friday: Volatile swings driven by policy divergences
Looking ahead to next week, if the Federal Reserve's October interest rate decision delivers the anticipated 25-basis-point rate cut as scheduled, gold prices are expected to challenge the 4,080 resistance level; if signals of a "rate cut pause" are released, a deep correction may be triggered with the support level eyed at 3900.
We also need to monitor whether the historical high of 4,057 can be effectively broken and the strength of support around the weekly consolidation center at 3,989.
Gold: forecast 📈We predict that next week gold will oscillate upward in the range of 3,960 - 4,080, gradually rise relying on trendline support, and is expected to test the resistance at 4,050 during the week. If it breaks through with increased volume, it will target 4,100 resistance level.
💡However, at the same time, we need to closely monitor Fed policy and geopolitical risks as core variables, because macro events may become the key to breaking the balance.
GOLD Potential Short!
HI,Traders !
#GOLD is growing Nicely but will
Soon hit a horizontal resistance
Of 4049.41 so after the
Retest a local bearish
Pullback is to be expected !
Comment and subscribe to help us grow !

In-depth Market Analysis. Outlook for Next Week.The gold market experienced several pullbacks this week, but it rebounded during the US trading session, driven by risk aversion, ultimately closing at a relatively high level. Current geopolitical uncertainty continues to support gold prices, keeping the metal strong. On a weekly basis, gold has risen for eight consecutive weeks, maintaining an overall bullish trend. Weekly support is currently around 3944, with resistance primarily focused on the 4040 area, followed by this week's high near 4059.
On a daily basis, gold rebounded after a second dip on Friday, ultimately closing at the high, indicating strong buying support at lower levels. This provides a positive signal for the medium- to long-term market trend. At the same time, the daily chart shows that the closing price is above the 5-day moving average, and the short-term trend continues to be bullish based on the 5-day moving average.
The 4-hour Bollinger Bands are flattening, suggesting a period of high volatility in the short term. The candlestick chart has closed above the middle band, and the 5-day moving average is converging with the 10-day moving average and is about to diverge upwards. This indicates that gold is currently experiencing a volatile and strong trend, with the potential for further upward movement in the short term.
Based on a comprehensive analysis of technical patterns and fundamental factors, long-term dips remain the primary strategy unless a clear reversal signal emerges.
At the beginning of next week, the focus will be on whether prices can continue their upward momentum, but at the same time, we must be wary of the risk of a pullback if we fail to break through the upward resistance.
XAUUSD: Next - week forecastOver the past week, gold rebounded sharply after a sharp decline, formed a "double-bottom" pattern, and regained the 4,000 level, with clear short-term support.
We predict that next week gold will oscillate upward in the range of 3,960 - 4,080, gradually rise relying on trendline support, and is expected to test the resistance at 4,050 during the week. If it breaks through with increased volume, it will target 4,100 resistance level.
However, at the same time, we need to closely monitor Fed policy and geopolitical risks as core variables, because macro events may become the key to breaking the balance.

XAUUSD analysis – 1H FVG and OB SetupsThe overall structure remains bullish, with price creating higher highs and higher lows.
Currently, we are in a retracement phase, and the two highlighted demand zones at 3968 and 3927 represent potential areas for continuation entries.
Our plan:
Wait for confirmation signals on lower timeframes (3M–15M) — such as BOS + OB + FVG alignment — before entering long positions.
The first zone (3968) aligns with a short-term OB that could trigger early buy reactions, while the second zone (3927) is a deeper liquidity sweep area with higher probability if price decides to extend its correction.
As long as price stays above 3927, the bullish narrative remains valid.
We’ll reassess only if that level breaks cleanly with strong bearish displacement.
📊 ProfitaminFX | Gold, BTC & EUR/USD
📚 Daily setups & educational trades

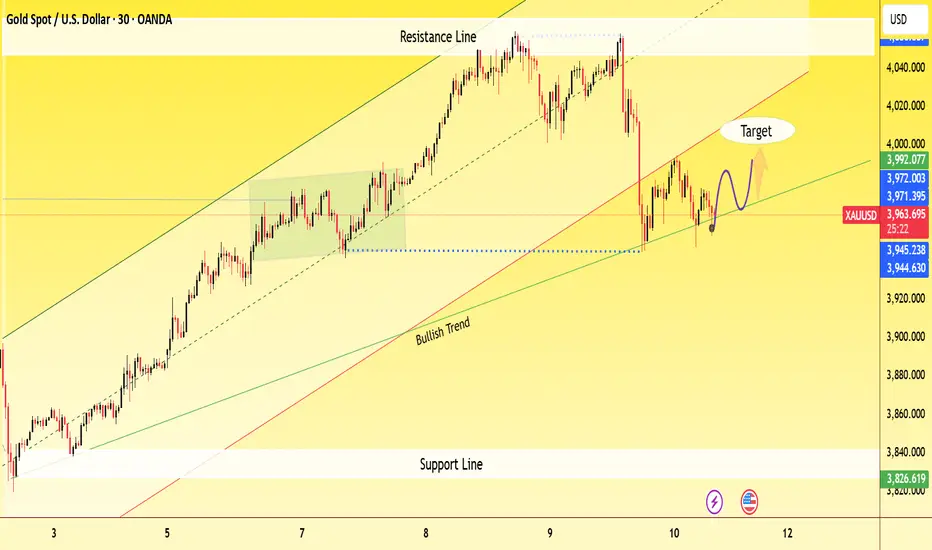
GOLD POISEDFOR BULLISH AS PRICE HOLDS ABOVE KEY TRENDLINE SUPPOR🧭 General Overview
Instrument: Gold Spot / USD (XAU/USD)
Timeframe: 30-minute
Current Price: 3,958.59
Trend: Overall bullish, but showing short-term correction
📊 Key Technical Elements on Chart
1. Bullish Trendline
The green upward trendline labeled “Bullish Trend” indicates that gold remains in a long-term uptrend.
Price is currently testing this bullish trendline — a crucial support area.
2. Resistance Zone
The resistance line near 3,992–4,000 marks the recent swing high where price was rejected.
Each approach to this zone triggered a pullback, indicating strong selling pressure ther
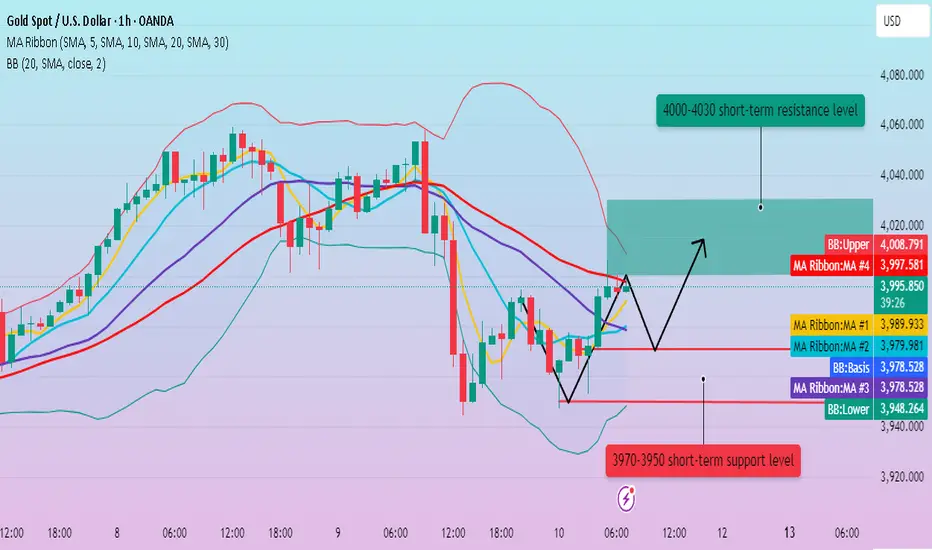
Gold is fluctuating slightly. Watch the market.Gold has been quite active recently, entering a pullback and correction mode. On the daily chart, it's almost forming a high-level engulfing pattern. Therefore, today's close is crucial. Whether it continues to decline, remains volatile, or rebounds strongly upwards will be crucial for future trends.
In the 4-hour level, the price temporarily maintains a narrow range of oscillation and repair, and the price is under pressure at 4010. The moving average trend at the 1-hour level tends to be flat, and there are signs of moving downward. The K-line begins to slowly break through the short-term moving average and maintains a weaker trend. There is potential for further downward correction in the late trading session, with continued strong support at 3950.
Gold Trading Strategy:
Go long on gold at 3970-3960, with a stop-loss at 3950 and a profit range of 4015-420.

Clash of Titans — Bulls vs Bears: Who Will Win This Round?Gold rebounded quickly after touching 3945 twice, and rebounded again after touching 3953. Three long lower shadows were shown in the candle chart. This area happens to be the 50% area of the previous rising wave. There are obvious signs of bottoming out in the short term. From the overall trend, although the short-term retracement of gold is not small, it has not fallen below the 3930 trend channel support, and has not even effectively fallen below 3950. Therefore, the overall gold trend is still bullish.
Judging from the current structure, if gold breaks through the key level of 4010-4030 during the rebound, gold will resume its strong bullish pattern and has the potential to test or even break through the recent highs again; if gold cannot recover the key level of 4010-4030 in the short term, gold may maintain a volatile pattern in the 4010-3950 area or the 4030-3970 area.
Therefore, in short-term trading:
1. If gold continues to rebound, we can first consider shorting gold in the 4010-4030 area; then patiently wait for gold to retrace.
2. If gold retreats first, we can first consider longing gold in the 3970-3950 area; then patiently wait for gold to rise.

Gold - Just buy the all time high!🔱Gold ( TVC:GOLD ) will rally even higher:
🔎Analysis summary:
Gold remains totally bullish. And after the recent all time high breakout rally of about +15%, traders are willing to accept much higher prices. Following the significant long term rising channel formation, Gold will rally another +25% before we will see a retracement.
📝Levels to watch:
$4.000, $4.500
SwingTraderPhil
SwingTrading.Simplified. | Investing.Simplified. | #LONGTERMVISION

Gold is unpredictable. Stay vigilant.Gold plummeted over $100 on Thursday, its largest single-day drop since May 12th of this year. This, in itself, will have a certain dampening effect on gold bulls. The decline is a technical correction. However, caution is advised: since gold has experienced a sharp drop, its short-term strength will not be as strong as at the beginning of the week. Therefore, there are two possible scenarios for gold's trend: a high-level oscillation within the bullish trend, or a volatile pullback before a rebound. For short-term trading, it is best to go long on dips and be bullish.
From a technical perspective, although the price has experienced multiple pullbacks, it is still trading above 3900. A trend change is possible only if it falls below 3900. The short-term Bollinger Bands on the 4-hour level are closing, and it may fluctuate at a high level for a while.
The current trend is consistent with my earlier prediction: a rebound followed a pullback to 3970. The price also briefly broke through 4020 before a brief pullback. If this rebound breaks through $4000 and remains above 4010, upward pressure will likely focus on around 4030.
Trading Strategy:
Buy in batches between 3960-3970, with a stop-loss at 3050. Profit range: 4010-4020.
Short around 4015, with a stop-loss at 4025. Profit range: 4000-3980-3970.

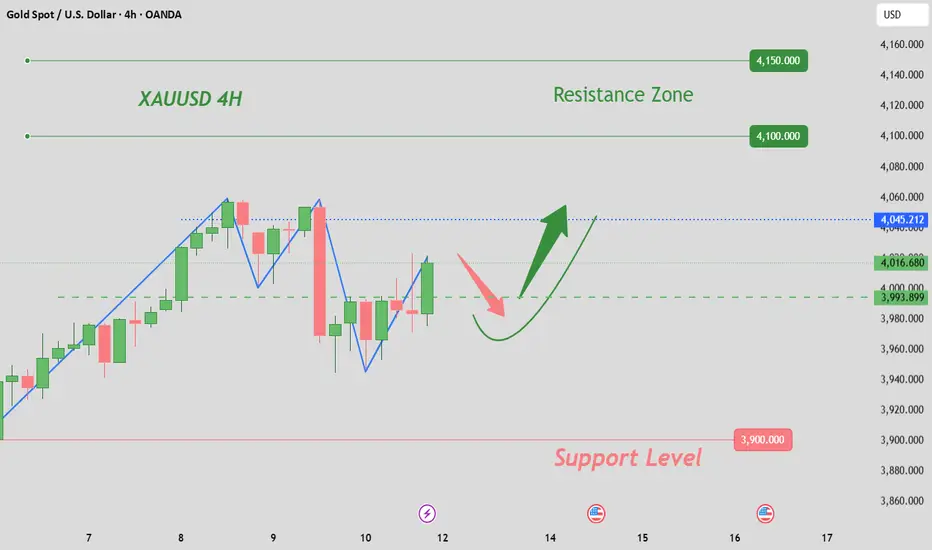
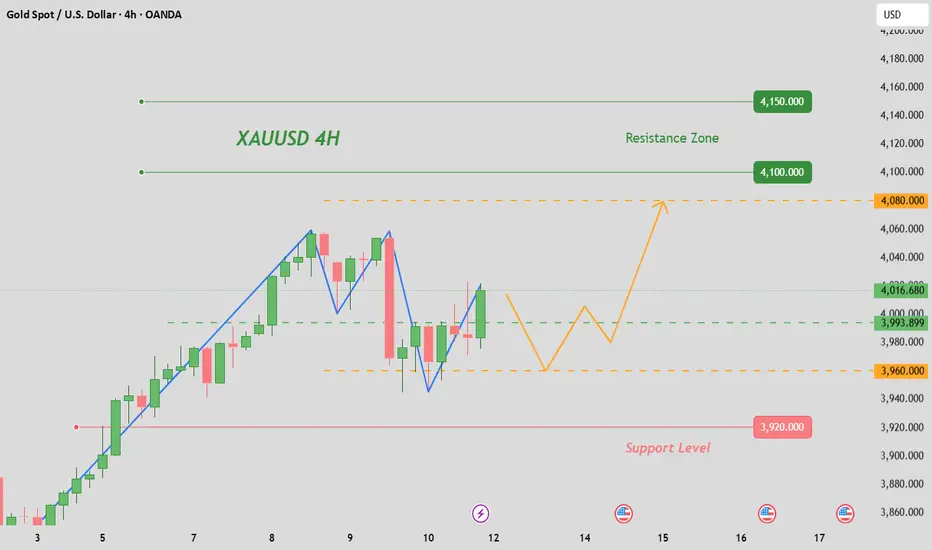
Gold Returns to 4000 — Watch the Next Key Level HereAfter yesterday’s pullback, part of the selling pressure accumulated during the recent rally has been released, allowing gold to regain stability above the 4000 level.
On the 2H chart, the immediate resistance lies around 4012. Although the price has temporarily broken through this level, it’s crucial to observe whether it can hold above 4012 after the pullback. If not, focus on the 4000–3990 support zone below.
Technically, the overall trend remains bullish, with resistance levels at 4024–4028/33, followed by the 4050 area.
For trading strategy, short-term traders can operate within the 3990–4028 range, buying near support and selling near resistance.
If the price climbs above 4040, look for short-selling opportunities. During pullbacks, monitor 4028-24/22 as key support levels for potential long entries.

Gold Trade Set Up Oct 10 2025Price has shifted into bearish structure yesterday and is trading in between a 15m demand and supply so i would want to see price tap into demand to go higher into supply before continuing down
www.tradingview.com

Gold rebounded. Has it reached its peak?Gold has finally experienced its first pullback, falling from a high of 4058 to a low of around 3944, a drop of over 100 points. This marks the first significant pullback since the recent surge in gold prices. The main reason for the sharp pullback in gold prices is the strong dollar rally following the ceasefire agreement between Israel and Hamas, which allowed investors to take profits. Gold prices continued to fall from their highs, ultimately breaking below the 4000 mark, forming a short-term double top.
Affected by the sharp drop, the price of gold has effectively fallen below the 5-day moving average support, and the short-term moving average support function has become ineffective. After Friday's opening, gold prices traded between the 5-day and 10-day moving averages, entering a transitional consolidation range within the short-term moving average. The 5-day moving average has now turned upward, and the 10-day moving average has crossed the 20-day moving average, indicating a flat trend.
The price has currently rebounded near the lower Bollinger Band, and will remain within the upper middle band in the short term.
Short-term support levels: 3970, 3950.
Short-term resistance levels: 4000, 4015, 4030.
Trading strategy:
Short around 4005, stop loss at 4015, profit range 3960-3940.
Long around 3940, stop loss at 3930, profit range 4000-4010.
Gold (XAU/USD) Resistance Rejection and Bearish Correction SetupChart Overview
Pair: Gold vs. USD (XAU/USD)
Timeframe: 1H
Current Price: ≈ $4,036.59
Trend: Uptrend channel, but approaching a key resistance zone
🔍 Key Levels
Resistance Zone: $4,066 – $4,123
Price has entered this zone, indicating potential bull exhaustion.
Support / Target Level: $3,833
Marked as the target point, aligning with previous structure support and 5.48% correction potential.
📈 Technical Structure
The price has been respecting an ascending channel, with higher highs and higher lows.
Currently, the price is testing the upper boundary of this channel and resistance zone simultaneously.
The chart indicates a potential reversal (shown by the gray arrow) — a bearish correction after testing resistance.
🧭 Projection
Scenario 1 (Bearish Rejection):
If the price fails to break above $4,123, expect a retracement toward $3,833.
This aligns with a 5.48% pullback from the resistance area.
Scenario 2 (Bullish Breakout):
If price closes above $4,125 with strong momentum, next resistance could be near $4,200–$4,250.
⚙️ Conclusion
Primary Bias: Bearish correction from resistance
Short-term Strategy: Look for short setups near $4,070–$4,120 with targets around $3,830
Invalidation Level: Sustained close above $4,130 (channel breakout confirmation)

Prices fluctuated wildly. Downward pressure persists.On Thursday, the market experienced significant price fluctuations, correcting around 4041.5 before rapidly rising, reaching a high of 4058.2. However, the market reversed during the US trading session. Influenced by news of a ceasefire in the Middle East, prices plummeted below the 4000 mark, reaching a low of 3943.3 before consolidating and closing at 3976.9.
This converging pattern indicates that short-term downward pressure persists.
Short-term Trading Focus:
1. Focus on the 4000 mark. If the price rebounds near this level, consider shorting.
2. After breaking through 4000, consider a final short position at 4020.
Profit targets are 3980-3960. Further declines could target 3945-3920.
A long strategy can start with a small long position around 3945, with a profit range of 3980-4000.
