14/10/68 : XAUUSD ( Europe / London Session )Using it from Europe Session until 7.00PM , I'll new analysis and update at 8.00PM
Resistance
4190-4195
4180-4185
4174
Support
4163
4153-4158
4143-4148
Xauusdsignal

Gold Price Outlook – Trade Setup (XAU/USD)📊 Technical Structure
TVC:GOLD Gold (XAU/USD) rallied strongly in the Asian session, reaching $4,130, marking a fresh all-time high. Price action shows a support zone at $4,112–$4,117 and a resistance zone at $4,159–$4,165. If gold consolidates above support, buyers may attempt to push toward the resistance zone. However, as the rally has been steep, some pullback into support is possible before the next leg higher.
🎯 Trade Setup
Entry: $4,112–$4,117 (buy near support)
Stop Loss: $4,109
Take Profit 1: $4,137
Take Profit 2: $4,159
Take Profit 3: $4,165
Risk/Reward (R:R): ~1 : 6.22
🗝️ Key Technical Levels
Support Zone: $4,112–$4,117
Resistance Zone: $4,159–$4,165
Trend Bias: Bullish above $4,112
🌍 Macro Background
Gold price (XAU/USD) jumps to a fresh record high near $4,130 during the early Asian session on Tuesday, supported by renewed US–China trade war fears. US President Donald Trump announced new trade measures, including 100% tariffs on all Chinese goods and export controls on critical US-developed software, effective November 1. Although Trump later struck a softer tone, saying the US was not looking to “hurt” China, investors still rushed to safe-haven assets.
At the same time, expectations for further Federal Reserve rate cuts are growing. Markets are pricing in an almost certain 25 bps cut in October and another in December, according to the CME FedWatch tool. Lower interest rates reduce the opportunity cost of holding gold, supporting the rally. Traders are also awaiting Fed Chair Powell’s speech later on Tuesday, which could provide additional policy guidance.
Despite strong year-to-date gains (over 56%), analysts note that while the rally has legs, a short-term correction would be healthy for sustaining the long-term uptrend.
📌 Trade Summary
Gold remains bullish above $4,112 support zone. Dips into this area are likely to attract renewed buying interest, with upside targets at $4,159–$4,165. A break below $4,109 would invalidate the bullish setup and expose deeper corrective pressure.
⚠️ Disclaimer
This analysis is for reference only and does not constitute trading advice. Trading involves significant risk, and proper risk management is essential.

Gold breaks through 4100. What's the target?Gold finally broke through 4100, which is also what we said earlier that breaking through 4100 is a high probability event. Gold finally broke through and stabilized above 4100, so the next target of gold is 4200?
Gold is still in a bull market now, and any decline basically provides an opportunity to go long. Gold continues to break upward in the US market, and the atmosphere of gold bulls is very strong. Gold has broken through and stabilized above 4100, so the next target of gold will be higher.
In terms of daily chart structure, gold is currently in a state of top divergence for a long period of time. It is impossible to determine how long this state will last. We can only pay attention to unpredictable changes in fundamental sentiment. Currently, gold is significantly off its technical trajectory. Under the influence of various market factors, gold's bullish trend remains unwavering. This is undeniable. Therefore, this week's trading will continue to focus on buying on pullbacks.
Trading Strategy:
Establish long positions in batches when the price falls back to 4115-4105, with stop-loss orders below 4100. Profit range: 4130-4140-4150.

ElDoradoFx PREMIUM 2.0 - (14/10/2025, ASIA SESSION)Gold remains in a strong bullish trend across all major timeframes, consolidating near the 4,110–4,117 resistance zone after a solid impulse from 4,050.
The market shows sustained buying pressure, but short-term exhaustion is visible with potential for a healthy pullback before continuation.
⸻
🧩 Multi–Timeframe Technical Breakdown
📆 Daily (D1):
• Candle closed bullish, extending the uptrend from late September.
• RSI remains overbought (~86) → suggesting potential short-term correction.
• MACD still expanding positively → confirms medium-term bullish continuation.
Bias: Bullish (Possible minor retracement before continuation)
⸻
⏰ 1H Structure:
• Clear BOS above 4,078, followed by sustained higher highs and higher lows.
• Price currently consolidating under 4,117 resistance after intraday overextension.
• 20EMA and 50EMA acting as dynamic support near 4,100–4,104.
• MACD histogram losing strength — early retracement signals forming.
Bias: Bullish, but expecting corrective pullback before next leg
⸻
🕒 15M–5M Intraday Outlook:
• Price forming a minor CHoCH at 4,117, confirming exhaustion at top of ascending channel.
• Potential pullback into Fibonacci Golden Zone (4,097–4,101) for liquidity grab before continuation.
• If 4,093 breaks, expect a short-term correction back into 4,085–4,072 liquidity pocket.
⸻
✨ Fibonacci Golden Zone
Swing Low: 4,085 → Swing High: 4,117
🎯 Golden Zone: 4,097 – 4,101
This confluence aligns with 1H EMA + BOS retest → ideal re-entry area for buys.
⸻
📈 Trading Plan
✅ High Probability Buy Setup (Continuation Bias):
• Entry: 4,097–4,101 (Golden Zone retest)
• Confirmation: Bullish rejection / EMA bounce
• Targets: 🎯 4,117 → 4,125 → 4,135 → 4,150
• Stop Loss: 🛑 Below 4,085
⸻
⚠️ Short-Term Sell Setup (Correction Bias):
• Entry: Break & Retest below 4,093
• Targets: 🎯 4,085 → 4,072 → 4,050
• Stop Loss: 🛑 Above 4,104
⸻
🧠 Key Market Levels
• Resistance: 4,117 / 4,125 / 4,135
• Support: 4,101 / 4,093 / 4,085 / 4,072
• Trendline Supports: 4,085 & 4,050 zones
⸻
📰 Fundamental Context
• No major Asian data → technicals dominate.
• U.S. Bank Holiday liquidity fading; normal flow resumes in London.
• DXY steady near 104.80, keeping gold capped but structurally bullish.
⸻
⚡️ Summary
Gold remains bullish overall, consolidating below 4,117 after strong gains.
Expect an intraday pullback toward 4,097–4,101 before the next impulse.
Break above 4,117 → confirms continuation to 4,135–4,150.
Break below 4,093 → triggers short-term correction only.
⸻
📊 Prepared by ElDoradoFx PREMIUM 2.0
💎 Professional XAUUSD Analysis | Session Outlooks | Smart Money Insights
#XAUUSD #Gold #Forex #ElDoradoFx #PriceAction #SmartMoney #AsiaSession #TradingView #TechnicalAnalysis
⸻
🥇 ElDoradoFx PREMIUM 2.0 – PERFORMANCE 13/10/2025 🥇
⚡️ GOLD TRADE RESULTS:
🔻 SELL +30 pips
🟢 BUY +210 pips
🟢 BUY +360 pips
---
💰 TOTAL GAIN: +600 pips
🎯 RESULT: 3 Signals → 3 Wins | 0 SL
📊 ACCURACY: 100 % ✅
---
🔥 Sharp setups. Strong momentum. Maximum precision.
A flawless start to the week — profits locked in 📈💎
🚀 Congratulations if you profited! ✅✅✅

GOLD Will Go Down!
HI,Traders !
#GOLD is trading in an upward trend and has
formed an ascending channel. Now it has touched
the upper limit of the channel. We expect
a correction from there !
Comment and subscribe to help us grow !

Gold Next Move : 4222? NEW ATH CONTINUOUSLY ?Gold Currently Runs On The Bullish Channel
We Are Considering Bullish Setup On RBS Pull Back Buy Zone
Area To Buy 4060 / 4050
Pullback Buy
Target Bullish Setup 4220 - 4250
Lets Gooo NEW ATH GOLD

Gold: Breaks Above 4900, Targets 4100-4120 ResistanceAs we predicted over the weekend and this morning, Gold is exhibiting the characteristic of "strong rally + high-level consolidation" today. The price surged rapidly after the opening; despite a slight pullback in the middle, bullish sentiment remains strong. It has now broken above 4900 and is expected to test the resistance range of 4100-4120.
As we also mentioned today.If it breaks above 4,080, you can go long in line with the trend, with targets set at 4,100
Buy 4070 - 4080
TP 4090 - 4100 - 4110
SL 4060
Daily-updated accurate signals are at your disposal. If you run into any problems while trading, these signals serve as a reliable reference—don’t hesitate to use them! I truly hope they bring you significant assistance

Gold continues to rise. Bulls and bears clash.Last week, gold prices intensified risk aversion amid Trump's tariff policy. Subsequent rhetoric of peace has tempered risk sentiment, but gold prices haven't fallen. Gold opened the week stronger, hitting new all-time highs. Currently, the market's gains are primarily due to a lack of bearish catalysts, allowing prices to rise by inertia.
From an information analysis perspective, as the Federal Reserve continues its dovish policy response, real interest rates may continue to decline, which will support the long-term upward trend of gold.
At present, gold is still rising slowly, breaking through highs continuously, and the upward trend is still continuing. It is still unknown whether it can break through 4100. The first retracement point that can be seen at present is 4060. If it unexpectedly falls below, it will test the 4030 line, but it seems a bit difficult at the moment.
The 1-hour moving average continues to diverge upward, and gold bulls still have upward momentum, but we need to pay attention to the correction after the price surges. The overall strong upward trend of the hourly line has not changed. There may be small fluctuations in the short term, and you can try to enter the market operation. The short-term resistance level is temporarily focused on the 4100 mark, and the support level is around 4060.
Trading Strategy:
Go long on a pullback near 4060, with a stop loss at 4050. Profit range: 4085-4090-4100.
Short around 4095, with a defense at 4105. Profit range: 4070-4060-4050.

4100 Breakout in Sight! Gold Bulls Target 4130 Next!Gold is still maintaining a strong upward position and has broken through the recent high of 4050-4060 in the short term. There is no clear suppression area above and no obvious signs of turning back. According to the current structural form, gold still has the potential to continue to rise and is expected to hit 4100 or even around 4130. Currently, we need to pay special attention to three areas:
1. Market sentiment: around 4100;
2. Key area for continued gains: around 4130;
3. Short-term support below: 4055-4045.
Therefore, when executing short-term trades, we should avoid excessively chasing gold prices. We can consider waiting for gold to retreat to the 4055-4045 area before initiating small long positions.
If you’re following this rally, don’t just watch — prepare your next move.
💬 Like & Follow for real-time updates and in-depth gold insights.
📈 Follow me for real-time gold insights &to my traders' channel for exclusive setups in bio!

Gold Trade Set Up Oct 13 2025Gold bullish trend continues making ATH so i will only be looking for buys for now. A 5m demand just got respected to id like to see a 15m BOS followed by a 15m demand or support touch before looking for buys but i will be careful since it can reverse anytime

XAUUSD: long-short battle hinges on 4060-4080📈Today's daily chart shows that after completing a "double bottom" last Friday, Gold stabilized and rebounded, which fully aligns with our weekend forecast. It closed with a long lower wick bullish candlestick, indicating robust buying interest at lower levels and that the medium-to-long-term uptrend remains intact.
📈On the 4-hour chart, the Bollinger Bands have started to contract, signaling that gold prices may enter a consolidation range of 3,930 - 4,070. Today, after breaking above 4,070, the price failed to hold this level and pulled back to around 4,069 for consolidation. This reflects strong resistance near 4,080, and in the short term, we need to be wary of a pullback risk triggered by profit-taking among bulls.
💡Intraday, focus on price fluctuations within the 4,060 - 4,080 range. If it breaks above 4,080, you can go long in line with the trend, with targets set at 4,100. If it pulls back below 4,030, be alert to the formation of a short-term top.
Buy 4040 - 4050
TP 4060 - 4070 - 4080
SL 4030
Daily-updated accurate signals are at your disposal. If you run into any problems while trading, these signals serve as a reliable reference—don’t hesitate to use them! I truly hope they bring you significant assistance

Bullish Strategy Secures Profits — What’s the Next Move?Good evening, everyone!
Today, gold surged above 4040 before pulling back to the 4033–4022 support area, then rebounded strongly to break the 4050–4060 previous highs, setting another new record.
Congratulations to all traders who followed the strategy — this move has delivered impressive profits! 👏
From a medium-term perspective, the overall structure remains bullish. However, on the 30-minute timeframe, the market shows signs of a technical correction, which is a normal consolidation phase.
Short-term support is located near the 4050 previous high, followed by 4038–4028. In a deeper pullback scenario, the price could test 4015–4011, though without major news catalysts, such a decline seems less likely. Therefore, attention should focus mainly on 4050/4038 as key short-term zones.
If gold continues rallying without a proper pullback, the next potential upside target is around 4100. Should the price reach that level with weakening momentum, it may present a relatively low-risk short-selling opportunity.
Trading Strategy Summary:
Swing traders: Consider buying near 4050 and selling near 4100.
Short-term traders: Use quick in-and-out trades around intraday support and resistance levels.

XAU/USD: GOLD HITS NEW ATH! Buy or Sell Now?Gold (XAU/USD) exploded in the Asian session, setting a New All-Time High (ATH)! This powerful rally is fueled by a perfect storm of global risks:
🇺🇸🇨🇳 Trade Tensions Surge: Trump's threat of 100% tariffs on Chinese exports, despite a later softening, created massive uncertainty.
⚠️ Geopolitical Risk: Trump's warning about sending Tomahawk missiles to Ukraine keeps geopolitical tensions high, boosting safe-haven demand.
🏛️ US Government Shutdown: The funding deadlock continues, entering its third week, eroding confidence.
✂️ Fed Cut Hopes: High probabilities for Fed rate cuts in October/December (96%/87%) continue to strongly support the non-yielding precious metal.
🔍 TECHNICAL ANALYSIS: Structure Has Flipped BULLISH!
The price action this morning was crystal clear, showing Smart Money is in control:
Liquidity Sweep & Reversal: Gold saw a rapid "sweep" below the 4000 mark, triggering sellers' stop-losses and creating a Fair Value Gap (FVG), before reversing and recovering lightning-fast.
Uptrend Established (BOS & MSS): This surge led to a Break of Structure (BOS), clearing the old ATH at 405x, and confirming a distinct Market Structure Shift (MSS). The market structure has officially flipped from bearish to BULLISH.
Trading Strategy:
Priority: BUY as long as the price maintains above the Order Block (OB) key support zone at 405x. This is the critical support level.
Risk Warning: Extreme caution is advised for shorting at highs. The risk of price traps and liquidity grabs at psychological round numbers is very high.
Sell Scenario: Only consider a short-term SELL if there is a strong breakdown and a candle close below 405x. The expected target would be a pullback to 4000 to consolidate before resuming the main BUY trend.
👉 Conclusion: Fundamental and technical forces are aligned. Keep watching the 405x support to confirm potential BUY entries.
#GOLD #XAUUSD #ATH #MarketUpdate #TradeWar #FED #SmartMoney #ICT #TechnicalAnalysis

XAUUSD 15m – EW Long SetupHi fellow traders,
On the 15m XAUUSD chart, I am applying Elliott Wave principles to outline a potential long setup. Price appears to have completed wave (iv) and is showing early signs of reversal from the golden box area, suggesting that wave (v) may now be underway.
I am entering at the current price, with a Stop Loss at 3940.00, serving as the invalidation level. My Take Profit is set at 4078.87, targeting the projected completion of wave (v). If price moves below the invalidation level, this wave count is no longer valid.
Good luck and trade safe!

ElDoradoFx PREMIUM 2.0 - (13/10/2025, LONDON SESSION)Gold continues its bullish structure, holding strong above the 4,050 support and trading near recent highs around 4,078. Buyers remain in control, although momentum is showing early signs of exhaustion as price approaches upper channel resistance.
⸻
🔍 Technical Outlook
Daily Chart (D1)
• Strong continuation of the bullish trend since the breakout above 4,000.
• Price is above both 20EMA and 50EMA → confirming sustained upside pressure.
• RSI (74) nearing overbought territory → possible short-term correction before continuation.
• MACD remains strongly positive → confirms underlying bullish bias.
Bias: Bullish, but extended — watch for retracements toward 4,040–4,050.
⸻
1H Chart (H1)
• Structure clearly bullish with multiple BOS (Break of Structure) signals.
• Price broke above 4,060, reaching 4,078 before mild rejection.
• RSI (67) and MACD still positive but flattening → likely short-term pullback.
• Key dynamic support: 20EMA (~4,059) and 50EMA (~4,015).
• If gold holds above 4,059, next impulsive leg could target 4,085–4,100.
Intraday Bias: Bullish with possible retest before new high.
⸻
15M Chart (M15)
• Short-term pullback from 4,078 high; structure remains bullish above 4,050.
• RSI neutral (53) → cooling phase after strong push.
• MACD histogram turning lighter → suggesting consolidation before next move.
• Price creating higher lows → continuation likely if 4,060 support holds.
Short-term Range: 4,050–4,078.
⸻
5M Chart (M5)
• Pullback currently forming a mini flag/channel.
• Buyers protecting 4,060 area.
• A break above 4,072–4,074 could trigger momentum continuation.
• Below 4,050, momentum may flip bearish toward 4,031.
⸻
✨ Fibonacci Golden Zone
Last impulse leg (Low 3,955 → High 4,078)
🔹 Golden Zone: 4,050 – 4,031
This area remains a key buy zone for bullish continuation setups.
Expect buyers to step in aggressively if price revisits this range.
⸻
🎯 High Probability Scenarios
Bullish Continuation Setup
✅ Buy above 4,074 (Break & Retest)
🎯 Targets → 4,085 → 4,095 → 4,110
🛑 SL below 4,060
Rationale:
• Structure continuation from higher low formation
• MACD positive crossover
• RSI above 55 and 1H EMA support
⸻
Bearish Correction Setup
⚠️ Sell below 4,050 (Break & Retest)
🎯 Targets → 4,040 → 4,031 → 4,015
🛑 SL above 4,059
Rationale:
• Overbought conditions from daily RSI
• Possible liquidity grab above 4,078 followed by correction
• MACD 5M histogram turning red → short-term momentum loss
⸻
📅 Fundamental Outlook – London Session
• No major EU or UK data expected early in session.
• Focus remains on U.S. retail sales and Fed commentary later in the day.
• DXY stabilizing around 104.80 → neutral pressure on gold.
• Bond yields steady, limiting large intraday swings for now.
⸻
⚠️ Key Levels to Watch
Type Level Description
Resistance 4,074 / 4,078 Intraday high & breakout zone
Resistance 4,085 / 4,100 Next liquidity target
Support 4,059 Intraday EMA confluence
Support 4,050–4,031 Fibonacci Golden Zone
Support 4,015 Deeper retracement zone
⸻
✅ Summary
Gold remains in a controlled bullish phase, supported by a clean structure and solid fundamentals.
As long as price holds above 4,050, continuation toward 4,085–4,100 remains favored.
However, a failure to hold 4,050 could trigger a correction toward the Golden Zone (4,050–4,031) before renewed buying pressure.
Session Bias: Bullish, but cautious near 4,078.
Break Confirmation:
• Buy above 4,074
• Sell below 4,050
Golden Zone: 4,050 – 4,031
⸻
🥇 ElDoradoFx PREMIUM 2.0 – WEEKLY PERFORMANCE 💸
📆 06/10/2025 → 12/10/2025
MONDAY 06/10/2025
🟢 BUY +110 pips
🔻 SELL +110 pips
🟢 BUY +110 pips
🔻 SELL +60 pips
🟢 BUY LIMIT +150 pips
TUESDAY 07/10/2025
🟢 BUY +20 pips
🟢 BUY +20 pips
🔻 SELL +110 pips
🔻 SELL +60 pips
🟢 BUY LIMIT +210 pips
⚖️ SELL – BE
🟢 BUY +40 pips
🟢 BUY +20 pips
💸 BTC/USD BUY +2,500 pips
WEDNESDAY 08/10/2025
🔻 SELL +60 pips
🟢 BUY +20 pips
🟢 BUY +40 pips
🔻 SELL +110 pips
❌ SELL –40 pips (SL)
🟢 BUY +210 pips
❌ SELL –40 pips (SL)
🟢 BUY LIMIT +40 pips
THURSDAY 09/10/2025
🔻 SELL +20 pips
🔻 SELL +60 pips
🟢 BUY +20 pips
🟢 BUY +120 pips
🟢 BUY +110 pips
🟢 BUY LIMIT +30 pips
🟢 BUY +60 pips
FRIDAY 10/10/2025
🔻 SELL +50 pips
🔻 SELL LIMIT +20 pips
❌ SELL –95 pips (SL)
🔻 SELL +210 pips
🟢 BUY +110 pips
🟢 BUY +200 pips
🔻 SELL +40 pips
💸 BTC/USD BONUS TRADES (Weekend)
🔻 SELL +200 pips
🟢 BUY +2,300 pips
📊 WEEKLY STATS
🏆 GOLD NET PIPS: +2,265
💰 BTC/USD NET PIPS: +5,000
🚀 TOTAL GAIN: +7,265 pips
📈 RESULT: 38 Signals → 34 Wins | 3 SL | 1 BE
🎯 WIN RATE: 89%
🔥 Summary:
Strong GOLD momentum + explosive BTC performance!
Discipline and precision continue to deliver massive results 💪📈
👏 Congratulations if you profited! ✅✅✅🚀🚀🚀

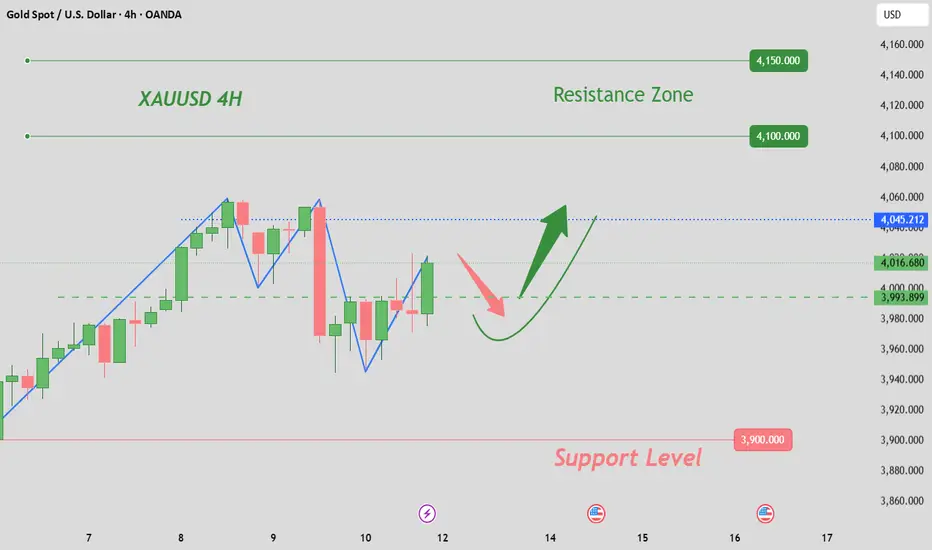
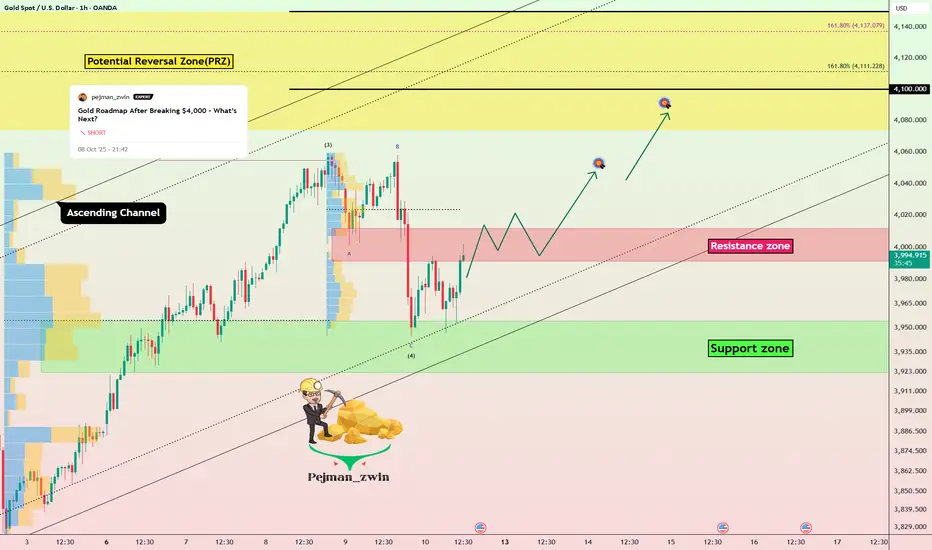
Gold Breakout Setup After Completing CorrectionGold ( OANDA:XAUUSD ) fell to $3,963 , as I expected in my previous idea .
Gold is currently moving near the lower line of the ascending and the Resistance zone($4,012 – $3,991) . If Gold touches $4,003 , we can expect a break of the Resistance zone($4,012 – $3,991) .
In terms of Elliott Wave theory , it seems that the Zigzag Correction(ABC/5-3-5) of Gold in the form of wave 4 has been completed, and we can expect a rise in Gold in the coming hours after the break of the Resistance zone($4,012 – $3,991) .
I expect Gold to break the Resistance zone($4,012 – $3,991) in the coming hours and rise to at least $4,047(First Target) .
Second Target: Potential Reversal Zone(PRZ)
Stop Loss(SL): $3,918(Worst)
Support zone: $3,954 – $3,923
-----------------------------
Today, we’ll be watching two reports :
Prelim UoM Consumer Sentiment and Prelim UoM Inflation Expectations.
If we see a significant deviation from expectations, it could trigger noticeable volatility in Gold .
-----------------------------
Please respect each other's ideas and express them politely if you agree or disagree.
Gold Analyze (XAUUSD), 1-hour time frame.
Be sure to follow the updated ideas.
Do not forget to put a Stop loss for your positions (For every position you want to open).
Please follow your strategy; this is just my idea, and I will gladly see your ideas in this post.
Please do not forget the ✅ ' like ' ✅ button 🙏😊 & Share it with your friends; thanks, and Trade safe.
XAUUSD – Safe-Haven Flows Continue to Support GoldMarket Context:
Gold remains firm as renewed US–China trade tensions and rising geopolitical risks drive safe-haven flows into XAUUSD.
Expectations of further rate cuts from the Federal Reserve continue to weaken the US Dollar, reinforcing bullish momentum for the metal.
Current Outlook:
As long as price action stays within the ascending channel, gold is likely to extend toward the 4,090–4,100 liquidity zone.
If a reaction occurs near 4,092–4,095, a short-term corrective move could follow.
Despite short-term overbought signals, the broader market structure still supports the bullish side.
Key Levels:
Liquidity Buy Zone 1: 4,039 – 4,037
Liquidity Buy Zone 2: 4,017 – 4,015
Liquidity Sell Zone: 4,092 – 4,095
Major Support: 4,010 – 4,000
Major Resistance: 4,110 – 4,126
Trading Plan:
🔹 BUY ZONE
Entry: 4,039 – 4,037
Stop Loss: 4,032
Take Profit: 4,044 → 4,048 → 4,052 → 4,056 → 4,060 → 4,070
🔹 BUY ZONE
Entry: 4,017 – 4,015
Stop Loss: 4,010
Take Profit: 4,022 → 4,026 → 4,030 → 4,040 → 4,050 → 4,060
🔹 SELL ZONE (Scalp Opportunity)
Entry: 4,092 – 4,095
Stop Loss: 4,100
Take Profit: 4,090 → 4,085 → 4,080 → 4,070 → 4,060
Summary:
The current structure remains bullish as long as the 4,015 – 4,020 zone holds firm.
Safe-haven demand and expectations of Fed easing continue to favour the upside.
Watch for potential liquidity sweep around 4,092 before any higher continuation.
📊 What’s your view — will gold break out or face rejection near 4,090?
👉 Follow MMFLOW TRADING for more structured daily plans and professional insights.

Gold continues to surge. Is it unstoppable?Last week, a single social media post by President Trump wiped out $2 trillion in US stock market value, with the S&P 500 index falling 2.7% that day, its worst performance since early April. The reality of this incident demonstrates that Trump's authoritarian trade policies continue to influence the fate of the global economy.
In early Asian trading on Monday, gold briefly hit $4,060, a new all-time high. With market concerns easing slightly, it is currently fluctuating around the 4,050 high.
Looking at the 4-hour chart, Quaid believes gold prices still have the potential to reach new highs. Current support is around 4,035, followed by 4,020.
If support at 4,035 is broken, gold could potentially reach the 4,080-4,090 high. This is because 4,035 is at the 0.618 Fibonacci support level, while 4,020 is at the 0.50 level.
However, the possibility of a deeper pullback to 4020 cannot be ruled out. As long as gold remains above 4020 in the short term, it remains strong.
For short-term operations, Quaid recommends that you can go long around 4035. If the price breaks through 4060, the target may reach 4080-4090.

Risk aversion is intensifying. Is the rally accelerating?In early Asian trading on Monday, gold continued to rise, rising 1% at one point to a record high of $4,060 per ounce. Due to the tense international trade situation, escalating geopolitical risks, expectations of a Federal Reserve rate cut, and political turmoil in many countries, the safe-haven demand for gold remained high. As a non-interest-bearing asset, gold has once again proven its status as the "king of safe havens" amidst uncertainty shrouding global markets.
Gold is currently maintaining its trend, with a strong bullish structure intact, and has seen eight consecutive weeks of gains on the weekly chart. From a technical perspective, the RSI indicators on the daily and weekly charts have both reached 80, indicating overbought conditions. However, the daily MA10/7-day moving averages continue to open upward and gradually move up. After several rounds of adjustments last week, the market finally closed above the 5-day moving average of 4,000.
Technically, gold remains primarily bullish on dips, but be wary of sharp pullbacks after overbought levels. Recent market volatility is significant, so strict risk management is essential when participating in the market, and opportunities for entry during pullbacks are crucial.
Trading Strategy:
Long around 4025, stop-loss at 4015, profit range 4060-4080;
Short around 4080-4085, stop-loss at 4095, profit range 4040-4020;
Gold |US–China Tensions Ease, Gold Eyes a New Breakout Above ATH🌍 Macro Overview: Cooling US–China Tensions
Geopolitical pressure between the US and China appears to be easing after China’s Ministry of Commerce clarified that export controls on rare earth materials do not mean an export ban — a clear attempt to reopen constructive dialogue with Washington.
Meanwhile, US Vice President JD Vance signaled a softer stance toward Beijing, stating:
“We highly value the friendship between President Trump and President Xi Jinping.”
“President Trump hopes the US won’t need to use leverage against China.”
“President Trump is ready for a fair and reasonable negotiation with Beijing.”
➡️ These remarks suggest a temporary de-escalation in geopolitical risks, improving overall risk sentiment and prompting investors to shift focus back to technical structures and liquidity zones on gold.
💎 Technical Outlook (XAU/USD H1)
After a sharp drop from its All-Time High (ATH), gold found strong support at the 3975–3985 Support Zone, coinciding with a Change of Character (ChoCh) reversal area.
Price has since established an ascending channel, moving back toward the upper liquidity zone (4020–4030) — a critical area where short-term profit-taking may occur before another leg higher.
⚙️ Key Technical Levels
Liquidity Zone $$$ (4020–4030): Short-term resistance; potential pullback zone.
Liquidity Zone $$$ (3990–4005): Key demand area where buy orders are likely stacked.
Breakout Support: 4008 — now acting as near-term structure support.
ATH Zone: 4045–4050 — key upside target; a confirmed breakout could open room toward 4100.
📈 Trade Scenarios
Primary Scenario (Buy on Dip):
Look for price to retest the 3995–4005 liquidity zone for long entries.
Target: 4025 → 4050.
Stop loss: below 3980.
Extended Bullish Scenario:
If price holds above 4050, the next expansion target lies at 4080–4100.
⚠️ Risk Notes
The US–China diplomatic tone remains fragile; sudden rhetoric shifts could trigger volatility.
Wait for a confirmed H1 close above 4025 to validate bullish continuation before scaling in.
🧭 Summary
The easing in US–China tensions has reduced safe-haven demand for gold in the short term, but technical momentum still favors the bulls.
As long as the 4000 psychological level holds firm, XAU/USD is well-positioned to retest and potentially break above the 4050 ATH zone, targeting 4100+ in the coming sessions.

Gold vs Dollar – Bullish Confirmation & Risk Management PlanXAU/USD "The Gold vs US Dollar" - Metal Market Cash Flow Management Strategy ⚡ (Swing/Day Trade)
📊 Trading Plan:
✅ Bias : Bullish confirmation spotted as Hull Moving Average shows an upside pullback trend.
✅ Entry Idea : Flexible entry with layering strategy (scaling in with multiple limit orders) :
$3650
$3660
$3670
$3680
( You can add more layers depending on your risk and strategy preference. )
🛡️ Risk Management:
Suggested Protective Stop Loss : around $3630 (after breakout levels).
⚠️ Note : Please adjust SL based on your personal strategy and risk tolerance — this is not a fixed recommendation.
🎯 Target Outlook:
Short-term resistance expected near $3740 (where moving averages converge + overbought conditions may trigger profit-taking traps).
Idea: secure profits before market reversals.
⚠️ Note : Target levels are flexible. You can adjust according to your own plan and market conditions.
🔑 Key Points:
Hull MA Pullback → signals bullish continuation.
Layered Entry → improves average price & manages volatility.
Exit Discipline → respect your risk plan, don't rely solely on posted SL/TP.
🔗 Related Pairs to Watch (Correlation & Flow):
🟢 OANDA:XAGUSD (Silver/USD) → Often moves in tandem with gold, can confirm metal market strength.
🟢 TVC:DXY (US Dollar Index) → Inverse correlation with gold; weak USD = stronger gold.
🟢 FX:EURUSD → Euro strength usually aligns with gold bullish momentum.
🟢 FX:USDJPY → Safe-haven flows: when JPY strengthens, gold tends to follow.
✨ “If you find value in my analysis, a 👍 and 🚀 boost is much appreciated - it helps me share more setups with the community!”
#XAUUSD #Gold #Forex #DayTrading #SwingTrading #HullMA #TradingStrategy #RiskManagement #Metals #FXAnalysis #DXY #TechnicalAnalysis

$4024 Gold: 8-Week Record. BUY Pivot $398x! Hello, traders!
Gold just wrapped up an impressive 8-week winning streak, closing the session at $4,024.40/oz (Futures). This rally was immediately triggered by President Donald Trump's unexpected threat of new tariffs on China, which fueled a rush toward safe-haven assets.
Fundamentals & Technical Bias: Buying the Pivot
Core Drivers: Escalating trade conflict (Trump), continued Fed rate cut expectations, and global political instability (US Shutdown, France risk) are solidifying gold's safe-haven status.
Technical Recovery: After a deep correction to $394x, gold recovered quickly and closed firmly above $399x. This confirms that buying pressure is dominant and the bullish momentum remains strong.
Priority Bias: BUY (Long). $398x is the critical short-term pivot point.
Risk Warning: Only switch to SELL (Short) if the price rapidly breaks below $398x due to negative news.
Key Price Levels:
Resistance: $4064, $4084, $4104, $4124
Support: $3984, $3951, $3934
Trading Strategy (Prioritize BUY at the Pivot)
BUY ZONE (Pivot $398x): $3984 - $3982
SL: $3974
TPs: $3992, $4002, $4012, $4022, $4032
SELL ZONE (Counter-Trend): $4024 - $4026
SL: $4034
TPs: $4016, $4006, $3996, $3986, $3976
Will the threat of a trade war push gold toward $4100 next week? 👇
#Gold #XAUUSD #4KGold #TrumpTariffs #8WeeksUp #Pivot #TradingView

Gold Performance Recap for the weekThe XAU witnessed a "surge, pullback and rebound" trend this week, recording the largest weekly volatility since 2025.
The movement can be divided into three phases:
1 Monday: A record-breaking sharp rally
2 Tuesday-Wednesday: High-level consolidation and a second rally
3 Thursday-Friday: Volatile swings driven by policy divergences
Looking ahead to next week, if the Federal Reserve's October interest rate decision delivers the anticipated 25-basis-point rate cut as scheduled, gold prices are expected to challenge the 4,080 resistance level; if signals of a "rate cut pause" are released, a deep correction may be triggered with the support level eyed at 3900.
We also need to monitor whether the historical high of 4,057 can be effectively broken and the strength of support around the weekly consolidation center at 3,989.