Gold: Stretched, Channel Broken, First Real Pullback Next?1️⃣ Overview
Yesterday, Gold reached a new all-time high at 4061, marking the 8th consecutive ATH in 8 days. If we also consider that the yellow metal has been rising for 8 consecutive weeks, the bullish momentum is undeniable.
However, no market can rise indefinitely without pauses. Regardless of how strong the uptrend is, corrections are necessary, and I believe we are very close to one — if not already in it.
________________________________________
2️⃣ Technical Context
After Friday’s low at 3820, Gold traded within an ascending channel, climbing around 2500 pips from bottom to top. This represents roughly a 6% increase, which is quite significant — especially coming after about a 15% rise in the previous 7 weeks.
Now, the channel has been broken, and Gold has entered a small correction toward the 4000 zone. At the time of writing, the market is rebounding, suggesting that bulls have not yet given up.
Still, this rebound looks more like the first sign of exhaustion than renewed strength. Even if bulls manage to push for another all-time high, the market structure is weakening.
________________________________________
3️⃣ Key Zones to Watch
The 4000 level is now the main psychological area and the line in the sand, followed by the 3990 zone, which acts as technical support.
A sustained break below these areas could open the way for a sharper correction toward the 3900 region, which would still only scratch the surface of the broader rally.
________________________________________
4️⃣ Market View
Of course, the bullish trend will remain intact on the medium term, but momentum is stretched, and a cooling phase looks increasingly likely.
I’m currently watching for potential selling points around yesterday’s highs, as the market starts to show its first signs of fatigue after an exceptional run.
Xauusdsignal

After the Double Top — What’s Next for Gold Trading?Hello everyone!
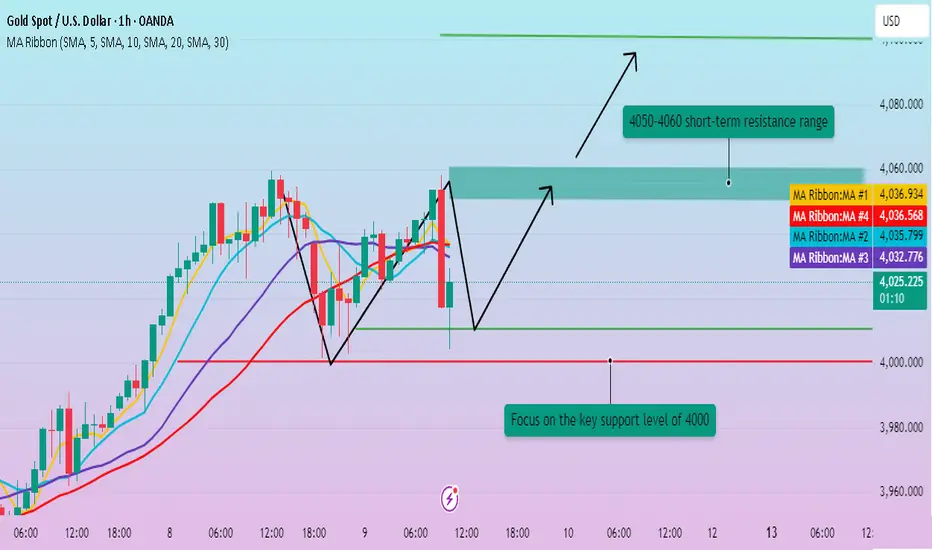
Gold has now formed a clear double-top pattern, and the current price zone is crucial — it will determine whether the market continues its downward move or starts building a potential double-bottom formation.
The key levels to watch are: resistance at 4036 and support between 4011–4000.
Before a decisive breakout occurs, traders can focus on range trading between 4005–4025.
If the price breaks below support, the next downside targets are 3992, followed by 3986–3972/64.
Conversely, if gold breaks above 4036 and stabilizes above it, the price could extend upward toward 4046–4058.
From a technical standpoint, the current structure remains bearish-biased, so long positions should be approached with caution. A quick in-and-out trading style is recommended for safety.
For those who prefer a more conservative approach, it’s better to wait for a clearer breakout signal before entering the market.

Gold (XAU/USD) Rebound Setup – Support Holding StrongAnalysis:
Gold (XAU/USD) is showing signs of bullish strength after testing the $4,000–$3,970 support zone, where buyers are stepping back in. The recent consolidation above support suggests a potential reversal and continuation of the uptrend.
The setup highlights:
Support Zone: Around $3,970 – $4,000, acting as a key accumulation area.
Bullish Trigger: A breakout above minor resistance could drive momentum higher.
Targets:
🎯 Target 1: $4,101
🎯 Target 2: $4,150
🎯 Target 3: $4,200
Stop Loss: Below $3,970 to protect against a downside breakout.
📈 Outlook: As long as price sustains above support, Gold remains bullish, aiming for a breakout towards $4,150 and $4,200 levels.

Gold is experiencing a pullback. Trend Analysis.Spot gold fluctuated and weakened in early Asian trading on Thursday, falling nearly 1% to near the $4,000 mark, hitting a low of $4,001.33. However, it quickly rebounded above $4,020, buoyed by buying. On Wednesday, gold prices not only broke through $4,000 for the first time, but also hit a new all-time high of $4,059.07, driving silver prices to a record closing high.
However, just as the rally was in full swing, a sudden turn in the Middle East geopolitical situation—a ceasefire agreement between Hamas and Israel—quickly cooled market risk aversion, leading to a pullback in gold prices on Thursday. This warrants investor caution. Investors should monitor further news on the Middle East situation and shifts in risk aversion, wary of the possibility that this factor could prompt more long-term profit-taking, triggering a deeper correction in gold prices. They should also be mindful of any dip-buying support.
After Wednesday's rally, gold reached a high near 4059. It reached a high during the consecutive Asian and European sessions, then retreated slightly in the US session, reaching a low near 4000, consistent with the previously analyzed strategy of buying on dips to key levels.
In the short term, maintain a bullish long position, with 4000 as a defensive level. Focus on the previous high of 4060. If it doesn't break, take short-term profits. If it does, the market could potentially head towards 4100 or even higher.
In addition, keep an eye on Thursday, which could be a turning point this week, potentially leading to a sweeping decline.
Overall, the short-term operation strategy for gold is to focus on the 4050-4060 resistance, and the short-term support below is 4000-3990.
Strategy:
Go long near 4010, with a stop-loss at 4000. Profit range: 4650-4060.
9/10/68 : XAUUSD ( US Session )Using it from US Session until 11.00AM , I'll new analysis and update at 12.00PM
Resistance
4065-4070
4055-4060
4050
Support
4039
4028-4033
4017-4023

Gold Trade Set Up Oct 9 2025Price is currently at a resistance so i will wait for a 15m BOS to the upside followed by a demand tap to take it higher or a 15m CISD to the downside to take to SSL
www.tradingview.com

#XAUUSD: Will There Be Major Price Correction On Gold? Dear Traders,
Gold has been rallying with strong bullish momentum and has not experienced a major correction since the last few weeks. We have identified a key level from which the price can continue its bullish momentum if fundamentals do not change. Furthermore, we can target $4200 in a few weeks if the current momentum continues.
Best regards,
Team Setupsfx_

Gold XAUUSD Breakout Setup | VWAP and Market Structure Explained📊 Gold (XAUUSD) Analysis
Gold remains in a bullish trend overall 💪. On the 30-minute timeframe, price is approaching a key level of resistance near the previous swing high.
📈 The VWAP bands show price pressing up toward the first deviation, suggesting momentum remains strong — but this is also where we often see short-term reactions.
💡 Trade idea:
If price can break above the previous high and the first VWAP deviation, then a retrace and retest of that level could offer a potential long opportunity for continuation 🏹.
However, if this setup fails to materialize and price rejects from the current zone, we abandon the long idea and wait for clearer confirmation.
⚠️ Disclaimer: This content is for educational purposes only and not financial advice.

Continued adjustments. Follow the trend.Gold started a steady rise right after the Asian market opened on Wednesday, reaching a high of around 4058.
In the recent market, the bulls have become completely numb to the repeated record highs. In the early stage, the market thought that the integer level of 4000 might form a certain suppression and achieve a callback effect; the fact is that this integer level has no resistance, which also makes the market refresh our cognition. On Wednesday, the U.S. market was trading sideways at a high level. After retreating to around 4026 in the European market, it continued to rise, and the upper pressure position continued to rise.
The moving average system is intact. After a pullback near 4000 in the early Asian session, it continued to rise.
The 4-hour chart shows that the market is in a period of consolidation and correction at a high level, with prices temporarily under pressure near 4050. Currently, the short-term moving average continues to show signs of slight downward divergence, suggesting a consolidation and correction in the short term. The 1-hour chart shows that after a period of narrow range fluctuations, the technical pattern is gradually adjusting. There may be some room for a short-term rebound, but the momentum will be relatively small.
Trading Strategy:
Go long on a pullback to around 4025, with a stop loss at 4015 and a profit range of 4050-4060.

ElDoradoFx PREMIUM 2.0 – (09/10/2025, London Session)Market Bias: Neutral–Bullish (possible upside recovery if 4,030 holds)
Overall Trend: Still bullish on the higher timeframes, though intraday correction continues from 4,059 high.
⸻
🔍 Daily (D1) Outlook
• Gold is in a strong uptrend, supported by 20 EMA (3,998) and 50 EMA (3,867).
• Yesterday’s candle printed a small rejection wick from 4,059 – signaling exhaustion but not reversal yet.
• RSI at 78 → near overbought, indicating limited room for immediate upside before a pullback.
• MACD still positive and widening → medium-term bullish trend intact.
📈 Daily Bias: Trend bullish unless price closes below 3,998 support.
⸻
⏱ 1H (H1) Outlook
• Gold is consolidating between 4,018 – 4,045 inside a minor descending channel within the broader uptrend.
• A bounce from the ascending green trendline aligns with the 20 EMA support (4,030).
• MACD histogram showing smaller red bars → bearish momentum fading.
• RSI ~49 → neutral, showing indecision before London volatility.
• Structure still forming higher lows, maintaining bullish pressure.
🟢 If gold holds above 4,030, a recovery toward 4,045–4,059 is likely.
🔴 Break below 4,018 would confirm short-term bearish continuation to 4,010–3,995.
⸻
⏱ 15M (M15) Outlook
• Gold is coiling between 4,018–4,038 forming a symmetrical triangle, often a precursor to breakout volatility.
• EMA alignment remains positive (20 > 50 > 200).
• MACD turning flat → early consolidation before possible breakout.
• RSI hovering near 50, indicating balanced market.
📍 Key observation: This compression phase will likely break during London — direction will depend on whether 4,045 (upper boundary) or 4,018 (lower boundary) gives way first.
⸻
⏱ 5M (M5) Scalping View
• Range-bound structure within 4,030–4,038.
• Minor liquidity sweeps above and below confirm low-volume accumulation.
• Short-term EMAs crossing upward → micro bullish hint.
💡 Scalpers may watch for breakout candle closes with volume confirmation.
⸻
✨ Fibonacci Golden Zone
Using the latest swing from 3,984 → 4,059, the retracement levels are:
• 38.2% → 4,032
• 50% → 4,021
• 61.8% → 4,010
➡️ Golden Zone: 4,032 – 4,010 (buy interest area if retested with confirmation).
✅ Confluence: aligns with ascending trendline + 1H EMA + psychological support 4,030.
⸻
⚡ Breakout & Retest Levels
Direction Breakout Zone Retest Confirmation Target Zones
Bullish Above 4,045–4,051 Retest 4,041–4,043 4,059 → 4,072 → 4,085
Bearish Below 4,018–4,010 Retest 4,014–4,016 3,995 → 3,984 → 3,970
⸻
📊 Indicators Summary
Indicator Reading Bias
RSI (H1) 49 ⚪ Neutral
MACD (H1) Fading red histogram 🟢 Bullish recovery building
EMAs (20/50/200) Upward aligned 🟢 Bullish structure
Parabolic SAR Below price 🟢 Supportive trend
Volume Decreasing ⚠️ Low volatility before London open
⸻
📅 Fundamental Outlook – London Session
• No major UK data early session.
• Focus on US CPI (tomorrow) → traders may stay cautious.
• DXY stabilizing near 104.70, showing slight weakness, giving gold potential upside room.
• US yields steady; sentiment neutral-to-slightly risk-on.
⸻
✅ Summary
Gold remains inside consolidation but still bullish on structure.
Price is testing a key support zone (4,030–4,018) within the golden zone, where buyers may re-enter.
📈 Buy Scenario (High Probability):
Hold above 4,030 → possible rally to 4,045 → 4,059 → 4,072.
Confirmation: breakout and retest above 4,045.
📉 Sell Scenario (Alternative):
Break and retest below 4,018 → 4,010, opens deeper correction to 3,995–3,984.
🎯 Fibonacci Golden Zone: 4,032 – 4,010 (buy interest area).
⚠️ Invalidation: Close below 4,010 = short-term bearish shift.

$4070 Gold: New Record! Was the Recent Dip a Sell Trap?Hello, traders!
Gold just set a New Record at $4,070.5/oz (Futures). Up 54% YTD, this rally is strongly fueled by two core factors: 1) Confirmed Fed rate cut momentum (backed by FOMC Minutes) and 2) Overwhelming safe-haven demand due to global instability (US Shutdown, Middle East conflict).
Technical Analysis & BUY Dips Strategy Confirmed
The sharp pullback from $405x to $4000 (the Fib 0.5 zone) led many to suspect a reversal. However, buying pressure overwhelmed sellers and broke resistance at $402x.
Technical Conclusion: The dip was a Sell Trap and merely a Consolidation phase. The primary bias is confirmed: BUY on Dips is the absolute priority.
Risk Warning: Only if $4000 is cleanly broken on heavy volume does the risk shift heavily against long positions.
Key Price Levels:
Resistance: $4049, $4057, $4064, $4074, $4084, $4094
Support: $4021, $4009, $3992, $3978
Trading Strategy (Prioritize BUY at Support)
BUY SCALP: $4019 - $4017
SL: $4013
TPs: $4023, $4028, $4033, $4038
BUY ZONE (Strong Demand): $3992 - $3990
SL: $3982
TPs: $4000, $4010, $4020, $4030, $4040
SELL SCALP: $4056 - $4058
SL: $4062
TPs: $4053, $4048, $4043, $4038
SELL ZONE (High Risk): $4084 - $4086
SL: $4094
TPs: $4076, $4066, $4056, $4046, $4036
Can this momentum push Gold past $4100 this week? 👇
#Gold #XAUUSD #4070USD #ATH #Fed #BUYDIPS #SellTrap #TradingView

Gold: Long-short divergence is emergingGold exhibited a consolidative trend today, with the 4000-4050 range providing significant support. After touching an intraday low of 4001, prices rebounded sharply—indicating robust buying interest in this interval.
Resistance is concentrated between 4045-4050. While gold remains in a strong zone above 4000 in the short term, the rate of increase has narrowed compared to previous sessions. Long-short divergence is emerging, warranting caution against pullback risks following rallies.
Market expectations for a 25-basis-point rate cut by the Federal Reserve in November remain uncertain, and this ambiguity has led to the oscillating trend in Gold. If subsequent economic data (e.g., inflation and employment figures) reinforce rate cut expectations, the U.S. Dollar Index may weaken further, potentially allowing gold to break through the 4050 resistance level and advance toward the 4070-4100 range. Conversely, if rate cut hopes fade, prices may retrace to the psychological 4000 level to seek support.
Buy 4000 - 4010 TP 4020 - 4030 - 4040
Daily-updated accurate signals are at your disposal. If you run into any problems while trading, these signals serve as a reliable reference—don’t hesitate to use them! I truly hope they bring you significant assistance

Do you dare to follow the short selling?Judging from the hourly chart, gold rebounded after testing the lower support several times, and stagnated after rebounding to around 4040. After closing the hourly line with a doji, it formed a large negative line. This pattern means that gold may pull back to test the lower support in the short term. Secondly, gold is still under trend suppression in the short term, so we have good reasons to short it.
If gold rebounds again to around 4030-4040, we could consider a light short position, with an eye on 4015-4000.
For more real-time updates, please follow🌐

Short GoldBy hitting ATH I now see a small retracement which is the move that I'm catching.
Has we can see, the price broke the brevious low (orange block) and made an internal retracement (green block/sell block) which was the entry point, the confirmation that validated my trade was the long bearish engulfing candle so I am targetting the levels in between 4,000-3,986 and there most probably the bulls will take control again.

Bulls Reloading After a Healthy Pullback | Next Target: 4090+ 📊 Market Context
After a powerful bullish rally that pushed gold to record highs, XAUUSD retraced about 1% on Thursday as traders took profit from the recent surge. However, this move appears to be a technical correction, not a trend reversal — as indicators have shown overbought conditions for several sessions.
Despite this short-term pullback, the long-term uptrend remains intact.
Gold is up more than 50% year-to-date, driven by:
🌍 Ongoing geopolitical and trade tensions,
💰 The Federal Reserve’s monetary easing cycle,
🏦 Record central bank gold accumulation,
⚔️ Rising global uncertainty, fueling strong safe-haven demand.
Overall, this retracement could be an ideal setup for BUY re-entries, as bulls look to reload positions toward the 4090–4100 liquidity zone.
🔎 Technical Analysis (H1/H4)
Price remains inside the medium-term bullish channel, showing strong reactions around 4000–3980 support.
4010–4008 acts as a quick scalp zone for short-term entries.
3984–3982 serves as a key structural support and liquidity reaction area.
4090–4092 (Liquidity Sell Zone) stands as the major resistance — potential liquidity trap area.
📈 Trading Plan
✅ BUY SCALP: 4010–4008
SL: 4002
TP: 4015 - 4020 - 4030 - 4040 - 4050 - ????
✅ BUY ZONE: 3984–3982
SL: 3978
TP: 3990 - 3995 - 4000 - 4005 - 4010 - 4020 - ????
✅ SELL ZONE: 4090–4092
SL: 4098
TP: 4085 - 4080 - 4070 - 4060 - 4050 - ????
⚠️ Risk Management Notes
The 4000 level remains a strong psychological and structural support — only enter long positions with confirmed price action signals.
Be cautious around 4090–4100, where liquidity sweeps and false breakouts are likely.
Adjust position size properly to manage volatility during high-impact news or geopolitical updates.
✅ Summary
Gold is undergoing a healthy correction phase within its broader uptrend.
The strategy remains BUY-focused at 4010–4008 and 3984–3982,
with upside targets toward 4060–4090,
and a potential short-term SELL opportunity near 4090–4092 if rejection signals appear.
💡 MMFLOW TRADING – Trade with market structure, follow liquidity, and ride the BIGWIN setups!
GOLD|Surge: Targeting $4,100! Where to Buy Ahead of FOMC MinutesHello TradingView community! 🚀
Gold (XAU/USD) continues to demonstrate incredible strength, consistently breaking past old highs and forming a solid upward price channel. This robust rally is not only technically reinforced but is also awaiting a potential catalyst from today's crucial fundamental news.
In this analysis, we will combine two key perspectives: a deep dive into the technical chart to identify optimal entry points, and an examination of the main fundamental event that could significantly impact Gold prices during the US session.
1. Fundamental Perspective: All Eyes on FOMC Minutes
Today's market highlight, Wednesday, October 8, is the release of the FOMC Meeting Minutes at 2:00 PM ET.
Why does this matter? The minutes provide a detailed record of the Federal Reserve's most recent policy meeting in September. Traders will scrutinize the text for any hints about the future interest rate path.
Potential scenarios:
"Dovish" Tone: If the minutes reveal that FED officials are concerned about economic growth and open to further rate cuts, the US Dollar may weaken. This would create a strong push for Gold (XAU/USD), potentially fueling the next price surge.
"Hawkish" Tone: If the minutes emphasize that inflation remains a concern and the FED is not in a hurry to cut rates, the USD may see a short-term recovery, causing Gold to have a corrective dip.
This event is a top catalyst for volatility. Our strategy is to prepare technical zones to capitalize on the market's reaction.
2. Technical Analysis: Detailed Trading Plan
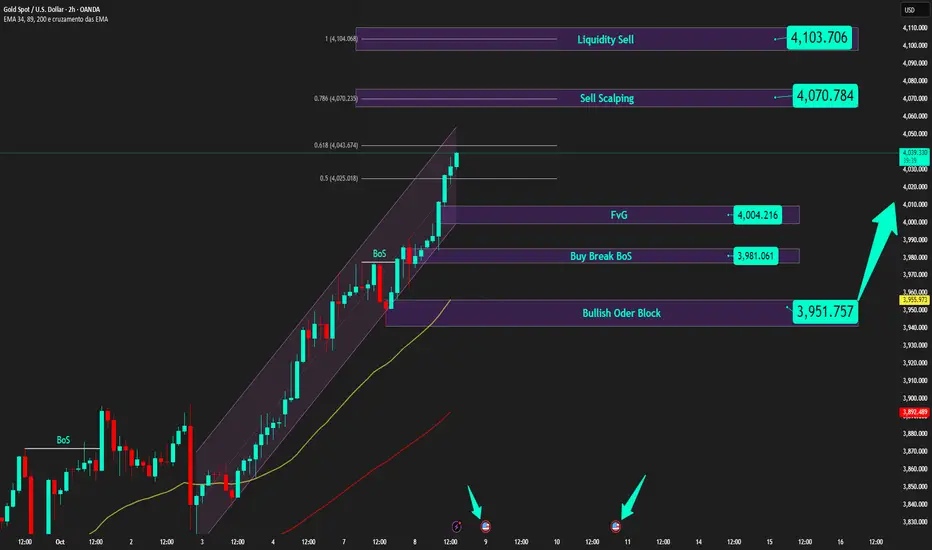
The bullish structure on the 2H timeframe is undeniable. Prices are creating a series of higher highs, confirmed by each "BoS" (Break of Structure), signaling that the Buyers are in full control. Here are the key zones to watch:
Potential Buying Zones (Key Points):
FVG Zone ($4,004): The nearest support is this Fair Value Gap, an area of price imbalance that the market often seeks to fill. Prices may retest this area before or during the news release.
"Buy Break BoS" Zone ($3,981): This is the most recent swing high that has been broken. It has now turned from resistance into a crucial support level. This zone provides a solid entry point if prices correct a bit deeper.
"Bullish Order Block" Zone ($3,951): This is the last major "stronghold" of the Buyers—a strong buy order block that initiated the latest push wave. This is an ideal area to look for buy orders if the market makes a strong liquidity sweep downward.
Upside Targets:
Short-term target (Scalping): $4,070 - This level coincides with the 0.786 Fibonacci level.
Main target: "Liquidity Sell" Zone at $4,103. This is a large "liquidity pool" where the Sell side's stop-loss orders are likely concentrated. Smart money often drives prices towards such areas.
Strategy Summary
Main trend: Bullish.
Core strategy: Look for "Buy the dip" opportunities at the key support zones mentioned.
Critical timing: Be cautious around the FOMC Minutes release (18:00 UTC). Volatility can be high, and the market may whip in both directions to sweep stop-losses before following the main direction.
Pro tip: Patience is key. Waiting for prices to pull back to a confirmed support zone will provide a much better Risk/Reward ratio than chasing the market at the highs.
WHAT'S YOUR TAKE?
How do you think Gold will react to today's FOMC minutes? And where are you looking to place your buy orders—at the FVG zone $4,004, the BoS level $3,981, or are you patiently waiting for the Order Block $3,951?
Share your thoughts in the comments below!
👇 Don't forget to leave a Like 👍 and Follow the channel for the latest XAU/USD analyses!
9/10/68 : XAUUSD ( Europe / London Session )Using it from Europe Session until 7.00PM , I'll new analysis and update at 8.00PM
Resistance
4060-4065
4049-4054
4044
Support
4034
4023-4029
4013-4018

The support is stable. Buy on pullbacks.The strong pattern of the gold market continues, and prices continue to break through historical highs. This strong upward trend has become the new market norm, reinforcing investors' optimistic expectations. However, as gold prices continue to climb to new heights, market sentiment is tinged with a touch of caution, with some investors becoming uneasy about the excessive short-term gains and fearing the possibility of volatile fluctuations.
Although there have been technical pullbacks recently, the pullbacks have been relatively small and have not changed the upward trend. In the current clear, one-way upward trend, a rational trading strategy aligns with the primary trend, viewing each pullback as an opportunity to enter long positions on dips rather than a sign of a trend reversal.
Judging from the 4-hour chart, the current key support area is around 4000, which is an important watershed for judging the strength of the short-term trend. Trading strategies recommend buying on pullbacks, patiently waiting for prices to fall back to support levels before buying. Be wary of high-level volatility and avoid frequent trading during periods of uncertain direction.

GOLD 30M ZONES BUY & SELL Boxes With Arrows You Also Got It That These Are Buy Zones Or Sell Zones
I Mark Zones With Reasons
QM
SUPPORT
RESISTANCE
ENGULFING ZONES
RBS
SBR
Good Luck Guys

Gold Price Outlook – Trade Setup (XAU/USD)📊 Technical Structure
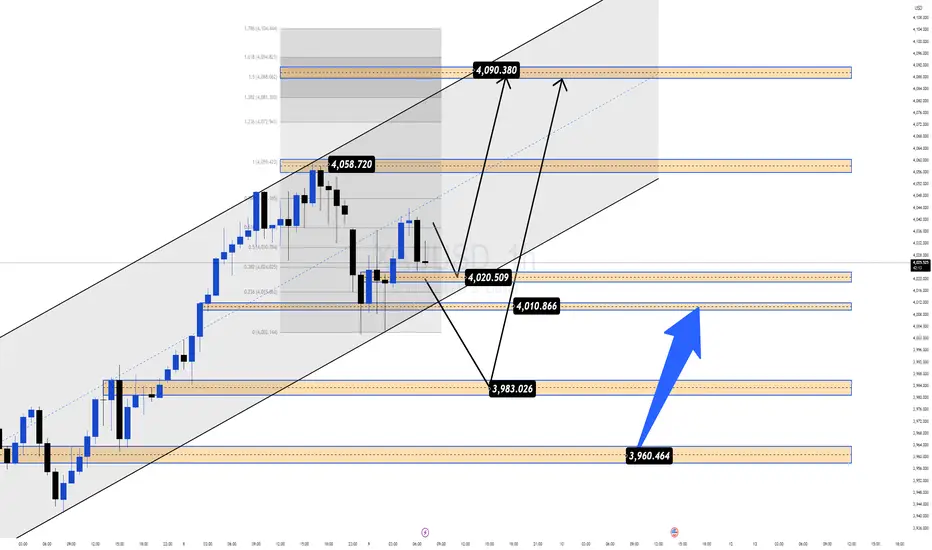
OANDA:XAUUSD TVC:GOLD Gold (XAU/USD) remains firmly supported above the $4,000 psychological level, holding gains despite overbought conditions. The chart shows price respecting the ascending trendline support and consolidating near the mid-channel zone. Immediate resistance lies at $4,121 – $4,135, while the support base is aligned around $3,988 – $4,001. As long as the price maintains above the trendline, the bullish structure remains intact.
🎯 Trade Setup
Entry: $4,002 – $3,988 (buy on dips near support)
Stop Loss: $3,977
Take Profit 1: $4,121
Take Profit 2: $4,133
Risk-Reward (R:R): ~1 : 5.35
🌍 Macro Background
The US government shutdown continues into its ninth day, weighing on confidence in the US economy and weakening the Dollar. At the same time, the Federal Reserve’s dovish stance—with September’s rate cut already delivered and further cuts projected in October and December—reduces the opportunity cost of holding non-yielding Gold. This has fuelled demand for the safe-haven asset.
Meanwhile, Middle East risks have eased slightly after Israel and Hamas signed the first phase of the Trump peace plan, but broader uncertainty in global politics (US, EU fiscal tensions, Japan’s leadership changes) keeps safe-haven flows active. Thus, any dips are likely to attract strong buyers.
🔑 Key Technical Levels
Resistance: $4,121 / $4,133
Support: $4,002 / $3,988
📌 Trade Summary
Gold continues to ride strong bullish momentum, supported by dovish Fed expectations and political uncertainties. Buying near support levels remains favoured, with targets set at $4,121 and $4,135. Pullbacks should be seen as opportunities to rejoin the uptrend.
⚠️ Disclaimer
This analysis is for reference only and does not constitute trading advice. Trading involves significant risk, and proper risk management is essential.

10/8: Watch Resistance at 4050, Short First Then Go LongGood afternoon, everyone!
Driven by global economic and geopolitical uncertainties, as well as strong market expectations for further Fed rate cuts, gold has surged past the 4000 mark today, setting a new all-time high.
From a weekly perspective, the bullish momentum remains intact, and the uptrend still has room to extend. In the short term, some profit-taking and selling pressure after reaching new highs are normal technical corrections.
If the price climbs to the 4040–4050 range, pay close attention to the 4010 level as potential support during any pullback. If gold trades below 4030, the main support area can be referenced around 4000–3986.
Overall, the medium-term outlook remains bullish. For intraday trading, consider a buy-low, sell-high approach within the 4050–4011 or 4030–3992 range. However, if the price breaks above 4050 decisively, avoid chasing longs and instead look for potential short opportunities.

10/9: Sell Orders Above 4050 Profited, Watch Support Around 4000In yesterday’s session, we clearly indicated that if gold breaks above 4050, traders should look for short opportunities — and this move has indeed delivered impressive profits.
At present, the price is testing the 30-minute chart support area, though it is relatively weak. The key support zone lies on the 1-hour chart, around 4000–3990.
From a strategic perspective, if the rebound fails to break above 4038, it signals weakening bullish momentum. In this case, selling near the highs remains the preferred approach while monitoring support around 4011–4000. If the support holds, short-term buying opportunities may arise.
Be cautious when heavy selling pressure appears — close short-term positions promptly. Traders may choose to adopt a scalping approach for quick profits or consider a medium-term long position, though the latter requires stronger account capacity and risk tolerance.

ElDoradoFx PREMIUM 2.0 - (09/10/2025, Asia Session)Current Price: 4,041
Session Bias: Neutral-to-bullish (possible continuation if 4,031 holds)
Market Structure: Gold consolidating after major rally, forming a potential re-accumulation phase inside an ascending channel.
⸻
🕐 1️⃣ DAILY TIMEFRAME (D1)
• The daily candle closed bullish but with a long upper wick, showing rejection near 4,059.
• Structure remains firmly bullish, with price holding well above both EMAs:
• 20 EMA: 3,978
• 50 EMA: 3,867
• MACD still positive, histogram extended but flattening → momentum slowing.
• RSI at 78, signaling overbought conditions.
• Parabolic SAR remains below price → trend intact.
Summary:
The daily trend remains bullish, but a short-term consolidation or correction is likely before a new leg higher toward 4,070–4,090.
⸻
⏱ 2️⃣ H1 TIMEFRAME
• Gold is moving inside an ascending channel, currently holding mid-range.
• Support area between 4,033–4,018; resistance around 4,047–4,059.
• The latest candles show lower highs forming, signaling potential temporary compression before breakout.
• MACD histogram slightly negative, confirming minor correction mode.
• RSI at 54 → neutral, suggesting possible bounce from support if buyers defend structure.
• The 20 EMA (4,039) and 50 EMA (3,985) remain bullishly aligned → trend still intact.
Observation:
Asia could open with consolidation between 4,030–4,050 before a breakout. Bulls will likely defend the 4,033–4,018 zone for a re-entry attempt.
⸻
📉 3️⃣ M15 TIMEFRAME
• Price building a descending wedge structure — typically a bullish continuation pattern.
• Immediate support: 4,033–4,030
• Resistance: 4,047–4,051 (weak high)
• Fibonacci retracement from 3,984 → 4,059:
• 38.2% = 4,032
• 50% = 4,021
• 61.8% = 4,010
➤ Golden Zone = 4,032 – 4,010
• MACD histogram red but contracting — bears losing pressure.
• RSI at 47, near mid-level → awaiting a confirmed impulse.
Summary:
The wedge plus golden zone suggest a potential bullish rebound if Asia session liquidity sweeps below 4,030–4,018 and reclaims above 4,033.
⸻
⚡ 4️⃣ M5 TIMEFRAME (SCALPING STRUCTURE)
• Market is ranging 4,032–4,046, inside compression.
• Minor CHoCH and BOS signals visible between candles, confirming short-term equilibrium.
• MACD showing convergence → early sign of potential breakout build-up.
• RSI around 48 → balanced.
Scalping Areas:
• Buy scalp: from 4,033–4,028, confirmation candle close above 4,035, SL ≤ 60 pips.
• Sell scalp: only if clean break below 4,018, retest, and rejection candle appears.
⸻
✨ FIBONACCI GOLDEN ZONE (Current Swing: 3,984 → 4,059)
Retracement Level Price
38.2% 4,032
50% 4,021
61.8% 4,010
➡️ Golden Zone = 4,032 – 4,010 → Primary buy interest area if retested with bullish confirmation.
⸻
🚨 BREAKOUT & RETEST LEVELS TO WATCH
Direction Breakout Zone Retest Confirmation Target Zones
Bullish Above 4,051–4,059 Retest 4,047–4,050 4,066 → 4,072 → 4,085
Bearish Below 4,018–4,010 Retest 4,014–4,016 4,000 → 3,990 → 3,970
⸻
🧭 ASIA SESSION OUTLOOK
• Base Case (65% probability):
Gold remains in consolidation early Asia, possibly sweeping 4,030–4,018 (Golden Zone) before resuming upward movement to 4,060–4,072.
• Alternative (25% probability):
Extended sideways compression 4,030–4,050 until London.
• Low Probability (10%):
Strong bearish break below 4,010 leading to deeper correction 3,990–3,970.
⸻
✅ SUMMARY
Gold remains bullish overall, but currently accumulating near intraday support after rejection at 4,059.
Asia is expected to be range-bound with a bullish bias, focusing on:
• Buy interest zone: 4,032–4,010 (Golden Zone)
• Breakout confirmation: above 4,051 for 4,060–4,072 extension.
• Invalidation: below 4,010 structure.
Bias: 🟢 Bullish above 4,018
⚪ Neutral 4,018–4,010
🔴 Bearish below 4,010
⸻
🥇 ElDoradoFx PREMIUM 2.0 – PERFORMANCE 08/10/2025 📱
📊 DAILY MARKET RESULTS
✅ SELL +60 pips
✅ BUY +20 pips
✅ BUY +40 pips
💸 BTC/USD +1,700 pips
✅ SELL +110 pips
✅ BUY +20 pips
❌ SELL –40 pips (SL)
✅ BUY +210 pips
❌ SELL –40 pips (SL)
✅ BUY LIMIT +40 pips
---
🏆 GOLD TOTAL PIPS WON: +420 pips
📱 BTC/USD TOTAL: +1,700 pips
📈 COMBINED GAIN: +2,120 pips
📊 RESULT: 10 Signals → 8 Wins | 2 SL
🎯 ACCURACY: 80 %
---
🔥 Solid day of profits with powerful BTC moves and consistent gold trades!
Another step toward closing the week in style 💪📈
👏 Congratulations if you profited ✅✅✅🚀🚀🚀
