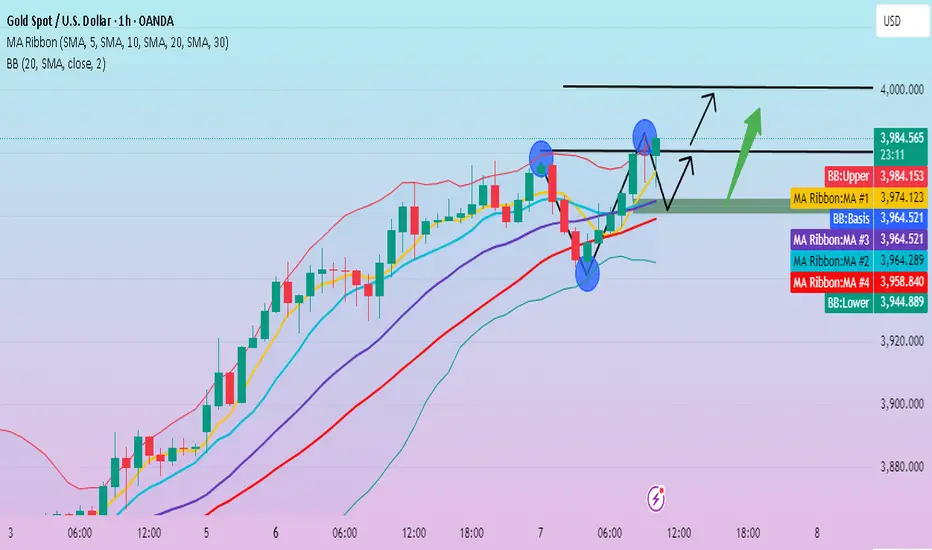
Gold faces a correction. Latest analysis.Analysts at Rabobank stated in a report that while threats to the Federal Reserve's independence have diminished the dollar's luster, it remains a major safe-haven asset, along with gold. The recent rise in gold prices has raised questions about the dollar's role as a safe-haven asset, she said. While the dollar faces risks, the depth of the US capital market means investors will be reluctant to abandon the greenback if geopolitical risks intensify.
Gold experienced a volatile upward trend on Wednesday, stabilizing above 3985 before gradually rising, reaching a high of 4060 before retracing. Gold bulls are performing very strongly and are currently experiencing a volatile adjustment. If gold continues to rise, there is further room for growth. The lower support level will focus on around 4020, and further downward support will focus on the defensive price of $4,000. If the correction falls below 4,000, it means that the degree of retracement will be large, so stop loss in time and wait for the retracement to be completed.
Overall, Quaid believes that gold remains in a bullish trend, and despite a minor correction, it is not yet over. Focus on the strong resistance range of 4050-4080 on the upside, and the support range of 4020-4000 on the downside.
Trading Strategy:
Place long orders in batches on a pullback to 4020-4010, with a stop-loss at 4000. Profitable range: 4050-4060-4080.
Xauusdsignal

Gold’s Swings Offer Bears a Profitable EdgeGold has currently reached a high of around 4050, but after reaching this area, the upward trend has been suppressed, and the upward momentum has weakened. Gold needs to retreat in the short term. Gold is currently under pressure in the 4050-4060 area. If gold shows obvious signs of stagflation in this area, then gold may usher in a good pullback at any time.
However, because gold is currently in a strong upward trend, its structure and form are in an obvious bullish trend. Therefore, even if the gold market pulls back, the pullback is not expected to be too large in the short term. We should first focus on the support area below, 4000-3990.
Therefore, in volatile markets, even if gold is in a strong bullish trend, gold shorts still have good profit opportunities due to volatility. So in the short term, we can consider trying to short gold in the 4050-4060 area, first aiming at the target area: 4010-4000 area.
If you're short gold like me, we must be among the first to reap the benefits of a market correction. If you'd like to continue following my trading strategies and signals, be sure to follow me!

Gold: Continue its rally to reach an all-time highGold has successfully stood firm above the key psychological level of 4000, continuing its rally to reach an all-time high. From the perspective of capital flows, although specific position data is lacking, the price-volume surge following the breakthrough,evidenced by both New York Gold and London Gold recording "rising prices with increasing trading volume" that confirms the continuous inflow of safe-haven funds. Additionally, the seasonal upward momentum of gold in October has not yet faded, and the momentum-driven uptrend continues, further strengthening the confidence of bullish investors.
The 4000-4050 range has been effectively broken through, and this former resistance level has now transformed into a short-term support level. If gold can maintain a stable position above 4050 in the subsequent sessions, the next target range can be set at 4100-4150. For short-term support, focus on the key psychological level of 4000; a breakdown below this level may trigger a pullback to the 3950-3980 range.
Buy 4010 - 4020 TP 4030 - 4040 - 4050
Daily-updated accurate signals are at your disposal. If you run into any problems while trading, these signals serve as a reliable reference—don’t hesitate to use them! I truly hope they bring you significant assistance

Gold: Reach a new highGold has successfully stood firm above the key psychological level of 4000, continuing its rally to reach an all-time high. From the perspective of capital flows, although specific position data is lacking, the price-volume surge following the breakthrough,evidenced by both New York Gold and London Gold recording "rising prices with increasing trading volume" that confirms the continuous inflow of safe-haven funds. Additionally, the seasonal upward momentum of gold in October has not yet faded, and the momentum-driven uptrend continues, further strengthening the confidence of bullish investors.
The 4000-4050 range has been effectively broken through, and this former resistance level has now transformed into a short-term support level. If gold can maintain a stable position above 4050 in the subsequent sessions, the next target range can be set at 4100-4150. For short-term support, focus on the key psychological level of 4000; a breakdown below this level may trigger a pullback to the 3950-3980 range.
Buy 4010 - 4020 TP 4030 - 4040 - 4050 SL 4000
Daily-updated accurate signals are at your disposal. If you run into any problems while trading, these signals serve as a reliable reference—don’t hesitate to use them! I truly hope they bring you significant assistance

4050-4030 oscillation, bullish trend remains the main trendGold is currently still in a bullish upward trend. Our core trading strategy remains unchanged, and the key points I reminded you of earlier this morning must be carefully considered. Judging from the trend, gold in the US market is basically oscillating back and forth in the range of 4050-4030. I mentioned before that gold has repeatedly tested 4030. Once it falls below, gold may test the support range of 4020-4010 below in the US market. This has been marked in the chart. I believe brothers can see it very clearly. At the same time, we should still take precautions on the upside. As time goes by, we can pay moderate attention to the short-term channel pressure around 4065. Once gold stabilizes above 4050, it will definitely touch around 4065. On the downside, we continue to monitor a break of 4030. If, while waiting for gold to fall back to the support range, it first rises and hits the channel resistance, you can retest gold shorts based on market trends. If you have any questions, you can leave me a message for help. If you think Allen's analysis is helpful to you, you can give it some encouragement by clicking the like button.

ANFIBO | XAUUSD - Buy and Win [10.8.2025]Hi traders, Anfibo's here!
XAUUSD Analysis – Daily Trading Plan
Technical Outlook:
> SUPPORT KEY / BUY ZONES : 4026 - 4000 - 3942 - 3926 - 3909 - 3900 - 3890
> RESISTANCE KEY / SELL ZONES : 4086 - 4139
Trading Plan for Today:
>>> SELL ZONE:
ENTRY: 4082 - 4092
SL: 4102
TP: 4026 - 4000 - 3942 - 3926
>>> BUY ZONE:
(1) ENTRY: 4025 - 4027
SL: 4019
TP: 4086 - 4139 - ATH
(2) ENTRY: 3885 - 3900
SL: 3880
TP: 3940 - 3970 - 3995 - ...
Risk Management:
- Maintain a minimum Risk:Reward ratio of 1:2.
- Manage position sizing carefully; avoid overtrading at psychological highs.
- Monitor U.S. economic data and geopolitical news closely, as these could act as catalysts for corrective moves.

Gold is strong. There is no way to guess the high point.Gold's strong upward trend continues. As prices climb, fluctuations are increasing, but the overall trend is very clear. Upside potential has opened up, and the magnitude is even greater than expected, with a very sharp upward trend.
On Wednesday, gold prices held steady at the 4,000 mark. Previous predictions suggested that a break above 4,000 would open up further upside potential. The current trend is in line with expectations, and the peak is nowhere in sight. There will most likely be a small adjustment after the rise, but you just need to follow the market trend and continue to adhere to the principle of following the trend.
On the 4-hour chart, the price is currently range-bound and correcting at a high level, but the K-line remains relatively strong above the short-term moving average. This kind of trend has appeared many times recently, and the strength of the sideways fluctuation and pullback after the rise is not strong. It is highly likely that gold will continue to rise in the 4-hour trend. The only caveat is that the Federal Reserve meeting minutes may bring some uncertainty to the market.
Trading strategy:
Buy near 4035, stop loss at 4025, profit range: 4060-4080.
Gold Trade Set Up Oct 8 2025Price has pushed well above PDH and created a new ATH once again so as long as the 15m support holds i will be looking for a BOS on the 15m and retest into a 5m/15m demand to take buys higher
www.tradingview.com

ElDoradoFx PREMIUM 2.0 – US FORECAST (08/10/2025)Session Bias: Bullish continuation with controlled pullback probability
Market Structure: Still within ascending channel; bulls defending structure after rejection at 4,049
⸻
🕐 1️⃣ DAILY TIMEFRAME (D1)
• Gold continues its aggressive uptrend, with another bullish daily candle extending from 3,983 to 4,049.
• Price remains above 20 EMA (3,975) and 50 EMA (3,867) → strong bullish trend confirmation.
• RSI at 79 → extremely overbought, suggesting limited room before a short-term correction.
• MACD histogram still expanding positively, showing momentum remains active despite exhaustion risk.
• Parabolic SAR stays below price → trend intact.
Summary:
Gold is overextended but structurally bullish. As long as daily candle holds above 4,000, buyers remain in control aiming for 4,060–4,078.
⸻
⏱ 2️⃣ H1 TIMEFRAME
• Gold hit 4,049 (Weak High) and is now consolidating around 4,040–4,043, holding above short-term structure support at 4,031.
• Price remains above 20 EMA (4,031) and 50 EMA (3,984) — EMAs sharply aligned upward.
• MACD: histogram showing fading bullish momentum, though still above zero → healthy pullback possible.
• RSI (70) hovering near overbought → suggests cooling off before potential continuation.
• Channel Structure: price rejected top trendline (red), possibly retracing toward midline support 4,031–4,020.
Observation:
If 4,031–4,020 holds, we may see a continuation leg toward 4,060–4,078.
A break below 4,018 would shift short-term momentum bearish toward 4,004.
⸻
📉 3️⃣ M15 TIMEFRAME
• The intraday structure remains bullish; however, candles are printing smaller bodies → indicating exhaustion.
• Fibonacci retracement from 3,984 → 4,049:
• 38.2% = 4,024
• 50% = 4,017
• 61.8% = 4,010
→ forming a Golden Zone (4,024–4,010) — ideal pullback area for re-entry if the bullish trend resumes.
• MACD showing a flattening histogram → potential retrace before next impulse.
• RSI at 61 → mid-range, ready for either a dip or rebound depending on 4,031 support reaction.
Summary:
A healthy retracement toward 4,024–4,010 is expected. As long as the golden zone holds, trend continuation remains the main scenario.
⸻
⚡ 4️⃣ M5 TIMEFRAME (SCALPING VIEW)
• Price formed a minor double top at 4,049 and retraced to 4,033, currently ranging between 4,030–4,044.
• 20 EMA starting to flatten, while 50 EMA remains below → short-term correction developing.
• MACD histogram in red but narrowing → bears weakening as we approach support.
• RSI 48 → neutral, suggesting accumulation zone forming for next move.
Scalping Summary:
• Buy scalp zone: 4,031–4,024 (confirmation required)
• Sell scalp zone: below 4,018 (breakout and retest) → potential drop to 4,004–3,992
⸻
✨ FIBONACCI GOLDEN ZONE (Current Swing: 3,984 → 4,049)
Retracement Level Price
38.2% 4,024
50% 4,017
61.8% 4,010
Golden Zone = 4,024 – 4,010 → key support & re-entry area.
⸻
🚨 BREAKOUT LEVELS TO WATCH
Direction Breakout Zone Retest Confirmation Target Zones
Bullish Above 4,049–4,050 Retest 4,045–4,047 4,060 → 4,072 → 4,085
Bearish Below 4,018–4,010 Retest 4,015–4,012 4,004 → 3,992 → 3,970
⸻
📊 INDICATORS SUMMARY
Indicator Reading Bias
RSI (H1) 70 (Overbought) ⚠ Cooling phase
MACD (H1) Positive, flattening ✅ Still bullish
EMAs (20/50) Rising, wide gap ✅ Trend intact
Volume Normalizing ⚠ Pre-news pause
Parabolic SAR Below price ✅ Trend supportive
⸻
🧭 SESSION OUTLOOK (US SESSION)
• Base Case (60% probability):
Controlled pullback toward 4,024–4,010 (Golden Zone) before continuation to 4,060–4,078.
• Alternative (30% probability):
Extended range between 4,030–4,049 with sideways consolidation.
• Low Probability (10%):
Breakdown below 4,010 → deeper correction to 3,990–3,970.
⸻
✅ SUMMARY
Gold remains bullish overall, but short-term momentum is softening after reaching 4,049 resistance.
A pullback into 4,024–4,010 (Golden Zone) is the ideal setup for bullish continuation.
As long as price holds above 4,018, trend bias stays upward;
only a confirmed breakdown below 4,010 would signal short-term bearish correction.
Bias: 🟢 Bullish above 4,018
⚪ Neutral 4,018–4,010
🔴 Bearish below 4,010
⸻

Gold Analysis (XAUUSD) | 1H Timeframe
🔹 Current Status: Gold is aggressively breaking new highs and showing strong bullish moves. This suggests that we might be experiencing the best year for gold in several decades.
🔹 Scenario 1: If the price reaches 3,840 and 3,860 levels, there’s a possibility of a pullback to lower green areas (around 3,700 or 3,680). These green zones can be ideal for entering long positions with lower risk.
🔹 Scenario 2: If the price swiftly breaks through the higher levels and moves further up, it might indicate the continuation of the bullish trend. In this case, look for long positions on lower timeframes (such as 5 minutes) with confirmation from candlestick patterns and price action.
🔹 Key Points:
The price is breaking new highs and continuing the bullish trend.
Look for long positions in lower timeframes in the green zones for confirmation.
Enter long near 3,700 and 3,680 with low risk.

Gold has no high. Latest Analysis.Since the beginning of the year, driven by global trade tensions, market doubts about the Federal Reserve's independence and policy path, and ongoing concerns about the health of the US fiscal system, international gold prices have surged over 50%, breaking through the $4,000 per ounce mark for the first time in history.
Delays in US economic data due to the risk of a government shutdown have further exacerbated market uncertainty, adding fuel to gold's surging rally.
Technically, gold prices maintain a stable bullish pattern on the daily chart. Although showing signs of fatigue after consecutive surges, no top has been signaled. The 1-hour chart shows that gold prices are moving higher amidst volatility. Any pullback will likely find buying support at key support levels, maintaining the short-term upward trend.
The 4-hour chart shows that although the RSI indicator has entered overbought territory, suggesting the risk of a pullback, prices remain firmly above all moving averages. The bullish alignment of the moving averages provides solid technical support for the upside.
Looking back at Tuesday's performance, the market has demonstrated strong resilience after reaching a record high. The price of gold surged and then fell back to test the support below, and then rebounded quickly. This clearly demonstrates the strong demand for bargain-hunting in the current market.
Overall, the overall upward trend in gold prices remains solid. In terms of operating strategy, it is recommended to arrange long orders after a callback. In the short term, focus on the resistance level of 4040. If it is successfully broken, resistance will shift to the 4050-4070 range. The short-term support below will first focus on the $4020 to $4010 support, and the more critical defensive level is around $4000. Any pullback toward this support area could provide an opportunity for a new round of long entry.
$4000: New Record! Correction Warning & FVG Strategy.Hello, traders!
Gold officially set a New Record by breaching the $4,000/oz mark, hitting a peak of $4,014.60/oz. Although there was an immediate pullback after hitting this psychological level, the rally remains strongly supported by:
Fundamentals & Market Conflict
Main Drivers: Expectations for two more Fed rate cuts this year (FOMC Minutes tonight are key), coupled with central bank diversification and record ETF inflows ($64B) driven by global instability and inflation fears.
Reversal Warning: Bank of America (BoA) warns that Gold is facing "trend exhaustion," which could lead to a consolidation or correction in Q4.
Technical Analysis & Clear Strategy Direction
The price was rejected at $4000, leading to a local correction. However, the overall trend remains very strong and bullish. The safest strategy is to wait for a BUY at potential support zones.
Priority Bias: BUY (Long) on Dips towards FVG (Fair Value Gap) zones to capitalize on the main trend's momentum. Limit SELL attempts unless using extremely tight SL.
Key Price Levels:
Resistance: $4044, $4054, $4064
Support: $4018, $3999, $3986
Trading Strategy (Prioritize BUY on Dips)
BUY ZONE (FVG): $3994 - $3992
SL: $3984
TPs: $4002, $4012, $4022, $4032, $4042
SELL ZONE (High Risk): $4065 - $4067
SL: $4075
TPs: $4057, $4047, $4037, $4027, $4017
Do you believe BoA's warning, or will the FOMC Minutes break $4050? 👇
#Gold #XAUUSD #4000USD #ATH #Fed #FOMC #TradingView #BUYDIPS

ElDoradoFx PREMIUM 2.0 – LONDON FORECAST (08/10/2025)Current Price: 4,035
Session Bias: Bullish with short-term correction potential
Market Structure: Continuation within ascending channel — bulls still dominant, but slowing momentum after reaching 4,037
⸻
🕐 1️⃣ DAILY TIMEFRAME (D1)
• Gold continues its parabolic rise, forming consecutive bullish candles since 3,940 breakout.
• Price reached 4,037, the highest level since August 2020 equivalent, before consolidating.
• 20 EMA (3,971) and 50 EMA (3,867) both trending sharply upward → strong trend momentum.
• RSI at 78, showing overbought territory → potential short-term pullback.
• Parabolic SAR below price → trend intact.
Summary:
Uptrend fully intact. A pullback toward 3,990–3,970 is possible before continuation toward 4,050+.
⸻
⏱ 2️⃣ H1 TIMEFRAME
• Price trading within an ascending channel; current range 4,015–4,037.
• Higher highs and higher lows still forming — structure unbroken.
• 20 EMA = 4,018 / 50 EMA = 3,984 → clear bullish separation.
• MACD shows fading histogram but above zero line → losing momentum, not reversal.
• RSI 65 → cooling from overbought zone.
• Volume decreasing → Asian range likely transitioning into London volatility.
Key Observation:
A retest of 4,018–4,015 (previous BOS area) may serve as next buy opportunity.
⸻
📉 3️⃣ M15 TIMEFRAME
• Recent swing high at 4,037, followed by minor pullback to 4,020–4,024 support zone.
• EMA confluence and previous CHoCH confirm bullish structure remains.
• Fibonacci retracement from 3,984 → 4,037 gives:
• 38.2% = 4,017
• 50% = 4,010
• 61.8% = 4,004
→ This forms the Golden Zone (4,017–4,004) — ideal for long re-entries.
• MACD histogram returning to equilibrium → preparing for next leg.
• RSI 55 → neutral, confirming potential continuation.
Summary:
Watch for retest of 4,017–4,004 → key support zone to reload longs before any breakout attempt above 4,037.
⸻
⚡ 4️⃣ M5 TIMEFRAME (SCALPING STRUCTURE)
• Price rejected 4,037, retracing toward 4,024–4,020 with MACD histogram turning red.
• Short-term bearish divergence seen on RSI but minimal strength.
• As long as price holds above 4,018, buyers remain in control.
• If 4,018 breaks, next liquidity zone lies at 4,010–4,005 (Golden Zone base).
Scalping Summary:
• Aggressive scalpers can look for buy scalps between 4,018–4,010 with 60-pip risk window.
• Short-term exhaustion likely followed by bullish continuation.
⸻
✨ FIBONACCI GOLDEN ZONE (CURRENT MOVE: 3,984 → 4,037)
Retracement Level Price
38.2% 4,017
50% 4,010
61.8% 4,004
Golden Zone = 4,017 – 4,004 → Key intraday buy area.
⸻
🚨 BREAKOUT LEVELS TO WATCH
Direction Breakout Zone Retest Confirmation Target Zones
Bullish Above 4,037–4,040 Retest 4,033–4,035 4,050 → 4,060 → 4,078
Bearish Below 4,018–4,010 Retest 4,015 4,004 → 3,990 → 3,970
⸻
🧭 SESSION OUTLOOK
• Base Case (60% probability):
Minor pullback to 4,018–4,010 (Golden Zone) followed by bullish continuation toward 4,037–4,050.
• Alternative (30% probability):
Range between 4,020–4,037 before breakout continuation in New York session.
• Low Probability (10%):
Drop below 4,004 leading to correction into 3,990–3,970.
⸻
✅ SUMMARY
Gold remains in a strong uptrend, consolidating near the top of its ascending channel.
A healthy pullback toward 4,018–4,010 (Golden Zone) could offer fresh bullish continuation opportunities.
Momentum is softening but trend structure remains intact.
Only a clean break below 4,004 would indicate deeper correction risk.
Bias: 🟢 Bullish above 4,010
⚪ Neutral between 4,010–4,004
🔴 Bearish only below 4,004
⸻
🥇 ElDoradoFx PREMIUM 2.0 – PERFORMANCE 07/10/2025 💸
📊 MARKET RECAP
✅ BUY +20 pips
✅ BUY +20 pips
✅ SELL +110 pips
✅ SELL +60 pips
✅ BUY LIMIT +210 pips
🔽 SELL – BE
✅ BUY +40 pips
✅ BUY +20 pips
💸 BTC/USD BUY +800 pips
---
🏆 GOLD TOTAL PIPS WON: +480 pips
💰 BTC/USD TOTAL: +800 pips
📈 COMBINED GAIN: +1,280 pips
📊 RESULT: 9 Signals → 8 Wins | 1 BE
🎯 ACCURACY: 89 %
---
🔥 Another strong performance across Gold & BTC!
Precision entries, layered accuracy, and massive profits 🚀
👏 Congratulations if you profited ✅✅✅🚀🚀🚀

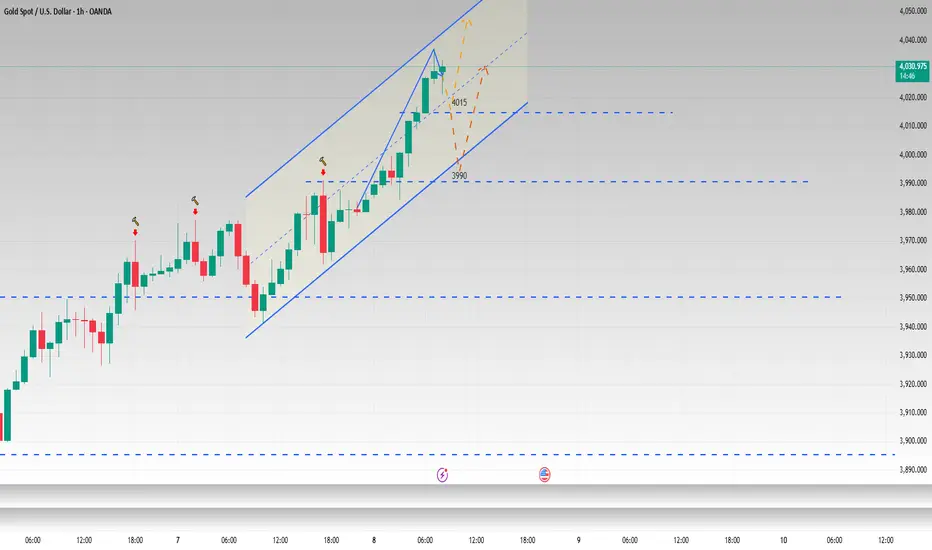
4015 can go long, 3990 is bullish if not brokenAs expected, gold continued its strong upward momentum, breaking through the 4,000 mark in the Asian session and nearly reaching 4,040. But from the news point of view, gold has now come to a critical moment. According to information revealed by U.S. Senator John Thune, the Senate will vote again on two short-term appropriations bills on the 8th and discuss the progress of the government shutdown. This will be the Senate's sixth attempt to pass a temporary spending bill to end the federal government shutdown. The previous government shutdown sparked market panic, leading many investors to flock to the gold market. If the government can be reopened this time, it will effectively alleviate risk aversion and cause gold prices to correct. On the contrary, the impact of continued closures and geopolitical factors may even cause gold to rise again.
Judging from the current gold trend, a new upward channel has been formed. Our trading strategy still focuses on long gold and short gold as a supplement. Then we should first focus on the small support of 4015-4010. When it falls back to here for the first time, we can try to go long with a light position. If it breaks, stop loss in time and pay attention to the important support of 4000-3900 to go long on gold. But it is worth noting that we must be wary of the possible rise and fall of gold today. The first reason is whether the US government shutdown issue can be resolved. The second reason is that China’s holiday is about to end. As a major gold holder, once it returns, the impact on the market will definitely be significant. On the upside, focus on the channel resistance level of 4050-4060. If gold rises near this resistance level, consider shorting it appropriately based on market conditions.
For more real-time updates, please follow my profile
"Gold 'Buy the Dip' Opportunity Targeting the $4,000 Level"
Technical Analysis
This is a classic bullish continuation setup. Here's a breakdown of the key elements:
Prevailing Trend: The chart shows a strong bullish impulse wave, indicated by the series of large green candles. This establishes the short-term trend as upward.
Corrective Pullback: After reaching a local high (around $3,980), the price is currently in a corrective phase, pulling back towards a potential support level. This is normal and healthy price action in an uptrend.
Support Zone: The red rectangle you've highlighted from approximately $3,950.00 to $3,956.00 is a well-defined area of potential support. This zone represents a previous level of consolidation and the base of the last major push upwards, making it a likely area for buyers to step back in.
Trade Idea: The projected path you have drawn suggests an expectation that the price will dip into this support zone, find buying pressure, and then continue its upward trajectory. This is often referred to as a "buy the dip" strategy.

XAUUSD – No FOMO, No ProblemSince the beginning of October, I’ve argued that a correction in Gold should be next.
However, the market had other plans — this view didn’t materialize, and my three short trades ended with one winner, one break-even, and one stop loss, a big 0 overall...
So, am I upset for missing a 2,000-pip rally? Not at all.
This was a test of acceptance and a reminder that trading correctly matters more than catching every move.
Gold will still be here tomorrow — and if I don’t truly believe in a setup, there’s no reason to enter.
Technically speaking, Gold remains extremely bullish, but every move, no matter how strong, has an end somewhere.
Whether that top comes at 4050, 4100, or even 5000, no one can say with certainty.
For me, it’s simple:
If I don’t have a trade aligned with my conviction, I don’t trade.
As long as the upward channel remains intact, the trend stays bullish.
The key support is now around $4,000, and it will be interesting to see whether this level holds or if Gold will finally enter the much-needed correction phase.
For now, I stay out.
I don’t chase moves I don’t understand, and I don’t FOMO.
Call it caution, or even stupidit y — but a rise without correction is something I simply don’t trust. 🟡

8/10/68 : XAUUSD ( Europe / London Session )Using it from Europe Session until 7.00PM , I'll new analysis and update at 8.00PM
Resistance
4046-4051
4036-4041
4031
Support
4020
4010-4015
4000-4005

Gold Feast. Ending Time?Gold Feast. Ending Time?
During Wednesday's Asian session, gold reached Quaid's predicted level, breaking through the 4,000 mark and continuing its strong upward trend.
Gold has now reached a critical juncture. Not only is time, but also space and current news factors could lead to a reversal.
According to US Congressional news, US Senate Majority Leader and Republican Senator John Thune stated that the Senate will vote again on two short-term appropriations bills on the 8th. He revealed that some members of both parties met for dinner that evening to discuss the government shutdown progress, but did not provide further details. This will be the Senate's sixth attempt to pass a temporary spending bill to end the federal government shutdown;
Judging from the current chart, after each period of high point, there will be a retracement correction.
The amplitude of the callback determines where the exact high point will appear. Based on Tuesday's trend, there are several retracement lows: 3940, 3960, and 3970. Quaid believes that if gold experiences a correction, it will only retrace to these levels.
Based on the maximum retracement level of 3970, the high point is approximately around 4040, which is also the current estimated maximum level. If the price retraces to around 3940, the high point will be around 4020.The location of the high point requires a short period of observation to verify.
The location of the high point requires a short period of observation to verify. Everyone should pay close attention to the appearance of the high point. After a small short position at the high point, wait for the price to fall back and continue to go long.

Still Bullish on Gold.Gold has broke $4,000... I extended the regression channel lines and it is still trading within our trend. Expected TP is $4050 provided the momentum stays bullish throughout the week; then wait for a new entry.
Use trailing stop losses to manage position and secure some profits incase of reversals.

ElDoradoFx PREMIUM 2.0 – ASIAN FORECAST (08/10/2025)Gold closed the US session around 3,981, consolidating within a narrow range after a strong impulsive move from 3,946 → 3,991.
The pair continues to show bullish structure on all major timeframes, but with signs of momentum fatigue at current highs.
Asian session likely to provide either a minor correction or accumulation phase before next directional move during London.
⸻
📊 1️⃣ DAILY TIMEFRAME (D1)
• Structure: Strong bullish continuation since breaking out above 3,866 (last week’s BOS).
• EMAs: Price trading well above the 20 EMA (3,918) and 50 EMA (3,837) → showing strong trend control by buyers.
• RSI: 77 → overbought, risk of a short-term correction before further upside.
• Parabolic SAR: Still below price, confirming uptrend intact.
• Immediate resistance: 3,991–4,000 (psychological zone)
• Key support: 3,918–3,914
🔹 Bias: Trend remains bullish, but watch for exhaustion near 4,000. A corrective pullback toward 3,965–3,940 would be healthy for continuation.
⸻
📉 2️⃣ 1H TIMEFRAME (H1)
• Price trading in a rising channel, currently at upper boundary (~3,981).
• Previous BOS confirmed at 3,965, turning that area into dynamic support.
• EMAs 20/50 (3,970–3,961) acting as intraday support band.
• MACD histogram slightly fading → momentum cooling, but still positive.
• RSI 64 → neutral, providing space for another push higher if buyers defend supports.
• Structure forming potential ascending triangle → breakout may target 3,991 → 4,000 zone.
🔹 Bias: Bullish above 3,961, neutral between 3,961–3,946, bearish only below 3,946.
⸻
⏱ 3️⃣ 15M TIMEFRAME (M15)
• Clear liquidity sweep below 3,961 earlier, followed by a Change of Character (CHoCH) to bullish.
• Price forming higher lows, consolidating between 3,977–3,982 → tight compression before breakout.
• MACD recovering from minor bearish phase, RSI 58 → modest bullish pressure.
• EMAs crossing upward again, aligning with structure support at 3,973–3,970.
🔹 Expect accumulation within 3,973–3,982 before breakout confirmation.
⸻
📈 4️⃣ 5M TIMEFRAME (M5 – Scalping Focus)
• Micro-structure: short-term consolidation with support at 3,970 and resistance at 3,983.
• Momentum: MACD showing flattening histogram, RSI neutral (~52) → potential low-volume Asian range.
• EMAs flatlining → ideal setup for scalpers awaiting breakout or pullback to golden zone.
⸻
✨ FIBONACCI GOLDEN ZONE (SHORT-TERM)
Measured from 3,946 (swing low) → 3,991 (swing high):
• 38.2% = 3,974
• 50% = 3,968
• 61.8% = 3,962
🔸 This forms the Golden Zone = 3,974–3,962 — high-probability buy reaction area if tested.
Aligns with trendline + EMA support, increasing confluence.
⸻
🚨 BREAKOUT LEVELS TO WATCH
Direction Breakout Zone Retest Confirmation Target Zones
Bullish Above 3,983–3,985 Retest 3,980–3,982 3,991 → 4,000 → 4,015
Bearish Below 3,961–3,958 Retest 3,962–3,965 3,946 → 3,940 → 3,927
⸻
🧭 ASIAN SESSION OUTLOOK
• Base Case (60% probability):
Sideways-to-slightly bullish consolidation above 3,970 ahead of London volatility.
Price likely to respect Golden Zone (3,974–3,962) before continuation.
• Alternative (30% probability):
Brief dip into 3,958–3,946 liquidity pocket before strong bounce upward.
• Low Probability (10%):
Sustained bearish breakdown below 3,946, invalidating intraday uptrend.
⸻
📊 SUMMARY
• Gold remains in a strong bullish uptrend, consolidating near the top of the channel.
• 3,974–3,962 (Golden Zone) remains key area for buyers to defend.
• Breakout above 3,985 will confirm continuation toward 4,000–4,015.
• Only a confirmed drop below 3,946 shifts structure bearish short term.
Bias for Asian Session:
🟢 Bullish above 3,962
⚪ Neutral between 3,962–3,946
🔴 Bearish below 3,946
⸻
🟡 Conclusion:
Expect calm range trading during Asia with bullish continuation probability if 3,970–3,962 holds.
Aggressive moves likely resume in London session.
Overall structure and indicators favor dip accumulation rather than shorting.
⸻
GOLD (XAU/USD) TECHNICAL ANALYSIS — BUY SETUP FROM SUPPORT ZONEPair: Gold (XAU/USD)
Timeframe: 1H
Current Price: 3985.23
Trend: Bullish channel (ascending)
📊 Chart Structure Analysis
Ascending Channel:
Gold has been moving in a well-defined upward channel (highlighted in pink).
The price recently touched the upper boundary, suggesting a possible short-term pullback.
Support Zone (Blue Area):
Around 3870–3880, identified as the support level.
This area has confluence with the midline of the channel, making it a potential buy zone.
Entry Point:
Marked at 3871.28 — ideally at or slightly above the support region after a pullback.
Stop Loss:
3857.81, just below the support zone.
This protects against a channel breakdown.
Target Point:
4017–4018, which aligns with the upper resistance or projected extension of the bullish channel.
This gives a reward-to-risk ratio > 3:1, which is favorable.
🔍 Price Action Expectation
Price is expected to retest the blue support zone (possibly after a minor drop).
If it holds, a bounce upward toward 4017–4020 is anticipated.
A break below 3857 would invalidate the bullish setup and open the path to 3820 or lower.
✅ Summary
Parameter Level (USD) Notes
Entry 3,871 Near support
Stop Loss 3,857 Below structure
Target 4,018 Channel resistance
Bias Bullish Buy from dips
RR Ratio ~3.3:1 Good reward setup

ANFIBO | XAUUSD - Fibo 2.618 at $4000 is coming soon [10.7.2025]Hi traders, Anfibo is here!
XAUUSD Analysis – Daily Trading Plan
Overall Picture:
It appears that gold OANDA:XAUUSD is moving exactly according to the two projected waves outlined in yesterday’s plan. The market continues to demonstrate strong bullish momentum, steadily seeking new all-time highs .
The current uptrend shows no significant signs of weakening, with safe-haven demand still dominating price action. However, the $4,000/oz level remains a key psychological resistance, which also aligns with the Monthly Fibonacci extension target. As price approaches this zone, a technical correction or profit-taking phase is highly likely to occur.
The degree of this potential correction will depend heavily on macroeconomic data and geopolitical developments, so it’s essential to closely monitor and reassess the market as new information unfolds.
Technical Outlook:
Primary Trend: Strong bullish momentum on both Daily and Monthly timeframes.
> SUPPORT KEY / BUY ZONES : 3942 - 3926 - 3909 - 3900 - 3890
> RESISTANCE KEY / SELL ZONES : 3970 - 3975 - 3984 - 3999
Trading Plan for Today:
>>> SELL ZONE:
ENTRY: 3995 - 4005
SL: 4010
TP: 3900 - 3800 - ...
>>> BUY ZONE:
ENTRY: 3885 - 3900
SL: 3880
TP: 3940 - 3970 - 3995 - ...
Risk Management:
- Maintain a minimum Risk:Reward ratio of 1:2.
- Manage position sizing carefully; avoid overtrading at psychological highs.
- Monitor U.S. economic data and geopolitical news closely, as these could act as catalysts for corrective moves.
Conclusion:
Gold continues to follow the planned technical path, reaffirming the strength of its bullish structure. The $4,000/oz zone will serve as a key psychological milestone — a level where temporary corrections or consolidations are likely before another potential leg higher.
For now, the strategy remains clear: prioritize the bullish side, and closely observe price reactions around $4,000 to adjust accordingly. In this market, “following the trend” remains the wisest approach.
GOODLUCK GUYS!

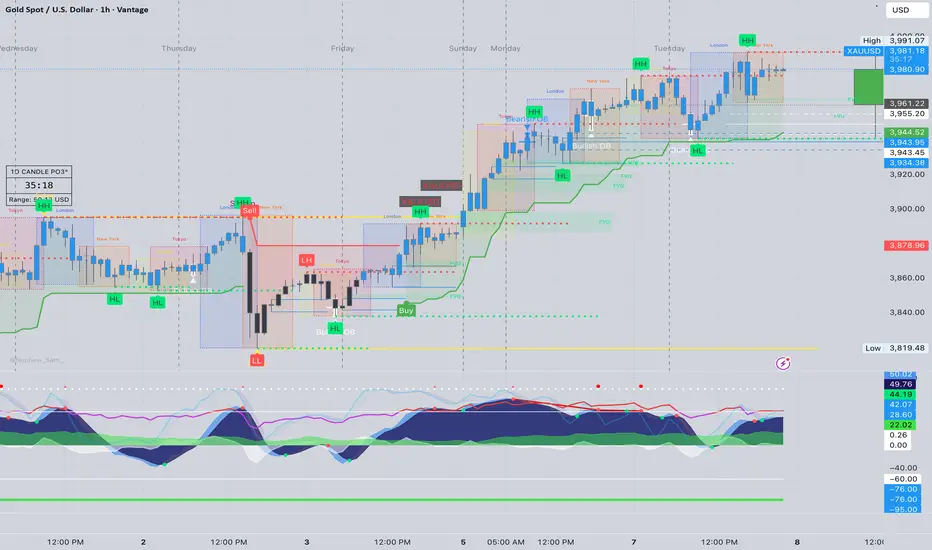
Strong momentum. Watch key levels.Gold prices hit a new high on Tuesday. After a pullback to around 3940 in the European session, they continued their strong upward momentum, reaching a new high at 3985 before retreating slightly.
On the 1-hour chart, after a pullback in the European session that touched the lower Bollinger Band, prices rebounded strongly, rising straight up to reach a new high and currently trading near the upper band. The moving average system crosses upward, and the price continues to create new highs along the MA5 moving average.
The key position to focus on in the short term is the 3960-3965 area, which is the intersection of the MA10\20 moving average and the middle track of the Bollinger band. Therefore, if gold bulls continue to gain momentum, a correction will not likely fall below 3960. As long as the price remains above 3960, and after reaching 3980, resistance at the 4000 mark will be minimal.
Quaid recommends watching the 3960 area and entering a long position as soon as it stabilizes above 3960. The high point position focuses on the 4000 integer mark.