The gold-driven logic behind the US attack on VenezuelaThe "black swan" shock in the global crude oil market: Venezuela, as an important member of OPEC, produces 1.2 million barrels of oil per day (accounting for 1.3% of global crude oil supply), and controls 18% of the world's proven oil reserves. If the US military strike causes the paralysis of its oil facilities (such as the Maracaibo Lake oil field and the Caribbean Sea ports being bombed), global crude oil supply will instantly decrease by 1.2 million barrels per day. Coupled with the fact that the situation in the Middle East has not yet eased, the Brent crude oil price may soar from the current $85 per barrel to $120-130 per barrel, reaching a new high since 2022.
The signal of restarting the inflation spiral: For every $10 increase in crude oil price per barrel, it will push up the US core CPI by 0.3-0.4 percentage points. If the oil price exceeds $120, the US CPI may return to above 4% in December 2025. This will completely reverse the market's expectation of "inflation moderation", and the demand for gold as an "inflation-resistant hard asset" will experience an explosive growth - during the 2022 Russia-Ukraine conflict, the inflation concerns triggered by the oil price increase led to a 5.8% weekly increase in gold prices. This scenario shock is even stronger, with a weekly increase of over 7%.
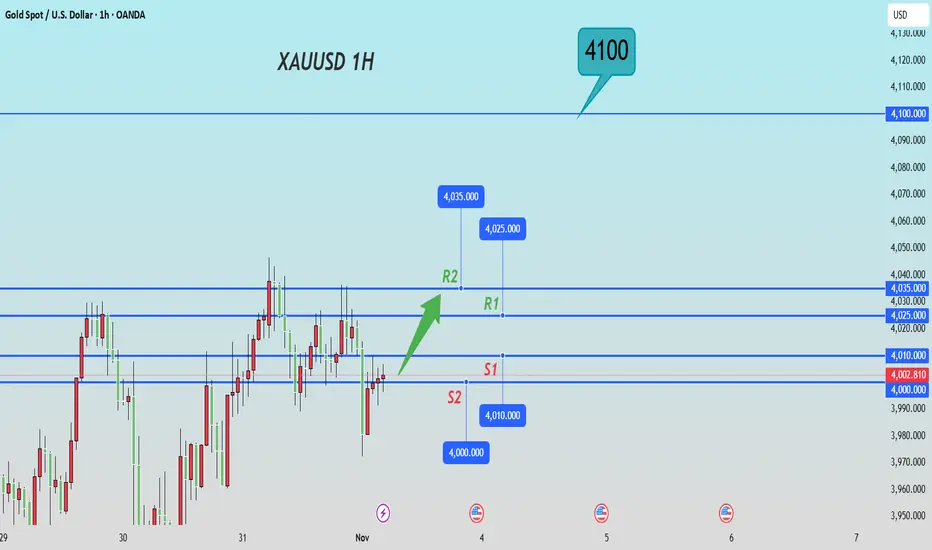
Next week's trading strategy and analysis
buy:4000-4010
tp:4025-4035-4100
sl:3995
Xauusdsignal
XAUUSD BEARISH REVERSAL SETUP FROM SUPPLY ZONE🔍 Key Observations:
1. Market Structure Shift:
A Change of Character (CHoCH) has occurred near the upper boundary of the ascending channel.
This indicates a potential shift from bullish to bearish momentum.
2. Liquidity & Supply Zone:
The red zone near $4,044 – $4,018 acts as a supply zone or bearish order block.
Price has reacted from this level, rejecting higher prices.
3. Entry & Targets:
Entry: Around $4,011 – $4,018 (current zone)
Stop Loss: Above the recent high near $4,044
First Target (TP1): $3,977 – local liquidity zone
Second Target (TP2): $3,930 – $3,915 major demand area / imbalance fill zone
4. Channel Breakdown Potential:
If the price closes below the lower trendline of the ascending channel, a strong bearish continuation toward the lower targets is expected.
5. Smart Money Concept (SMC) View:
The chart aligns with liquidity grab above highs, followed by CHoCH, suggesting smart money selling pressure.
A retracement to premium zones has already happened, and distribution is likely underway.
📉 Bearish Outlook Summary:
Bias: Bearish
Entry Zone: 4,011 – 4,018
Stop Loss: 4,044
Target 1: 3,977
Target 2: 3,930 – 3,915
Invalidation: Break and close above 4,045 would negate bearish setup.

(XAU/USD) Bullish Reversal Setup Toward $4,066 Target ZoneThis chart shows the 1-hour price action of Gold (XAU/USD). The price is currently around $3,997 and has bounced from a support trend line. Key support levels are marked at $3,914 and $3,866, while resistance is near $4,030. The chart suggests a potential bullish move toward the target buy zone around $4,066, following a possible retest of the trend line or support area before continuing upward.

GOLG BULLISH BREAKOUT SETUP TARGETING 4030 AFTER STRUCTURAL SHIFEntry Point: Around 3,994 – 4,000 USD — where price retested the demand zone after BOS.
Stop Loss: Below 3,978 USD, just under the last higher low to protect from fakeouts.
Target Zone 1: Around 4,011 USD — short-term resistance and first liquidity area.
Target Zone 2: Around 4,034 USD — strong supply zone and next liquidity pool (EQH zone).
Smart Money Concept (SMC) Insights:
Liquidity Sweep: The chart shows that equal lows (EQL) were swept before bullish structure formed — a common SMC pattern indicating accumulation.
Fair Value Gap (FVG): Price may fill a small imbalance before continuing higher.
Strong High Zone: Around 4,034, which could act as the final liquidity target before a potential pullback.
Trade Idea:
Setup: Bullish continuation after market structure shift.
Risk/Reward: Approximately 1:3 R/R ratio.
Bias: Bullish as long as price holds above 3,978 – 3,980 zone.

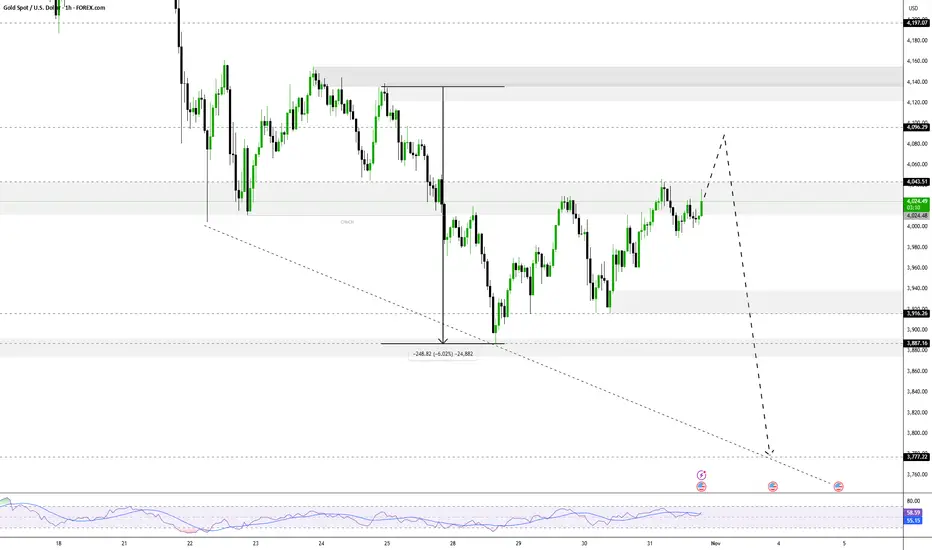
The gold price is still in the process of correcting Wave 4The gold price is still in the process of correcting Wave 4, and nothing has changed structurally.
Currently, the price continues to respect the corrective zone we have been monitoring, and the internal waves still support the complex WXY pattern. This tells us one thing:
⏳ The correction is not over.
Once Wave 4 is complete, the real opportunity will begin:
✅ First impulse up → confirms trend resumption
✅ Pullback (Wave 2) → optimal entry point
✅ Wave 3 → highest potential reward 🚀
If the price breaks above the current resistance zone from here, we will monitor the alternative count. However, as long as the structure hasn't confirmed it, we remain patient.
Remember:
Corrections are designed to test patience.
Wave 4 is historically the most complex wave; triangles, flats, and complex structures are common.
Remain disciplined. Let the structure settle. The next leg up will be worth the wait.
Gold Trade Set Up Oct 31 2025Price is bullish on the 1h and 15m making HH/HL and just broke structure to the upside on the 15m so i want to see a pullback into 15m FVG or sweep internal 5m SSl before looking for a continuation back up

Bearish Continuation Setup with Defined Risk/RewardKey Observations and Trading Setup
Price Action Context: The price recently made a high around $4,045 and appears to be consolidating or forming a lower high after a previous upward move.
Identified Setup: A bearish (sell) trade setup is clearly marked on the chart.
The Entry Price appears to be around $4,009.24 (the current price shown on the OHLC data).
The Stop Loss (the maximum acceptable loss level) is placed at $4,030.62, just above a recent swing high, indicating the point where the bearish bias would be invalidated.
The Target (Take Profit) is set at $3,980.22, indicating the desired level to exit the trade for a profit.
Visual Representation:
The red box highlights the area of risk (above the entry up to the stop loss).
The green box highlights the area of potential reward (below the entry down to the target).
The white arrow clearly illustrates the expected downward price movement.

XAUUSD: Bulls vs. Resistance — 4050 Decides the Next MoveIn yesterday’s analysis, I mentioned that after the reversal from the 3920 support zone, Gold (XAUUSD) could continue higher toward the 4050 resistance area.
Indeed, that target has been reached, followed by a 600-pip leg down overnight.
At the moment, the price is resuming its upward move and is trading back above $4,000, around 4025.
Going forward, I expect volatility to remain high. If the bulls fail to sustain the price above 4050, another leg to the downside could follow.
For now, I’m out of the market, waiting to see whether we’ll get another test of 4050 — and more importantly, how the price reacts in that zone. 🚀

The Yo-Yo Market: Gold Swings Wildly but Goes NowhereRecently, Gold’s volatility has been extreme — with over 1,000+ pip swings up and down. Yet, despite all the loud noise , if we look closer, nothing truly significant has happened since the drop from the 4400 zone to below 4,000.
For most retail traders using stop losses, this type of environment has been extremely challenging — whipsaws in both directions.
However, if we step back and filter out the noise, a clearer structure begins to appear:
________________________________________
🔍 Key Observations
1. Normal Correction Behavior
The sharp drop from the all-time high actually stopped right at the previous ATH from early October — a very common technical behavior, where price retraces into prior calendar-based resistance zones.
2. Below 4K, But Not Broken
Although Gold is currently trading below 4,000, the move under that level is not yet a confirmed breakdown.
3. Strong Rebounds from 3920
Yesterday, price bounced aggressively from the 3920 zone, and this exact reaction repeated twice overnight — showing that buyers are still defending this area.
4. Correction Within the Golden Zone
Despite the dramatic fall, the current retracement sits just above the 61.8% Fibonacci level of the strong bullish leg from late August — technically, a textbook “golden zone” correction.
________________________________________
🎯 Trading Outlook
If we connect all the dots, Gold appears to be finishing a much-needed correction rather than starting a downtrend.
• Short term:
Resistance is found around 3975–3980. A clean break above could open the way to 4030.
• Medium term:
If Gold manages to stabilize above 4,000, the next upside targets are 4050, and possibly 4150 as we move into November.
________________________________________
⚖️ Final Thoughts
Yes, volatility is high — but beneath the surface, Gold is simply completing a natural corrective phase.
As long as 3900-3920 zone holds, the medium-term focus shifts back toward 4150.
🚀

XAU/USD Intraday Plan | Support & Resistance to WatchYesterday’s analysis is playing out as expected — after breaking above the 3987 resistance, gold tested the 4042 level, but failed to sustain momentum and pulled back for a retest of 3987, now acting as short-term support.
We need to see a clear break of either level to confirm direction, otherwise price may continue to range within this zone before the next move.
A break above 4,042 could open the way for a push toward 4095 and 4137, while a break below 3987 would likely trigger a move back toward the Deeper Support Zone (3,944–3,884).
📌 Key levels to watch:
Resistance:
4042
4095
4137
4178
Support:
3987
3944
3884
3820

XAU/USD – Gold Maintains Short-Term Uptrend, Target $4,108🔍 Market Context
Gold continues to uphold a short-term bullish structure after forming a clear Change of Character (ChoCH) around the 3,926 USD area.
Buyers are in control as prices consistently create higher lows and react positively at the Order Block + Support Trendline zone.
As long as prices remain above the 3,940–3,926 USD range, the bullish structure is preserved.
💎 Key Technical Zones
• Order Block Bullish: 3,926 USD → main support zone, confluence with rising trendline.
• Fair Value Gap (FVG): 3,942 – 3,972 USD → potential liquidity absorption zone.
• Resistance Zone: 4,032 USD → short-term barrier, needs to break to confirm continued upward momentum.
• Liquidity Zone: 4,108 USD → extended target if the above resistance is breached.
🎯 Trading Scenarios
1️⃣ BUY Setup – Prioritize catching the retracement from the support zone
• Entry: 3,942 – 3,926 USD
• Stop Loss: 3,910 USD
• Take Profit:
– TP1: 3,972
– TP2: 4,032
– TP3: 4,064
– TP4: 4,108
✳️ “Buy the discount” – Prioritize entries at the confluence of OB + FVG to follow Smart Money flow.
2️⃣ SELL Scalp – Short-term at resistance zone
• Entry: 4,032 – 4,048 USD
• Stop Loss: 4,060 USD
• Take Profit:
– TP1: 4,010
– TP2: 3,972
– TP3: 3,942
✳️ “Sell the premium” – Only activate if a clear price rejection signal appears at resistance.
💬 Summary
The current structure remains bullish short-term with the 3,926 USD area as the key invalidation zone .
As long as prices stay above the trendline, the immediate target is the 4,108 USD liquidity zone.
Optimal strategy: Buy on dip – Sell on reaction.
💡 Today's Tagline:
“Smart Money buys fear, sells greed — follow the footprints, not the noise.”
⏰ Timeframe: 1H
📅 Update: 31/10/2025
✍️ Analysis by: Captain Vincent

Gold 1H - Intraday Trading Plan
🌐 MARKET CONTEXT
Price of gold (XAUUSD) recently reached multi-year highs above $4,000/oz, driven by safe-haven flows, weak U.S. dollar and expectations of monetary easing.
However, near-term headwinds are visible: optimism on U.S.–China trade negotiations, and some pull-back from record highs have switched sentiment from pure “buy the rally” to “buy the dip or maybe sell the bounce”.
There’s also focus on upcoming macro releases (e.g., U.S. Producer Price Index, Fed commentary) which could trigger swings in yields/dollar and thus gold.
Sentiment currently: Slightly risk-off supportive for safe-havens like gold, but with caution creeping in given profit-taking and potential dollar/rate reversal.
Session expectation: With London session opening soon and NY later, expect increased volatility around U.S. data and Fed-related news.
Macro bias: Mildly bullish, as long as the key support zones hold; but neutral/bearish risk increases if support breaks and dollar/yields strengthen.
📉 TECHNICAL ANALYSIS (SMC + LIQUIDITY STRUCTURE)
Structure: After the strong impulse up, price is in a corrective phase (range/flag) rather than clean uptrend. The prior strong high now acts as potential liquidity trap (smart money exhaustion).
Key zones to monitor:
Support zones where demand may appear: look for sweep of liquidity at previous lows or structural support.
Supply zones above where untested liquidity resides – places big players may unload.
Confirmation of SMC: Watch for signs of liquidity sweep (WSB/SSL), false breakout (fake BOS), or trap (smart money manipulating stop-hunts) in M15/H1.
For example: if price revisits a support zone and shows a wick below then closes back above → potential mitigation → buy scenario. Conversely, if price rallies to a supply zone then reverses sharply → possible trap → sell scenario.
🔑 KEY PRICE ZONES
$4,120–4,140 ▶️ Supply zone – near recent highs; potential profit-taking and stop-hunts above.
$4,000–3,980 ▶️ Important Support – psychological $4k level + prior swing area.
$3,935–3,905 ▶️ Strong Support – deeper structural demand zone + previous channel base.
$3,860–3,840 ▶️ Lower Support / liquidity sweep zone – if the major supports fail, this is next.
$4,200–4,230 ▶️ Extended Resistance – higher untested supply if momentum returns.
⚙️ TRADE SETUPS
✅ BUY SCENARIO – Demand Bounce
Entry: ~$4,020–4,018 zone
Stop-loss: ~$4,013
TP1: ~$4,120
TP2: ~$4,200
Logic: Price holds above key support, shows mitigation (wick below then back), CHoCH from bear-correction to bullish bias.
✅ BUY SCENARIO 2 – Deeper Support Entry
Entry: ~$3,920–3,918 zone
Stop-loss: ~$3,911
TP1: ~$4,020
TP2: ~$4,120 (trail)
Logic: If first support fails, look for deeper structural support and sweep of liquidity before large players ramp.
✅ SELL SCENARIO – Supply Rejection
Entry: ~$4,140–4,138 zone
Stop-loss: ~$4,147
TP1: ~$4,000
TP2: ~$3,920
Logic: Price rallies into supply, shows reversal (e.g., bullish candle followed by strong bearish candle) during NY session — high-risk, high-reward trap.
⚠️ SCALPING SELL – If sees quick spike above ~$4,140 (into ~$4,160) then rapid rejection → short-term sell targeting ~$4,060.
🧠 NOTES / SESSION PLAN
Focus trade entries during London ↔ early NY session, especially around macro events.
Be ready for spikes/whipsaws given current macro uncertainty.
Wait for confirmation on M5/M15 before entering: don’t jump purely on zone touches.
Avoid entering just before major data or Fed release; be cautious of fakeouts.
Risk-management: Use tight stop losses, keep trade size moderate given higher volatility.
🏁 CONCLUSION
The bias for XAUUSD remains mildly bullish, conditional on key support holding. The market is treading a line between safe-haven demand and profit-taking exhaustion. Primary focus is on the support band ~$4,000-$3,980 for long entries; conversely, the supply zone ~$4,120-$4,140 serves as a potential reversal/trap area. Enter with confirmation, manage risk tightly, and beprepared for sharp moves from macro triggers.
FOLLOW KHANG_TRADER for precision market insights ⚡

Gold Buy at 4080 and sell at 4240Now gold in consolidation mode and trying to book profits and make the retail traders into the trap so for now we need to be patience and buy at 4080 and close at 4240, after the fed interest cut gold will come down so sell at 4240 and wait for long selling till 3966. This method is Wd Gann inspiration i made and am still learning, this one sharing for study purpose so trade with your own analysis.

Gold Price Outlook – Trade Setup (XAU/USD)📊 Technical Structure
OANDA:XAUUSD Gold is consolidating near $4,000, following a rebound from the $3,948–3,957 support zone. The price faces strong resistance between $4,008–4,016, where there is a possibility to retrace back to the trendline. A rejection from this zone could confirm a short-term pullback toward support, while a decisive breakout above $4,023 may open the door to $4,050 and beyond.
🎯 Trade Setup
Entry: $4,008 – $4,016 (resistance retest)
Stop Loss: $4,023
Take Profit: $3,957 / $3,948
Risk-Reward Ratio: ≈ 1 : 3.8
🌐 Macro Background
Gold extended its recovery for the second consecutive day amid renewed safe-haven demand, but the upside remains capped by the Fed’s hawkish stance. As FXStreet’s Haresh Menghani noted: “Gold trades with a positive bias for the second straight day, though remains capped below $4,050 amid mixed fundamental cues.” 【FXStreet】
The U.S. government shutdown concerns continue to weigh on sentiment, softening the Dollar slightly and supporting gold’s defensive bid. However, Fed Chair Powell’s hawkish tone—stating that another December rate cut “is not a foregone conclusion”—keeps the USD underpinned and limits further gold gains.
In addition, the de-escalation in U.S.–China trade tensions has improved risk appetite, reducing safe-haven flows. This mixed backdrop leaves gold oscillating within a tight range ahead of key FOMC member speeches and month-end flows.
🔑 Key Technical Levels
Resistance: $4,008 – $4,016
Support: $3,948 – $3,957
Psychological Level: $4,000
📌 Trade Summary
Gold trades near $4,000, balancing safe-haven support and Fed-driven headwinds. The short-term bias favours selling near resistance ($4,008–4,016) targeting the $3,957 zone, with stops above $4,023. A sustained close above $4,023 would invalidate this bearish bias.
⚠️ Disclaimer
This analysis is for reference only and does not constitute trading advice. Trading involves significant risk, and proper risk management is essential.

GOLD Potential Short!
HI,Traders !
#GOLD keeps growing
And we are bullish biased
Mid-term but the price will
Soon hit a horizontal resistance
Of 4027.04 from where a local
Bearish pullback is to
Be expected !
Comment and subscribe to help us grow !

ANFIBO | XAUUSD - Soboring today [10.30.2025]Hi traders, I'm here, Anfibo.
XAUUSD Analysis – Daily Trading Plan
Trading Plan for Today:
>>> SELL ZONE:
ENTRY: 4135 - 4150
SL: 4165
TP: 4045 - 4010 - 4000
>>> BUY ZONE:
ENTRY: around 3935
SL: 3915
TP: 4020 - 4080 - 4135 - ...
Risk Management:
- Prioritize Buy setups following the higher-timeframe trend; Sell only for intraday scalps.
- Maintain a minimum Risk:Reward ratio of 1:2.
- Avoid entries during major geopolitical or economic announcements.
- Monitor the Head & Shoulders pattern closely — confirmation will guide the next major move.
Conclusion:
Gold has completed a healthy correction after its parabolic surge to $4,400, and the market is now regrouping around the $4,000 zone, with early signs of renewed bullish momentum. As long as $3,890 remains intact, the broader trend remains bullish, and I expect a potential rebound toward $4,200 in the near term.
GOODLUCK, LOVE U GUYS!

GOLD HIGH PROBABILITY SETUP SOON!!!🚨 XAUUSD HIGH PROBABILITY BUY SETUP 🚨
* Here We Can See Clearly The Next Potential Moves For GOLD Coming Hours/Days.
* Keep Your Eyes Close On Your Trading Positions.
* Happy PIP Hunting Traders.
FXKILLA.

GOLD ; How far down?Hello friends
Well, after the good rise we had, the price needed a correction, which happened with a double top pattern.
Now the main question is, how far will the fall go?
Well, in the short term, the price can fall to the specified limits, and if the support areas are broken, the fall will continue, and on the other hand, an important resistance has been created, which the price needs to break for the new ATH.
With this decline, it is unlikely that the price will suffer for a while and correct because it has grown a lot and everything will end one day...
Support levels can be good points for buying, of course with capital and risk management.
*Trade safely with us*

Gold Trade Set Up Oct 30 2025Price pushed up after failing to break and close below 4h swing lows and is making 1h and 15m HH/HL so internally i am bullish. If price can break and close above 15m LH and sweep 5m SSL i will look for buys to London highs and PDH but if price fails to close above 15m highs and closes below 15m and 1h swing low i will wait for a BSL sweep on the 5m to target PDL

XAUUSD - Bears are taking over Gold remains under bearish pressure as it trades below key moving averages and fails to reclaim the 61.8% retracement zone. A confirmed 4H close below $3,920 would strengthen the case for a continuation toward the Fibonacci extension targets listed below.
🎯 Fibonacci Extension Targets (Bearish)
Using the latest swing high to swing low:
Target 1 (38.2%) → $3,832
Target 2 (61.8%) → $3,808
Target 3 (100%) → $3,776
Bias: Bearish continuation
Confluences:
Trend Structure: Price is forming lower highs and lower lows after rejecting from the previous swing high, confirming a bearish market structure.
EMA Ribbon / Dynamic Resistance: The price is trading below the EMA ribbon, which is now acting as a strong dynamic resistance zone.
Fibonacci Retracement: Price rejected from the 61.8% retracement level of the previous downswing — a key bearish retracement zone.
Momentum Indicators: Bearish momentum increasing as candles close below the midline of the ribbon with low buying pressure.
Volume/Confirmation: Decreasing bullish volume on retracement, followed by renewed selling pressure.

XAUUSD (GOLD) – ASIA SESSION ANALYSIS RESULTS4️⃣ High-Probability Trade Scenarios
📉 SELL Setup (Main Bias)
• Entry Zone: 3,955 – 3,964 (Golden Zone)
• Confirmation: 5M/15M bearish engulfing or CHoCH after liquidity sweep.
• TPs: 3,940 → 3,930 → 3,916 → 3,898 → 3,886
• SL: Above 3,976
💡 Rationale: Rejection from fib zone aligns with H1 structure continuation; best risk-reward short setup.

XAU/USD (Gold) - Mildly bullish to neutralBias: Mildly bullish to neutral. gold is holding above US$4,000 when priced in USD, but remains vulnerable to downside if key support breaks.
Key Levels:
Support approx $3,846.50 ‑ $3,771.46 value zone.
Resistance near ~$4,041 (20‑SMA) and ~$4,111 (100‑SMA).
Trade Plan:
Entry (Bounce long): Consider buying on a clean bullish rejection near ~$3,850‑3,780 (if reached). SL (stop‑loss) ~ $3,730. TP1 ~ $4,040; TP2 ~ $4,110.
Entry (Breakout long): If gold convincingly breaks above ~$4,040 with good volume, consider entry ~4,050. SL ~ $3,900. TP1 ~$4,200; TP2 ~$4,300+.
Caution / alternative short): If price breaks below support Zone $3,770 → could target $3,650 area.
Risk Management:
Risk size ~1‑2% of the account per trade.
After TP1 is hit, move the stop to breakeven or just below the entry to protect the profit.
Watch USD strength/weakness (as gold broadly trades inversely to USD). If the dollar strengthens sharply, the bias may shift.

XAU/USD – Gold in Equilibrium Zone: Sell Opportunities Around...🔍 Market Context
Gold is currently consolidating within a triangle structure , showing short-term accumulation before a potential breakout.
Buyers are trying to maintain a minor bullish structure, but the series of lower highs indicates that sellers still hold the upper hand.
At the moment, price is reacting within the FVG 3,942–3,979 USD area, staying below the descending trendline.
If this zone fails to break, selling pressure may return.
💎 Key Technical Levels
• Bearish Order Block: 4,022 USD → main supply zone, aligning with the descending trendline.
• FVG Zone 1: 3,979 USD → short-term liquidity test area.
• FVG Zone 2: 3,942 USD → potential retracement zone before further downside.
• Bullish Order Block: 3,882 USD → key support aligning with long-term bullish trendline.
• Liquidity Zone: 3,789 USD → extended target if main support breaks.
🎯 Trading Scenarios
1️⃣ Sell Setup – Reaction from Resistance Zone
• Entry: 4,012 – 4,022 USD
• Stop Loss: 4,035 USD
• Take Profit:
– TP1: 3,979
– TP2: 3,942
– TP3: 3,900
– TP4: 3,882
– TP5: 3,789
✳️ “Sell the premium” – utilise supply and FVG reactions following Smart Money flow.
2️⃣ Buy Setup – Reaction from Demand Zone
• Entry: 3,882 USD
• Stop Loss: 3,865 USD
• Take Profit:
– TP1: 3,910
– TP2: 3,942
– TP3: 3,979
– TP4: 4,012
– TP5: 4,022
✳️ “Buy the discount” – valid when strong absorption or reversal signal forms near the lower OB.
💬 Summary
Current structure remains short-term bearish , yet the market is balanced.
The most efficient approach is to sell near premium zones (4,022) and buy back near discount (3,882) .
Expected range in the next 24–48 hours: 3,880–4,020 USD .
💡 Tagline:
“Trade where institutions act — not where retail reacts.”
⏰ Timeframe: 1H
📅 Updated: 30/10/2025
✍️ Analysis by: Captain Vincent
