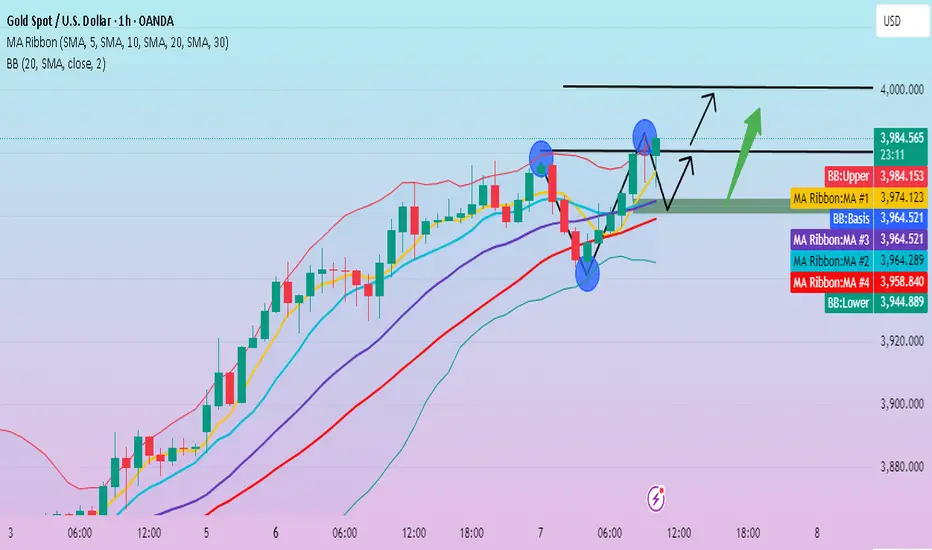
ANFIBO | XAUUSD - Fibo 2.618 at $4000 is coming soon [10.7.2025]Hi traders, Anfibo is here!
XAUUSD Analysis – Daily Trading Plan
Overall Picture:
It appears that gold OANDA:XAUUSD is moving exactly according to the two projected waves outlined in yesterday’s plan. The market continues to demonstrate strong bullish momentum, steadily seeking new all-time highs .
The current uptrend shows no significant signs of weakening, with safe-haven demand still dominating price action. However, the $4,000/oz level remains a key psychological resistance, which also aligns with the Monthly Fibonacci extension target. As price approaches this zone, a technical correction or profit-taking phase is highly likely to occur.
The degree of this potential correction will depend heavily on macroeconomic data and geopolitical developments, so it’s essential to closely monitor and reassess the market as new information unfolds.
Technical Outlook:
Primary Trend: Strong bullish momentum on both Daily and Monthly timeframes.
> SUPPORT KEY / BUY ZONES : 3942 - 3926 - 3909 - 3900 - 3890
> RESISTANCE KEY / SELL ZONES : 3970 - 3975 - 3984 - 3999
Trading Plan for Today:
>>> SELL ZONE:
ENTRY: 3995 - 4005
SL: 4010
TP: 3900 - 3800 - ...
>>> BUY ZONE:
ENTRY: 3885 - 3900
SL: 3880
TP: 3940 - 3970 - 3995 - ...
Risk Management:
- Maintain a minimum Risk:Reward ratio of 1:2.
- Manage position sizing carefully; avoid overtrading at psychological highs.
- Monitor U.S. economic data and geopolitical news closely, as these could act as catalysts for corrective moves.
Conclusion:
Gold continues to follow the planned technical path, reaffirming the strength of its bullish structure. The $4,000/oz zone will serve as a key psychological milestone — a level where temporary corrections or consolidations are likely before another potential leg higher.
For now, the strategy remains clear: prioritize the bullish side, and closely observe price reactions around $4,000 to adjust accordingly. In this market, “following the trend” remains the wisest approach.
GOODLUCK GUYS!
Xauusdsignal

Strong momentum. Watch key levels.Gold prices hit a new high on Tuesday. After a pullback to around 3940 in the European session, they continued their strong upward momentum, reaching a new high at 3985 before retreating slightly.
On the 1-hour chart, after a pullback in the European session that touched the lower Bollinger Band, prices rebounded strongly, rising straight up to reach a new high and currently trading near the upper band. The moving average system crosses upward, and the price continues to create new highs along the MA5 moving average.
The key position to focus on in the short term is the 3960-3965 area, which is the intersection of the MA10\20 moving average and the middle track of the Bollinger band. Therefore, if gold bulls continue to gain momentum, a correction will not likely fall below 3960. As long as the price remains above 3960, and after reaching 3980, resistance at the 4000 mark will be minimal.
Quaid recommends watching the 3960 area and entering a long position as soon as it stabilizes above 3960. The high point position focuses on the 4000 integer mark.
GOLD near Breakout region? What's next??#GOLD - perfect move so far as per our last ideas and analysis regarding gold.
Now market have 3887 to 3889 as immediate and breakout region for upside.
Keep close and don't hold your selling positions above that.
Good luck
Trade wisely
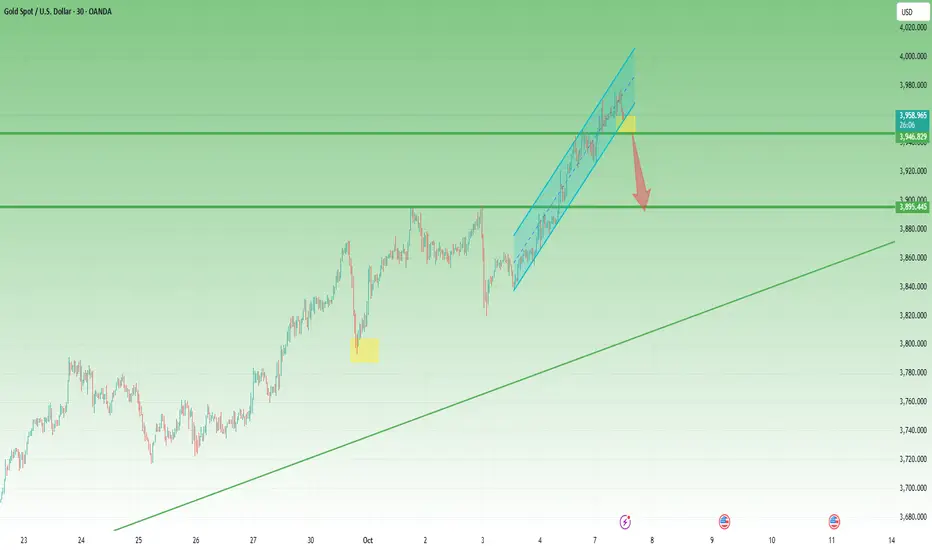
Gold: The Higher It Flies, the Louder the Correction WhispersAs explained in my Sunday video, the new all-time high for Gold is not a question of if, but how high it can rise once it firmly breaks above 3900.
Indeed, Gold has continued its unstoppable march, printing ATH after ATH, with the latest one formed during today's Asian session at 3977 — another almost 1,000 pips gained since Friday’s close.
At this point, there are two undeniable facts every trader recognizes:
1. The trend is extremely bullish.
2. A correction is long overdue.
________________________________________
Technical Outlook
The recent rally remains contained within an aggressive rising channel, but the overlapping highs in the last few hours reveal signs of exhaustion.
A confirmation for even a minor correction — and in this case, with Gold moving vertically, a 500-pip retracement would count as minor — would come with a break below the 3955–3850 zone.
Such a move would likely open the door for a retest of the 3900 area, which now serves as a key support.
________________________________________
Trading Plan
At the time of writing, I’m holding a short position, fluctuating near entry, with small alternating gains and losses.
While I do expect a pullback, I also keep in mind Keynes’s timeless reminder:
“The market can remain irrational longer than you can remain solvent.”
That’s why my stop loss is tight, and my focus is on discipline over prediction.
Gold Trade Set Up Oct 7 2025Price has swept PDH, formed a LL and has now tapped 1h supply so i am expecting price to make bearish structure on the 5m-15m to sell to previous 1h swing low and daily FVG that has to be filled
www.tradingview.com

ElDoradoFx PREMIUM 2.0 – US FORECAST (07/10/2025)
Gold is trading around 3,971, showing renewed bullish strength into the early US session after rejecting the 3,955–3,946 demand zone during London.
The market continues its primary uptrend, though price is now retesting the previous supply zone 3,972–3,977, where bulls previously lost momentum.
Momentum indicators confirm intraday buying pressure but highlight overextension — signaling a possible reaction or rejection before any continuation.
⸻
🔍 Technical Outlook
Daily Chart (D1):
• Strong bullish trend remains dominant, with price far above 20 EMA (3,914) and 50 EMA (3,837).
• RSI (78) → extremely overbought, suggesting the market is nearing exhaustion.
• Parabolic SAR remains below price, confirming bullish structure; however, a close below 3,950 would trigger a correction signal.
• Upside targets remain 3,985 – 4,000, but limited unless US dollar weakens sharply.
1H Chart (H1):
• Structure remains bullish after a BOS (Break of Structure) above 3,965.
• Price is forming higher lows and higher highs; however, current candle shows signs of rejection at 3,972–3,977 (supply zone).
• RSI ~63 → moderate bullish momentum.
• MACD turning positive again with histogram expanding — buyers remain in control.
• 20 EMA (3,961) and 50 EMA (3,949) → immediate support levels to monitor.
15M Chart (M15):
• Strong bullish leg formed after a double-bottom at 3,946 with a confirmed CHoCH (Change of Character).
• Price now testing Fibonacci resistance and supply area 3,972–3,977.
• RSI at 70+ → overbought short term.
• MACD positive but showing early signs of slowing momentum — a retest to 3,965 before continuation is likely.
5M Chart (M5):
• Short-term bullish channel intact.
• MACD histogram remains green, RSI above 65 → intraday bullish continuation bias.
• Possible minor retracement toward 3,964–3,961 for liquidity grab before continuation.
• No bearish divergence yet; structure favors intraday buys on pullbacks.
⸻
✨ Fibonacci Golden Zone
Drawn from 3,946 swing low → 3,977 swing high:
• 38.2% → 3,965
• 50% → 3,962
• 61.8% → 3,958
➡ The Golden Zone (3,965–3,958) aligns with strong EMAs and intraday trendline confluence.
A bounce from this zone would offer high-probability bullish setups for continuation toward 3,977 → 3,985 → 3,990.
⸻
🎯 High Probability Entries
Scalping Setups (M5–M15, ≤60 pips SL):
• Buy Setup #1: Buy at 3,965–3,958 (Golden Zone) after rejection or engulfing candle.
🎯 Targets → 3,972 → 3,977 → 3,985
🛑 SL below 3,952 (60 pips)
• Buy Setup #2: Buy above 3,977 breakout & retest.
🎯 Targets → 3,985 → 3,995 → 4,000
🛑 SL below 3,972 (50–60 pips)
• Sell Setup: Only valid if rejection occurs at 3,977–3,985 zone with bearish engulfing confirmation.
🎯 Targets → 3,965 → 3,958 → 3,946
🛑 SL above 3,985 (60 pips)
⸻
📅 Fundamental Outlook – US Session
• Today’s main catalyst: Fed Chair Powell’s remarks (late session).
• US Dollar Index (DXY) trading around 104.90, stable but showing slight weakness — supportive for gold.
• US Treasury yields are softening, which typically fuels gold demand.
• No major data releases, so market likely to follow technical structure unless Powell’s tone shifts sentiment.
Sentiment: Cautiously bullish — intraday momentum favors dips for continuation, but rejection near 3,977 must be watched closely.
⸻
⚠ Key Levels to Watch
Resistance: 3,972 – 3,977 / 3,985 / 3,995 – 4,000
Support: 3,965 / 3,958 – 3,952 / 3,946 – 3,940
⸻
✅ Summary
Gold maintains bullish momentum above 3,965 but enters a critical resistance zone (3,972–3,977).
The Golden Zone (3,965–3,958) remains the best area to seek new longs on dips.
Only a confirmed breakout above 3,977 opens the path to 3,985–4,000,
while rejection here could trigger short-term pullback to 3,958–3,946 before any continuation.
Bias for US session:
➡ Bullish above 3,958
⚠ Bearish only if 3,946 breaks with strong volume
— ElDoradoFx PREMIUM 2.0 – Deep Analysis Team

Gold Nears $4000, BofA Warns of Mid-Cycle Correction 🚀 XAUUSD – Daily Trading Plan| MMFLOW TRADING
📊 Market Context
Gold is pushing toward the $4,000/oz milestone, but a fresh warning from Bank of America has traders on alert. Strategist Paul Ciana points out that gold is currently trading 20% above its 200-day moving average — a level that historically preceded sharp corrections (2008, 2011, 2020, 2022).
That said, mid-term forecasts from Goldman Sachs, UBS, and even BofA still project gold could reach $4,200–$4,900/oz in the coming year. The long-term bullish trend remains intact, but in the short term, the risk of sudden corrections is high as the market shakes out FOMO-driven buying pressure.
🔎 Technical Analysis (H1/H4)
Price is consolidating near the ATH Zone and major liquidity levels around 3990–4000.
Buy Zone: 3935–3933 (CP zone & FVG reaction) – attractive area to reload long positions.
Sell Zone: 3993–3995 (Liquidity Zone) – a potential trap area as gold tests the $4000 psychological mark.
🔑 Key Levels
BUY Zones: 3935–3933, with main support at 3910.
SELL Zone: 3993–3995 (watch liquidity reaction).
Psychological resistance: 4000.
📈 Trading Scenarios & Plan
✅ BUY ZONE 1: 3935–3933
SL: 3927
TP: 3940 - 3945 - 3950 - 3960 - 3970 - 3980 - ???
✅ SELL ZONE: 3993–3995
SL: 4000
TP: 3988 - 3984 - 3980 - 3970 - 3960 - ???
⚠️ Risk Management Notes
The 3990–4000 zone is a heavy liquidity cluster — expect false breakouts before reversals.
Only enter trades with clear price action confirmation; avoid chasing FOMO near the highs.
Adjust position sizing carefully, as volatility may spike while markets debate the risk of a “mid-cycle correction.”
✅ Summary
Gold remains in a long-term bullish trend, but traders must respect short-term risks. MMFLOW prioritises buys at 3935–3933 while keeping a cautious eye on the 3993–3995 sell zone near the $4000 mark. Upside targets point toward 3980+, with potential for higher extensions if momentum holds.
📢 Stay tuned with MMFLOW TRADING for real-time updates and BIGWIN setups as gold tests historic highs!
XAU/USD 07 October 2025 Intraday AnalysisH4 Analysis:
-> Swing: Bullish.
-> Internal: Bullish.
Price had printed a bearish CHoCH. Where we were trading within an established internal range, however, bearish pullback was insignificant relative to recent price action, therefore, I will not classify the bullish, I have however marked this in red again.
Price has continued bullish printing further ATH's. Price has since printed a bearish CHoCH, which is the first indication, but not confirmation, of bearish pullback phase initiation, however, I will continue to monitor price with respect to dept of pullback.
Price is currently trading within and established internal range.
Intraday Expectation:
Price to trade down to either discount of internal 50% EQ, or H4 supply zone before targeting weak internal high priced at 3,977.400.
Alternative scenario: Price could potentially print higher-highs.
Note:
The Federal Reserve’s sustained dovish stance, coupled with ongoing geopolitical uncertainties, is likely to prolong heightened volatility in the gold market. Given this elevated risk environment, traders should exercise caution and recalibrate risk management strategies to navigate potential price fluctuations effectively.
Additionally, gold pricing remains sensitive to broader macroeconomic developments, including policy decisions under President Trump. Shifts in geopolitical strategy and economic directives could further amplify uncertainty, contributing to market repricing dynamics.
H4 Chart:
M15 Analysis:
-> Swing: Bullish.
-> Internal: Bullish.
Price continued bullish, printing further ATH's.
Price has printed a bearish CHoCH which indicates, but does not confirm, bearish pullback phase initiation. We are now confined with an establish internal range, however, I shall continue to monitor price with respect to depth of pullback.
Intraday expectation: Price to trade down to either M15 supply zone, or discount of 50% EQ before targeting internal high priced at 3,977.400
Alternative Scenario: Price could potentially target strong internal low as H4 TF enters it's bearish pullback phase.
Note:
Gold remains highly volatile amid the Federal Reserve's continued dovish stance, persistent and escalating geopolitical uncertainties. Traders should implement robust risk management strategies and remain vigilant, as price swings may become more pronounced in this elevated volatility environment.
Additionally, President Trump’s tariff announcements are expected to further amplify market turbulence, potentially triggering sharp price fluctuations and whipsaws.
M15 Chart:

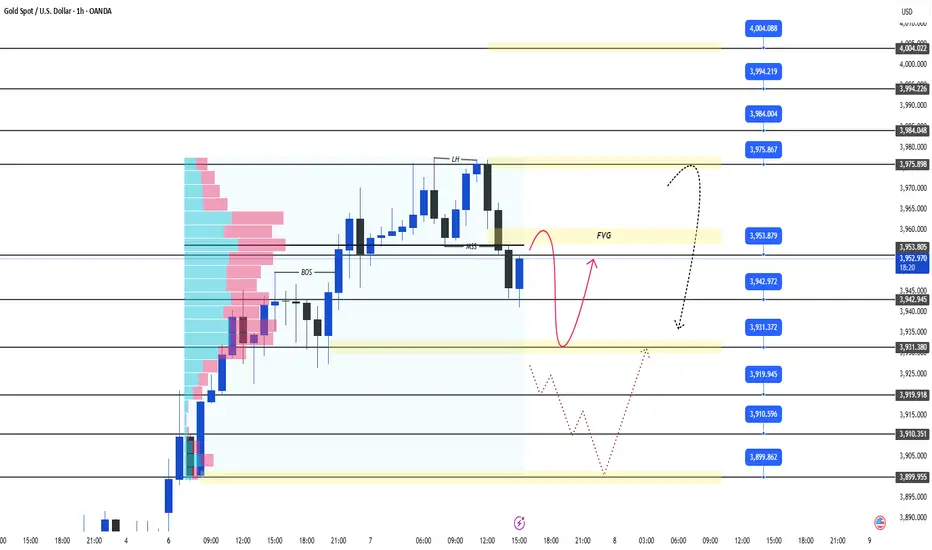
Gold at $397x: Record High Reveals Double Top Pattern! Hello, traders!
Gold just hit a New Record High at $3,976.3/oz. However, immediately after, the market witnessed a clear structure break and the formation of a Double Top pattern in the European session. This strongly signals a shift in strategic priority.
Fundamentals & Bias Reversal
Core Drivers: Gold is up 50% YTD due to persistent Fed rate cut expectations (two more cuts projected) and severe global political instability (US Shutdown, France crisis, rising Japanese yields).
Technical Bias: We are now prioritizing SELL due to the confirmed Double Top and structure breakdown. Only consider BUYs at deeper support zones with controlled risk.
Key Price Levels:
Resistance: $3953, $3975, $3984, $4004
Support: $3942, $3931, $3910, $3899
Trading Strategy (Prioritize SELL):
SELL SCALP: $3957 - $3959
SL: $3963
TPs: $3953, $3948, $3943, $3938, $3933
SELL ZONE: $3975 - $3977
SL: $3985
TPs: $3967, $3957, $3947, $3937, $3927
BUY ZONE 1 (Wait): $3931 - $3929
SL: $3921
TPs: $3939, $3949, $3959, $3969, $3979
BUY ZONE 2 (Deeper): $3899 - $3897
SL: $3889
TPs: $3907, $3917, $3927, $3937, $3947
Will the Double Top send Gold back toward $3900? Let me know your thoughts! 👇
#Gold #XAUUSD #ATH #TechnicalAnalysis #DoubleTop #SELL #Fed #TradingView
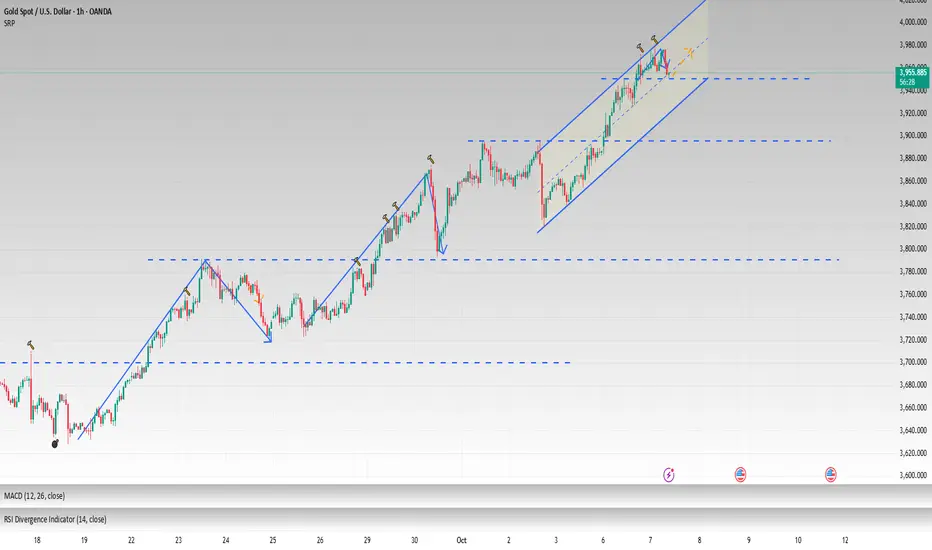
XAUUSD | Sustainable Price Rise: Where’s the Next Optimal Entry?Hello TradingView community! 🚀
Gold (XAU/USD) is in an extremely sustainable upward structure. Instead of lengthy analysis, let's dive straight into the action plan: Where is the optimal entry point and what target is Gold aiming for? Check out the details below.
1. Market Structure Analysis: The Strength of the Bulls 🐂
Looking at the chart, the first thing that catches our eye is a series of "BoS" points (Break of Structure).
Every time Gold breaks a previous peak, it not only creates a Higher High but also confirms that the uptrend is very strong and sustainable. This indicates that buying power is completely dominant and shows no signs of weakening. Smart Money is continuously pushing the price higher, and our job is to ride this "wave."
2. Potential Buying Zones - Where to Catch the Wave? 🧐
To optimize profits and minimize risks, finding a beautiful entry point after a price correction is crucial. Based on the chart, we have 2 notable potential buying zones:
Buying Zone 1 - Fibonacci Confluence ($3885): This is an extremely ideal "Buy Zone," coinciding with the golden Fibonacci ratio of 0.618. In technical analysis, this is a very strong support level where prices tend to reverse and continue the main trend. Professional traders always hunt for pullbacks to this zone.
Buying Zone 2 - Exploiting FVG ($3914 - $3933): Slightly higher, we have the FVG (Fair Value Gap) area at $3914 and the "Buy Scalping" zone at $3933. These are "price gaps" created by supply-demand imbalances when prices rise too quickly. The market tends to return to fill these gaps before continuing its journey. This could be an opportunity for those wanting to catch an earlier wave.
3. Conquest Target - What's Gold's Next Destination? 🎯
Once we have a buying position, where will our target be?
Short-term target: The "Sell Scalping FVG" zone around $3969 could be a minor resistance point where some traders will take profits.
Main target: The ultimate destination this structure is aiming for is the "Sell Gold Liquidity" zone at $3998. This is a critical "liquidity" area, concentrating many stop-loss orders from the Sellers. Prices are often attracted to these zones like a "magnet" to sweep liquidity before making further moves.
Summary & Advice
Main trend: UP.
Primary strategy: Buy on dip when prices correct to key support zones.
Potential buying zones: $3885 (Fibonacci) and $3914 - $3933 (FVG).
Price targets: $3969 (short-term) and $3998 (main target).
Always remember, risk management is the key to surviving in the market. Set reasonable Stop-loss for every trade.
WHAT DO YOU THINK ABOUT THIS PLAN?
Will Gold retrace to the Fibonacci zone $3885 or react right at the FVG zone $3914? Leave your thoughts and perspectives in the comments below. Let's discuss together to find the best opportunities!
👇 Don't forget to Like 👍 and Follow my TradingView channel to not miss daily Gold analysis!

ElDoradoFx PREMIUM 2.0 – LONDON FORECAST (07/10/2025)Gold (XAUUSD) is trading around 3,955, retracing slightly after reaching 3,977, its highest level since early summer.
The metal remains in a strong bullish trend, but momentum indicators suggest temporary exhaustion as price retests the key intraday support zone around 3,952–3,946.
London session opens with early downside pressure and potential short-term retracement before buyers attempt to re-enter.
⸻
🔍 Technical Outlook
Daily Chart (D1):
• Bullish structure remains intact; price is well above both 20 EMA (3,909) and 50 EMA (3,837).
• RSI at 78 indicates overbought territory, suggesting limited upside without a pullback.
• Parabolic SAR remains below price, confirming overall bullish bias.
• A daily close below 3,938 would indicate cooling momentum; otherwise, the trend remains long-biased.
1H Chart (H1):
• Clear ascending channel structure; price recently rejected from the upper boundary near 3,977.
• 20 EMA (3,956) and 50 EMA (3,946) provide immediate dynamic support.
• MACD shows weakening histogram and potential bearish cross; RSI declining from 73 → 59, confirming short-term exhaustion.
• A clean break below 3,946 could extend correction toward 3,927–3,918 liquidity zone.
15M Chart (M15):
• Short-term BOS (Break of Structure) occurred below 3,960, confirming minor bearish shift.
• Price currently testing 200 EMA (3,955) with a possible retest of 3,946 support.
• RSI hovering near 48, neutral but leaning bearish.
• MACD below zero line — momentum currently favors intraday sellers unless 3,962 is reclaimed.
5M Chart (M5):
• Price is bouncing around the lower intraday trendline, showing weak attempts by bulls to defend 3,954–3,952.
• MACD negative; histogram red but flattening.
• RSI near 35–40, indicating possible short-term relief bounce but no reversal confirmation yet.
⸻
✨ Fibonacci Golden Zone (Intraday Focus)
Measured from 3,927 swing low → 3,977 swing high
• 38.2% Fib: 3,958
• 50% Fib: 3,952
• 61.8% Fib: 3,946
➡ The Fibonacci Golden Zone = 3,958–3,946, aligning perfectly with today’s intraday support area.
If bulls hold this zone, London could see a buy reaction toward 3,965–3,972, otherwise break below 3,946 confirms deeper pullback to 3,927–3,918.
⸻
🎯 High Probability Entries
Scalping (M5–M15, ≤60 pips SL):
• Buy Setup: If bullish confirmation appears within 3,952–3,946 (Golden Zone).
🎯 Targets → 3,965 → 3,972 → 3,977
🛑 SL below 3,940 (≈55 pips)
• Sell Setup: If price breaks and retests below 3,946.
🎯 Targets → 3,935 → 3,927 → 3,918
🛑 SL above 3,955 (≈60 pips)
Intraday/Swing Opportunities (H1):
• Buy: Only after rejection or engulfing confirmation from 3,946–3,952 with targets 3,972–3,985.
• Sell: If hourly candle closes below 3,940, target 3,925–3,902.
⸻
📅 Fundamental Outlook – London Session
• No major UK or EU economic releases this morning.
• Focus on US Fed speakers and ISM Services PMI revisions later in the day.
• DXY is hovering near 105.00, showing minor strength which could limit gold’s upside temporarily.
• Treasury yields remain steady, keeping volatility moderate until the NY session.
Overall sentiment: Neutral-to-slightly bearish in early London, with buying interest expected lower near the Fibonacci zone.
⸻
⚠ Key Levels to Watch
Resistance: 3,962 – 3,972 / 3,977 / 3,985
Support: 3,958 / 3,952 – 3,946 / 3,927 – 3,918
⸻
✅ Summary
Gold remains in a strong bullish trend, but London opens with short-term profit-taking.
The Fibonacci Golden Zone (3,958–3,946) is key — holding this area will likely trigger a bullish rebound toward 3,972–3,977,
while a decisive break below 3,946 could accelerate a correction to 3,927–3,918 before any new rally forms.
Bias for London session: Buy dips if 3,946 holds, cautious sells if 3,940 breaks.

The most accurate analysis on the entire network do you follow As the US government shutdown continues, many central banks continue to increase their gold holdings. Coupled with Trump's new tariffs and geopolitical implications, the market continues to release bullish signals, contributing to a pattern of gold prices hitting new highs. Yesterday, gold in the US market tested the resistance of 3960-3970 as expected and then fell back to around 3945. Those brothers who followed the trading strategy and went short must have made good profits.
As time goes by and the price of gold continues to rise, the short-term lows are also moving higher. Gold continued to rise in the Asian session today, reaching a high of around 3977 before falling back. In the short term, pay attention to the support level below 3955-3940. If it falls back for the first time during the day, you can consider going long on gold.
In addition, observing previous gold price trends, we can see that every time gold breaks through a new high, it will experience a pullback of approximately $70-80 to accumulate momentum after hitting channel resistance. According to this trend pattern, combined with the rising channel of our chart, we can find that the next suppression point is at 3985-4000.
Overall, gold remains bullish in the medium to long term, but may experience short-term technical adjustments. The core trading strategy remains primarily long gold, supplemented by short positions. If the price falls back to the 3955-3940 range for the first time during the day, you can consider buying gold in batches according to the strength of the pullback, with the target at 3985-4000. After the resistance level is reached and under pressure, you can consider shorting gold appropriately based on the market trend.
ANFIBO | XAUUSD Weekly Plan [10.6 - 10.10.2025]Hi traders, Anfibo is here!
XAUUSD Analysis – Daily Trading Plan
Overall Picture:
Gold’s bullish trend remains extremely clear, reflecting the market’s strong confidence in this safe-haven asset amid ongoing global economic and geopolitical uncertainties. The continuous series of new ATHs highlights that buyers are firmly in control of the market.
However, from a technical perspective, the $4,000/oz level stands out as a significant psychological round-number resistance. This zone also coincides with the Monthly Fibonacci extension target, making it highly likely that profit-taking will emerge once price approaches this level. Any reaction here will largely depend on external factors and key news events, which must be closely monitored.
Technical Outlook:
Primary Trend: Strong bullish momentum on both Daily and Monthly timeframes.
Momentum: Still positive, though $4,000 may trigger short-term corrections.
> SUPPORT KEY / BUY ZONES : 3800- 3787 - 3750 - 3723 - 3713 - 3703
> RESISTANCE KEY / SELL ZONES : 3825 - 3835 - 3865 - 3880
Trading Plan for Today:
>>> SELL ZONE:
(1) ENTRY: 3969 - 3973
SL: 3976
TP: 3900 - 3890
(2) ENTRY: 3995 - 4005
SL: 4010
TP: 3900 - 3800 - ...
>>> BUY ZONE:
ENTRY: 3885 - 3900
SL: 3880
TP: 3940 - 3970 - 3995 - ...
Risk Management:
- Maintain a minimum Risk:Reward ratio of 1:2.
- Manage position sizing carefully; avoid overtrading at psychological highs.
- Monitor U.S. economic data and geopolitical news closely, as these could act as catalysts for corrective moves.
Conclusion:
Gold remains in a powerful bullish cycle with no signs of cooling down yet. However, the $4,000/oz mark is a critical psychological and technical barrier where corrective pullbacks are likely to occur. Traders should continue to favor long setups but remain vigilant around this zone, closely observing price reactions to refine their strategies.
WISH EVERYONE A PROFITABLE NEW WEEK!

7/10/68 : XAUUSD ( Europe / London Session )Using it from Europe Session until 7.00PM , I'll new analysis and update at 8.00PM
Resistance
3996-4001
3986-3991
3981
Support
3970
3959-3965
3948-3954

Gold Hits $394x! New ATH: Fed & BoJ Drive the Rally.Hello, traders!
Gold (XAU/USD) just had a massive breakthrough in the Asian session, setting a New ATH around $394x after breaching the $3900 barrier. This strength is underpinned by two major monetary policy factors: Fed rate cut expectations and the likelihood of the BoJ (Bank of Japan) delaying rate hikes due to the new Prime Minister.
Fundamentals & Technical Caution
Dual Drivers: The market anticipates two more Fed rate cuts this year, which, combined with the BoJ's dovish outlook, creates a strong foundation for Gold.
Safe-Haven: The ongoing US Shutdown and geopolitical tensions maintain demand for Gold as a safe haven.
FOMO Warning: The upward momentum is fierce, but you must avoid buying the high (FOMO). Prioritize Buying on pullbacks to FVG (Fair Value Gaps) to ensure safer entries.
Key Price Levels:
Resistance: $3954, $3963
Support: $3910, $3895, $3883, $3870
Trading Strategy (Absolute Risk Management):
BUY SCALP: $3910 - $3908
SL: $3904
TPs: $3918, $3928, $3938, $3948, $3958
BUY ZONE (FVG): $3895 - $3893
SL: $3885
TPs: $3903, $3913, $3923, $3933, $3943
SELL ZONE (High Risk): $3964 - $3966
SL: $3974
TPs: $3956, $3946, $3936, $3926, $3916
Are you ready to capitalize on this new momentum? Share your view below! 👇
#Gold #XAUUSD #ATH #Fed #BoJ #Shutdown #TradingView #MarketAnalysis #RateCuts

Upward trend. Bullish momentum persists.Gold opened higher in Asia on Monday, continuously hitting new highs, reaching a high near 3970 in the US session, a previously unimaginable high. The Asian session continued its strong performance on Tuesday, reaching near 3977. It is currently experiencing a small pullback, with gains reaching 86 points.
Given the current momentum, it's only a matter of time before it reaches 4000. Currently, the bullish structure of gold remains intact, with prices approaching the 4000 mark. The RSI indicator on the daily chart has crossed above 80, indicating overbought conditions. Bullish momentum continues, with prices slowly rising along the high of the 5-day moving average. Prices on both the 4-hour and daily charts are trading within the upper Bollinger Bands, with the moving averages trending upward.
After a short-term correction on the 1-hour moving average, gold has stabilized and continued to rise. The upward trend of the moving averages indicates continued upward momentum, and any current price corrections are opportunities to enter the market and go long.
Although the current price has exceeded imagination, the trend continues to move upward. It is important to note that stop loss must be strictly enforced.
Trading strategy:
Go long on a price pullback to around 3945, with a stop loss at 3935. Profit range: 3970-3980.

Gold Price Outlook – Trade Setup (XAU/USD)📊 Technical Structure
OANDA:XAUUSD TVC:GOLD Gold (XAU/USD) continues its strong upward momentum, currently trading around $3,974 after printing fresh all-time highs above the $3,950 threshold. On the intraday chart, price action remains within an ascending channel, with immediate support at $3,955–$3,959 (support zone + trendline confluence). If this area holds, bulls may attempt another push toward the $3,990–$3,995 resistance zone, where profit-taking could emerge.
Momentum indicators remain in overbought territory, suggesting the potential for short-term pullbacks before the next leg higher. Failure to defend the $3,955 level could open the door toward $3,930–$3,920, but the broader uptrend structure remains intact as long as price holds above $3,900.
🎯 Trade Setup
Entry (Buy): $3,955 – $3,959 (support zone / channel bottom retest)
Stop Loss: $3,953
Take Profit 1: $3,990
Take Profit 2: $3,995 – $4,000 (psychological level)
Risk–Reward Ratio: ~1 : 5.78
🌍 Macro Background
Gold’s rally is fuelled by political turmoil and safe-haven demand. Japan’s LDP leadership change, France’s government instability, and the ongoing US government shutdown have amplified market uncertainty. Additionally, comments from Fed officials highlight policy caution, with traders still pricing in a 94% probability of an October Fed rate cut.
The Dollar has weakened despite risk aversion, as markets increasingly expect Fed easing to counteract slowing growth and labour market risks. In such an environment, gold remains well-supported, especially with investors hedging against heightened political risk.
🔑 Key Technical Levels
Resistance: $3,990 – $3,995, $4,000 (psychological level)
Support: $3,955 – $3,959
📌 Trade Summary
Gold remains in a strong bullish structure, but intraday charts show potential for pullbacks toward support before buyers step back in. A buy-on-dip strategy near $3,955 looks attractive with upside targets at $3,990 and $4,000. Macro uncertainty continues to favour safe-haven flows into gold, keeping dips well-bid.
⚠️ Disclaimer
This analysis is for reference only and does not constitute trading advice. Trading involves significant risk, and proper risk management is essential.

ElDoradoFx PREMIUM 2.0 – ASIA FORECAST (07/10/2025)Gold (XAUUSD) is trading around 3,961, consolidating after reaching the weekly high at 3,970. The market remains firmly bullish, but momentum has started to slow near the upper boundary of the ascending channel.
The Asian session opens with mixed sentiment — traders are monitoring whether gold will break above 3,970 for continuation or correct toward 3,950–3,940 to gather liquidity.
⸻
🔍 Technical Outlook
Daily Chart (D1):
• The uptrend remains dominant, supported by the 20 EMA and 50 EMA — both widely separated, indicating sustained bullish strength.
• RSI is hovering near 80, confirming overbought conditions but not yet reversing.
• Parabolic SAR remains below price, showing the trend is still intact.
• A close below 3,938 would be the first early sign of cooling momentum; above 3,970, bulls remain in full control.
1H Chart (H1):
• The structure shows consistent higher highs and higher lows since 3,820.
• Price is currently testing the upper trendline resistance of the ascending channel (3,968–3,972).
• MACD remains positive, but histogram bars are flattening — signaling potential consolidation.
• RSI at 70–72 confirms mild exhaustion, suggesting limited upside before a pullback.
• The 20 EMA (3,951) and 50 EMA (3,938) are the nearest dynamic supports.
15M Chart (M15):
• Price action shows tightening range structure with a sequence of short-term BOS (breaks of structure) between 3,956–3,962.
• MACD histogram decreasing, indicating reduced bullish pressure.
• RSI around 65–68 supports potential short-term retracement.
• Immediate support seen at 3,954, with deeper liquidity sitting at 3,944–3,940, which aligns with the Fibonacci zone.
5M Chart (M5):
• The short-term intraday momentum is slowing after repeated rejections around 3,962–3,964.
• Minor bearish divergence spotted between price and RSI, hinting at a temporary pullback.
• The nearest micro-support zones are 3,956, 3,952, and 3,944.
• Short-term structure remains bullish unless 3,940 breaks decisively.
⸻
✨ Fibonacci Golden Zone (Intraday Focus)
From 3,922 swing low → 3,970 swing high
• 38.2% Fib: 3,952
• 50% Fib: 3,946
• 61.8% Fib: 3,940
➡ This defines the Golden Zone between 3,952 – 3,940, ideal for bullish re-entries if price retraces during Asia.
If price bounces from this zone with confirmation, we could see renewed upside toward 3,968 → 3,975 → 3,985.
If the zone fails and 3,940 breaks, deeper correction may follow into 3,925–3,918.
⸻
🎯 High Probability Entries
Buy Setup: Wait for rejection or bullish confirmation in 3,952–3,940 (Golden Zone).
🎯 Targets: 3,962 → 3,970 → 3,975
🛑 SL: Below 3,935 (≈60 pips)
Sell Setup: Short only on clear rejection from 3,968–3,972 resistance zone (double-top / bearish engulfing confirmation).
🎯 Targets: 3,954 → 3,946 → 3,940
🛑 SL: Above 3,975 (≈55 pips)
Intraday / Swing Plays (H1–H4):
• Buy: If 3,940–3,946 holds on retest, looking for continuation toward 3,985–4,000.
• Sell: Break and close below 3,938 opens downside toward 3,918–3,902.
⸻
📅 Fundamental Outlook – Asia Session
No major Asian macroeconomic events expected early in the session.
However, traders should monitor:
• China’s market sentiment (risk appetite or yuan strength often influences gold demand).
• Upcoming US data later in the day: Federal Reserve members speaking and trade balance data could affect USD volatility.
• US Dollar Index (DXY) remains steady around 105.10, showing no major pressure, giving gold space to range or slightly extend gains.
Overall tone remains risk-neutral for the session.
⸻
⚠ Key Levels to Watch
Resistance: 3,962 – 3,970 / 3,975 / 3,985
Support: 3,952 / 3,946 – 3,940 / 3,925 – 3,918
⸻
✅ Summary
Gold remains in a bullish structure but is losing short-term momentum near the top of the channel.
A retracement into the Fibonacci Golden Zone (3,952–3,940) may offer the best high-probability buy setup for continuation toward 3,970–3,985.
If sellers push below 3,940, expect an intraday correction into 3,925–3,918, where fresh liquidity could form for the next bullish leg.
The bias for the Asia session remains bullish but cautious, awaiting reaction near 3,952–3,940 for confirmation.
⸻
🥇 ElDoradoFx PREMIUM 2.0 – PERFORMANCE 06/10/2025 🥇
📊 GOLD TRADES RECAP
✅ BUY +110 pips
✅ SELL +110 pips
✅ BUY +110 pips
✅ SELL +60 pips
✅ BUY LIMIT +150 pips
💰 TOTAL PIPS WON: +540 pips
🎯 RESULT: 5 Wins | 0 SL
📈 ACCURACY: 100 %
🔥 Flawless start to the week!
Strong setups, perfect execution, and consistent profits.
👏 Congratulations if you profited ✅✅✅🚀🚀🚀
FOLLOW US IN YOUTUBE FOR FREE DAILY FORECAST.

Abundant energy. Breaking through 4000?Gold continues its strong bullish trend, and the bullish outlook remains unchanged. Having already broken through the 3900 mark, the upside target could reach 4000.
Based on the cyclical rhythm, we expect continued unilateral gains in the early part of this week (Monday and Tuesday); be wary of a shift to a volatile upward trend or a reversal in the midweek (Wednesday and Thursday); Friday is likely to see a corrective rally, but if a reversal occurs midweek, there is a risk of a sharp correction on Friday.
Technically, gold maintains a healthy upward trend along its short-term moving average on the 4-hour chart. The bottoming out during the US trading session has completed the technical pattern repair, accumulating momentum for further gains. Although the current price is fluctuating at a high level, a new high is inevitable, as similar patterns have repeatedly demonstrated strong breakouts recently. Even if it maintains a high and narrow consolidation in the short term, there is a high probability that it will see a direct rise.
From the 1-hour level, the gold price is temporarily consolidating at a high level, but the small-cycle technical indicators have shown a certain degree of top divergence. This indicates that the short-term trend may continue to fluctuate at a high level and be strong, and we need to pay attention to the opportunity for bullish intervention after the correction. Watch for opportunities to enter the bull market after a pullback. The overall technical structure remains solid and supports a bullish outlook.
Trading Recommendation:
Continue to buy on a pullback to 3945, with a stop-loss at 3935. Profit range: 3970-3980-3990.

Gold Bullish Momentum: Layering Longs For Maximum Gain!🏆 XAU/USD | The Gold Robbery Heist Plan (Swing/Day Trade)
🎯 Plan Setup (Bullish)
Entry (Layering Style):
Using the Thief Layer Strategy 🕵️♂️ → Multiple Buy Limit layers
$3625
$3630
$3635
$3640
(Add more layers based on your own strategy & risk appetite)
Stop Loss (Thief SL):
@3610 (Adjust based on your own strategy & risk ⚠️)
Take Profit (Escape Point):
Target resistance zone @3690 🚪💰
⚡ Note: This is a flexible thief-style plan — adjust SL/TP levels as per your personal money management and execution style.
📊 Why This Plan? (Thief’s Market Analysis)
🔎 Real-Time Market Data (10 Sept 2025)
Price: $3,643.71
24h Change: +0.48%
Range: $3,620.90 – $3,644.56
🧠 Retail Sentiment (Contrarian Signal)
Long: 37%
Short: 63%
➡️ Retail crowd is heavily short → Contrarian bullish setup.
🏦 Institutional Sentiment (Commitment of Traders)
Net Long: +249,530 contracts
Long: 315,796
Short: 66,266
➡️ Institutions are firmly positioned long ✅
🌡️ Fear & Greed + Volatility
Neutral (shifting from Greed)
VIX <14 (52-week low) → Calm market backdrop
📉 Macro & Fundamentals
US jobs data: Weak (22K vs. 75K expected)
Fed rate cut probability: 99.4% (September meeting)
Central bank gold demand + geopolitical tensions supportive
Upcoming CPI/PPI = key catalyst
📐 Technical View
Price holding above $3,625 support
Ascending channel continuation
Overbought zone = caution for short pullbacks
🗝️ Key Takeaways (Thief OG Notes)
USD weakness + Fed dovish tilt = Gold tailwind
Retail shorts = bullish contrarian setup
Institutions backing the move higher
Short-term overbought → manage exits smartly
🔥 Related Markets to Watch
OANDA:XAGUSD (Silver)
TVC:DXY (US Dollar Index)
SP:SPX (S&P 500)
TVC:US10Y (US 10Y Treasury Yield)
BITSTAMP:BTCUSD (Bitcoin correlation check)
✨ “If you find value in my analysis, a 👍 and 🚀 boost is much appreciated — it helps me share more setups with the community!”
#XAUUSD #Gold #Forex #SwingTrade #DayTrading #TechnicalAnalysis #Fundamentals #ThiefStrategy #TradingPlan #GoldBulls #MacroAnalysis #MarketSentiment

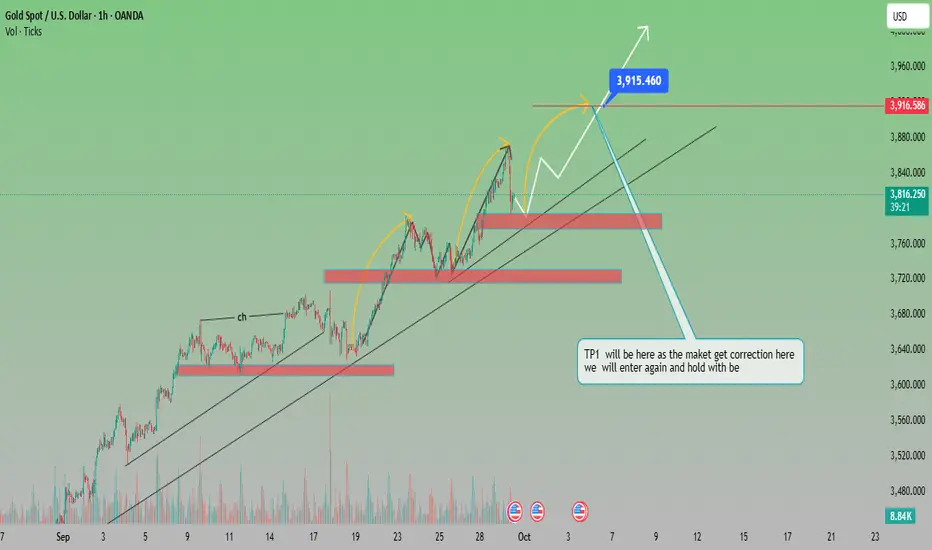
“Gold Price Action: Bullish Momentum with Key Correction Zones
Analysis of XAU/USD (Gold Spot)
The chart shows a clear uptrend channel, supported by higher highs and higher lows.
Price recently pulled back after testing the $3,915 zone, which is acting as a short-term resistance.
Multiple support zones are highlighted (around $3,760 and $3,700), which can provide strong buying opportunities on retracement.
The structure suggests impulse–correction–impulse movement, aligning with bullish continuation patterns.
Bullish Scenario
If price holds above the $3,760–$3,780 support, continuation towards $3,915 (previous high) is expected.
A breakout above $3,915–$3,920 will open the door for further upside, targeting $3,960–$3,980.
Bearish Scenario
If price breaks below the trendline support (~$3,760), deeper correction is possible toward $3,680–$3,640 (TP1 zone).
That zone is mentioned on the chart as a strong re-entry point for long positions.
✅ Suitable Target (Bullish):
Immediate Target: $3,915 (previous high)
Extended Target: $3,960 – $3,980
⚠️ Correction Target (Bearish Pullback):
$3,680 – $3,640 (strong buy zone for re-entry)
Gold Trade Secured 150 PipsSet up played out perfectly. 15m support held followed by a 15m CISD with a retest to secure 150 pips to the upside
www.tradingview.com

6/10/68 : XAUUSD ( US Session )Using it from US Session until 11.00AM , I'll new analysis and update at 12.00PM
Resistance
3959-3964
3949-3954
3943
Support
3932
3921-3927
3911-3916
