Gold is rising strongly. Here's the analysis.From a technical perspective, gold's cyclical trend is bullish. The daily chart has successfully broken out of its previous narrow range, with prices steadily rising along the short-term moving average. The next key factor will be whether a secondary rally can be launched after retracing to the 3900 support level. While the 1-hour chart remains strong, with limited pullbacks, prices continue to rise, but caution is warranted regarding the risk of a pullback after a rapid surge.
Based on the current technical pattern, a short-term bullish outlook is maintained, but a buy-on-dip strategy should be prioritized. Gold prices strongly broke through the previous key resistance level of 3900 in early Asian trading, which has now become a significant support level. An ideal long position would be to wait for prices to fall back to around 3915. If this area finds effective support and signals of stabilization emerge, this would be a relatively safe entry point.
As for upside targets, the primary focus is on the 3960 resistance level. A successful breakout would open up potential for higher prices. It's important to emphasize that when market sentiment is euphoric and prices continue to rise, volatility intensifies, significantly increasing the risk of chasing the rally. From the overall trend, the medium- and long-term upward momentum of gold still exists, but technical corrections need to be handled with caution in the short term. The core strategy is to rely on key support to find low-long opportunities.
Xauusdsignal

ElDoradoFx PREMIUM 2.0 – LONDON FORECAST (06/10/2025)Gold is trading around 3,946, pushing strongly upward after breaking out of last week’s consolidation zone. Buyers are firmly in control, supported by momentum across all intraday timeframes. Price is now testing a critical resistance area near 3,949–3,952, aligning with the upper boundary of a long-term ascending channel.
⸻
🔍 Technical Outlook
Daily Chart (D1):
The bullish trend continues strongly, with price maintaining distance above both the 20 EMA and 50 EMA, showing clear market strength.
• RSI is at ~79, indicating overbought conditions but not yet a confirmed reversal.
• The daily structure remains intact unless price closes below 3,876.
• Any dip into 3,920–3,910 may serve as a healthy pullback before continuation.
1H Chart (H1):
Price action shows clean structure — after a Break of Structure (BOS) at 3,886, gold has rallied impulsively.
• MACD histogram and signal lines remain strongly bullish.
• RSI sits around 74, confirming strong buying momentum.
• Nearest dynamic supports: 3,933, 3,925, and the 20 EMA at 3,918.
• Key resistance: 3,949–3,952, where we may see a short-term reaction or rejection.
15M Chart (M15):
Momentum remains bullish, but candles show early signs of exhaustion near resistance.
• MACD histogram is flattening but still positive.
• RSI is near 70, suggesting possible intraday correction before another push.
• Structure: Higher highs and higher lows remain consistent.
• Watch for a potential retest toward 3,933–3,931, which is the nearest Fibonacci 38.2% retracement from the last impulse.
5M Chart (M5):
The short-term trend remains bullish with a sequence of micro higher highs and clean BOS confirmations.
• Support levels to monitor: 3,940 → 3,933 → 3,925.
• MACD shows deceleration, implying price may temporarily consolidate before the next leg.
• Price above all EMAs (20 / 50 / 200) confirms strong buyer control.
⸻
✨ Fibonacci Golden Zone
The latest impulse leg on the M15 chart, from 3,922 (swing low) to 3,949 (swing high), places the Fibonacci Golden Zone (0.618–0.65) between 3,933–3,930.
➡ Scenario A – Bullish Continuation:
If gold retests this golden zone and finds support, expect renewed buying pressure with targets 3,949 → 3,960 → 3,972.
➡ Scenario B – Bearish Intraday Correction:
Failure to hold 3,930 could trigger deeper retracement into 3,918–3,910, still within the larger bullish structure.
⸻
🎯 High Probability Entries
🔹 Scalping (M5–M15, ≤ 60 pips SL):
• Buy Setup: Look for bullish confirmation (hammer/engulfing) near 3,933–3,930 (Fib Golden Zone).
🎯 Targets: 3,945 → 3,949 → 3,960
🛑 SL: Below 3,925 (≈60 pips)
• Sell Setup: Short only if price forms a double-top or bearish engulfing at 3,949–3,952 resistance.
🎯 Targets: 3,933 → 3,925 → 3,910
🛑 SL: Above 3,955 (≈55 pips)
🔸 Swing / Short-Term Intraday:
• Buy: On retracement to 3,925–3,918, if price respects structure and holds the EMA support.
🎯 Targets: 3,949 → 3,972 → 3,985
🛑 SL: Below 3,910
• Sell: Only if a confirmed break and retest below 3,918, which could open room for 3,902–3,886.
🛑 SL: Above 3,926
⸻
📅 Fundamental Outlook – London Session
No major UK or EU economic data during the morning session.
However, upcoming US Fed speeches and ISM services data later today could create volatility in the NY session.
• Hawkish Fed tone → bearish for gold (USD strength).
• Dovish tone or weak ISM data → bullish for gold (USD weakness).
DXY currently stable near 105.2, while yields show mild retracement — slightly supportive for gold intraday.
⸻
⚠ Key Levels to Watch
Resistance: 3,949 – 3,952 / 3,960 / 3,972
Support: 3,940 / 3,933 – 3,930 / 3,918 – 3,910
⸻
✅ Summary
Gold remains in a strong uptrend with price nearing overbought intraday conditions.
A pullback into the Fibonacci Golden Zone (3,933–3,930) may offer the best high-probability buy opportunity toward 3,949–3,972, as long as the structure holds above 3,918.
If sellers reject strongly at 3,949–3,952, expect short-term correction back to 3,933–3,925, providing new liquidity for the next bullish impulse.

XAUUSD will delivered $4000 target XAUUSD is still maintaining the bullish after grabbing liquidity on last Friday sweeps at 3850-3855 structure zone. I will buy gold on every dip till my Traget 4000!
What will I do Today?
✅️ My First buying will be start from 3900-3890 area as Market has to respect the previous BOS on rising channel.
✅️Secondly my buying area will be 3950 zone if H4 candle closes above it.
-My target will be $3990 & 4020 In extension !!

ANFIBO | XAUUSD - Trend is Friend, Buy and Win [02.10.2025]Hello, Anfibo's here!
We’ve been winning all week mainly with buy orders following the trend. That’s why the saying “trend is your friend” is so important.
OANDA:XAUUSD Analysis – Daily Trading Plan
Overall Picture:
OANDA:XAUUSD continues to print new ATHs, reaffirming the undeniable strength of the current bullish trend. Our buy zone around 3860 – 3870 yesterday has already delivered about 200 PIPS in profit, a clear validation of staying aligned with the dominant momentum.
With global geopolitical tensions still unresolved, safe-haven flows remain strong, keeping demand for gold intact. Unless major negative news arises, gold is likely to continue conquering new highs in both the short and medium term.
The strategy remains straightforward: favor the buy side over sell side until the trend structure is decisively broken.
Technical Outlook
Short-term trend: Strong bullish continuation on both H4 and Daily timeframes.
Momentum: Healthy and sustainable, with steady higher highs and higher lows.
SUPPORT KEY / BUY ZONES: 3855 - 3840 - 3834 - 3816 - 3800
RESISTANCE KEY / SELL ZONES: 3890 - 3904 - 3918 - 4000
Trading Plan Today
>>> BUY ZONE:
ENTRY: around 3840
SL: 3830
TP: 3890 - 3915 - ATH
>>> SELL ZONE:
ENTRY: 3920 - 2915
SL: 3930
TP: 3870 - 33840
Risk Management
- Favor long trades in line with the prevailing trend; sell setups only for intraday scalps at key resistances.
- Keep a Risk:Reward ratio ≥ 1:2.
- Control position sizing and avoid overtrading during consolidation phases.
- Stay alert to global news headlines, as unexpected geopolitical updates may trigger high volatility.
TODAY IS YOUR DAY ;)

XAU/USD Bullish Setup ( Nfp )This chart analysis of XAU/USD (Gold vs US Dollar, 1H timeframe) highlights a bullish setup supported by an upward trend line. Price is currently trading around 3858, just below the resistance zone near 3873 – 3897.
Support: The rising trend line is acting as a key support, keeping the bullish structure intact.
Resistance Levels: First resistance is at 3873, followed by 3897 (ATH level).
Target: If price breaks above these resistance zones, the next upside target is projected at 3937.
Scenarios: The analysis suggests multiple bullish continuation paths, with price expected to retest resistance before pushing higher toward the target.
Overall, as long as gold respects the support trend line, the bias remains bullish with potential growth toward 3937.

Gold FOMO Surge – 1000-Pip Buy Chance Ahead!GOLD PLAN FOR 06.10 | Captain Vincent
✳️ Hello to all traders,
Today, we are not only analyzing Gold (XAU/USD) from a purely technical perspective ⚙️, but also witnessing the perfect confluence between technicals and fundamental news. A price surge storm is forming, promising exciting trading opportunities.
📊 1. Technical Analysis: Sustainable Uptrend Structure
Technically, the uptrend of Gold on the H1 frame is indisputable.
🔹 Break of Structure (BoS):
Gold continuously breaks previous highs, indicating that buying pressure is completely overwhelming.
Each BoS point is a clear affirmation of the strength of the uptrend.
🔹 Potential Demand Zone:
After each surge, the price often takes a "rest" to accumulate.
Currently, the price may adjust to the $3,883,020 - $3,905,169 zone, where the confluence between the Fair Value Gap (FVG) and Bullish Order Block (Bullish OB) – creates an ideal launchpad for the next surge.
🏦 2. Fundamental Analysis: The Fire Has Been Ignited
If technicals show the way, then fundamental news is the fuel propelling the uptrend.
🔸 U.S. Government Shutdown:
This event creates political and economic instability, causing capital to flee from risky assets.
Gold – the number 1 safe haven – is directly benefiting as investors seek to preserve assets.
🔸 Fed Ready to Cut Interest Rates:
The market is almost certain that the Fed will cut interest rates by 0.25%.
This reduces the appeal of the USD, further strengthening Gold's advantage, which is a non-interest-bearing asset.
🔸 "Thirst" for Economic Data:
The government shutdown also disrupts the release of important economic data, leaving the market lacking information and increasing uncertainty.
In this environment, Gold continues to maintain its role as a safe haven.
🎯 3. Comprehensive Trading Plan
When technicals and fundamentals align, the reliability of the trading strategy is significantly enhanced.
Strategy:
Wait to buy (Long) when the price adjusts to the demand zone $3,883,020 - $3,905,169.
Entry signals:
Observe confirmation of a bullish reversal in this zone such as:
Pin bar candles, engulfing
Or BoS on the M15 frame
Targets:
Short-term: $3950 – $3990
Long-term: Target “+1000 pips”
Risk management:
Place Stop Loss below the Bullish OB zone to protect the account.
🧭 Conclusion
The current market sentiment is very favorable for the Buyers:
USD is under downward pressure
Defensive capital flows strongly into Gold
The FOMO effect may stimulate an extended rally
The combination of solid technical structure and strong fundamental support is creating an almost perfect bullish picture.
👉 Be patient, stick to the plan, and await this golden opportunity.
💼 Wishing you all an effective and victorious trading day!

New ATH: Shutdown Fuels Gold's Seventh Straight WinHello, traders!
Gold just sealed its seventh consecutive weekly gain, with futures hitting $3,908.9/oz. The rally is fueled by growing concerns over the US Government Shutdown and the near-certain expectation of a Fed rate cut (97% chance in October).
Fundamentals & Outlook
Political Instability: The prolonged Shutdown is a stable bullish factor, delaying economic reports and attracting massive safe-haven capital.
Rate Cut Certainty: The market considers a Fed rate cut almost guaranteed, providing strong support for non-yielding Gold.
Technicals & Trading Strategy
Weekly buying power is extremely strong. Gold is consolidating near $3900. The $3867 level is critical; if the price holds above it, the potential for new ATHs remains very high.
Key Price Levels:
Resistance: $3902, $3912, $3922, $3942
Support: $3867, $3855, $3839, $3792
Trading Strategy (Absolute Risk Management):
BUY ZONE 1: $3867 - $3865
SL: $3857
TPs: $3875, $3885, $3895, $3905, $3915
BUY ZONE 2: $3839 - $3827
SL: $3824
TPs: $3847, $3857, $3867, $3877, $3887
SELL ZONE 1: $3902 - $3904
SL: $3912
TPs: $3894, $3884, $3874, $3864
SELL ZONE 2: $3942 - $3944
SL: $3952
TPs: $3934, $3924, $3914, $3904
Will the US government tensions help Gold definitively breach the $3900 level next week? 👇
#Gold #XAUUSD #ATH #Shutdown #Fed #TradingView #InterestRates

6/10/68 : XAUUSD ( Europe / London Session )Using it from Europe Session until 7.00PM , I'll new analysis and update at 8.00PM
Resistance
3960-3965
3950-3955
3945
Support
3934
3924-3929
3913-3919

Gold Price Outlook – Trade Setup (XAU/USD)📊 Technical Structure
OANDA:XAUUSD Gold (XAU/USD) surged toward $3,924 before encountering resistance near the $3,950 zone, which aligns with an extended overbought condition on the short-term charts. Price remains supported by the ascending trendline from September lows, with immediate demand located around $3,878–$3,887.
If bulls defend this support zone, a fresh rebound toward $3,942 → $3,950 resistance is likely.
A rejection from the resistance zone could trigger consolidation or a pullback back toward the $3,878 support.
🎯 Trade Setup
Entry: Buy near $3,878–$3,887 (support zone retest)
Stop Loss: $3,875
Take Profit 1: $3,942
Take Profit 2: $3,950
Risk/Reward: ~1 : 5.16
🌍 Macro Background
Gold remains underpinned by Fed rate cut expectations, with markets pricing a 99% chance of a 25bps cut at the October meeting. The ongoing US government shutdown has delayed key macro data, intensifying safe-haven demand.
Hawkish remarks from Dallas Fed’s Logan briefly supported the US Dollar, but the market consensus points toward further easing.
Political uncertainty in Washington, combined with fragile labour market signals (ADP showing -32k jobs, ISM Services PMI down to 50), continues to support the bullish bias for gold.
🔑 Key Technical Levels
Resistance: $3,942 / $3,950
Support: $3,878 / $3,887
📌 Trade Summary
Gold remains technically bullish above $3,878 support, with near-term upside toward $3,950 as long as Fed rate cut expectations dominate sentiment. Any decisive break below $3,875 would neutralize the bullish bias and open a correction toward $3,820.
⚠️ Disclaimer
This analysis is for reference only and does not constitute trading advice. Trading involves significant risk, and proper risk management is essential.

10/ 6: Sell High and Buy Low Within the 3893–3946 RangeGood morning everyone!
Today is the traditional Chinese Mid-Autumn Festival, a day when families gather to enjoy mooncakes, admire the moon, and share the joy of family. This day symbolizes reunion. I also wish you all a happy family and everything goes well!
Gold has broken through the psychological barrier of 3900. Congratulations to those who seized this opportunity!
The price has now risen to around 3920. On the weekly chart, there is technically room for further gains. However, as prices rise, pullbacks are inevitable, making support crucial.
Currently, based on the 1H chart, support is found near 3908, followed by 3900/3893, and finally 3886.
For future trading, consider buying low and selling high around the 3893-3943 area. Maintain a good rhythm and pay close attention to the support levels mentioned above.

ElDoradoFx PREMIUM 2.0 - ASIA FORECAST - 06/10/2025Gold is trading around 3,886, holding just under the recent swing high (3,896–3,894) after a bullish continuation. The market is consolidating in a tight range while buyers defend support and await new catalysts.
⸻
🔍 Technical Outlook
Daily Chart (D1):
• Strong bullish structure intact, with price above the 20 EMA (3,846) and 50 EMA (3,791).
• RSI (78) → near overbought, suggesting limited upside unless momentum strengthens.
• Daily candle shows slowing momentum; still bullish but vulnerable to retracement if 3,862 fails.
1H Chart (H1):
• Price consolidating between 3,880–3,896 resistance and 3,862 support.
• MACD is positive but flattening, showing buyers losing short-term strength.
• Market structure: higher highs remain intact; 3,862 is the intraday key breakout/rejection zone.
15M Chart (M15):
• Price rejected 3,889–3,896 zone twice, creating short-term equal highs.
• A base is forming around 3,883–3,880. If broken, correction may extend toward 3,870.
• RSI ~55 → neutral, but momentum fading on lower TFs.
5M Chart (M5):
• Buyers defending 3,883, forming higher lows.
• Resistance remains at 3,889–3,896.
• Short-term indicators show mixed signals: MACD flattening, RSI ~58, suggesting potential breakout but risk of rejection if liquidity isn’t strong.
⸻
✨ Fibonacci Golden Zone
From 3,843 low → 3,896 high, the golden retracement sits at 3,870–3,862.
• If Asia session pulls back into this zone and holds, high probability for bullish continuation.
• A clean break below 3,862 = shift in structure toward deeper retracement (3,843 → 3,820).
⸻
🎯 High Probability Entries (Not Scalping – Asia Focus)
Bullish Setup:
• Buy if price retests and holds 3,870–3,862 golden zone, target 3,889 → 3,896 → 3,910.
• SL below 3,855 (50–55 pips).
Bearish Setup:
• Sell only if price rejects 3,889–3,896 zone again with bearish confirmation.
• Target 3,870 → 3,862.
• SL above 3,902 (60 pips).
⸻
📅 Fundamental Outlook – Asia Session
• No major Asian data expected today.
• Market will position for US ISM PMI & Fed speakers later → possible volatility in NY.
• DXY remains firm near recent highs; if USD strengthens further, gold may face rejection under 3,896.
⸻
⚠ Key Levels to Watch
• Resistance: 3,889 – 3,896 / 3,910
• Support: 3,880 / 3,870 – 3,862 / 3,843
⸻
✅ Summary
Gold remains bullish overall, consolidating below 3,896 resistance. The golden zone 3,870–3,862 is the key for continuation; if it holds, expect buyers to push back toward 3,896 → 3,910. However, repeated rejection under 3,896 could trigger a correction into 3,870 → 3,862.

GoldXau usd daily analysis
Time frame 4hours
Long position Risk rewards ratio=1.5👈Short position Risk rewards ratio>4.2👈

XAUUSD H1 OUTLOOK , READY TO GOLD HIT 4000 Gold Buy Setup Looking.
Ifvg And TL Breakout
Buying zone trend line and ifvg
Target will be 4000$
Good Luck Guys

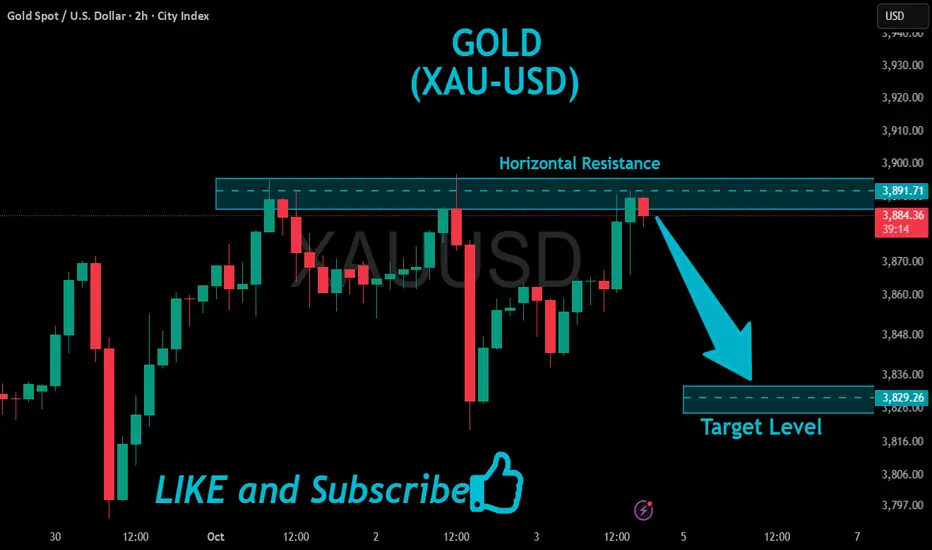
GOLD (XAUUSD): Get Ready For Breakout
Gold closed, approaching a strong horizontal resistance based on a current
All-Time High.
Following a bullish accumulation, there is a high chance that the underlined
structure will be broken, and the price will go higher.
Wait for a 4H candle close above 3897 as a confirmation,
expect a bullish continuation to 3920 then.
❤️Please, support my work with like, thank you!❤️
I am part of Trade Nation's Influencer program and receive a monthly fee for using their TradingView charts in my analysis.

XAU/USD Near Record Highs: Key Data AheadGold (XAU/USD) Technical Outlook – October 3, 2025
1. Macro & News Context
Gold is holding near record highs, heading for its seventh consecutive weekly gain, supported by expectations that the Federal Reserve will continue cutting rates and by concerns around the ongoing U.S. government shutdown. Spot prices have recently tested the $3,890–3,900 region and are now consolidating around $3,860.
Nonfarm Payrolls (NFP) – Typically scheduled for 08:30 ET / 12:30 UTC on the first Friday of the month, the September jobs report is likely to be delayed due to the U.S. government shutdown.
Key event to watch today:
ISM Services PMI (September) will be released at 10:00 ET / 14:00 UTC. Since ISM data is privately produced, it will be published regardless of the shutdown and may serve as the main volatility catalyst in today’s U.S. session. 【ISM】
Labor market signals: Challenger job cut data showed lower layoffs in September, but planned hiring at the lowest level since 2009, reinforcing a softer employment backdrop. Combined with the Fed’s recent 25 bps rate cut (to 4.00%–4.25%), this continues to support the bullish gold narrative.
USD trend: The dollar has weakened broadly this week, aligning with market bets on further monetary easing. This backdrop provides an additional tailwind for gold.
2. Technical Landscape (H1 Chart)
The attached chart highlights key technical zones and a completed Harmonic XABCD pattern on the 1H timeframe:
Support levels:
Near-term: $3,844–3,841
Deeper: $3,827 (intraday pivot), $3,792 (strong low)
Strategic: $3,764–3,770 (Bullish Order Block)
Resistance levels:
Immediate: $3,865
Strong supply: $3,880–3,890 (Bearish Order Block)
Extended target: $3,930–3,940 (Sell Scalping | Fibo zone)
Momentum: After bouncing from point D of the harmonic structure, gold has been forming higher lows (HL). Price currently sits above the longer-term moving average and is testing the shorter-term average, suggesting a constructive short-term bias as long as supports hold.
3. Trade Scenarios
Scenario 1 – Buy-the-dip (preferred bias)
Entry zone: $3,844–3,841
Stop loss: Below $3,827 (safer: below $3,792)
Targets:
$3,865 (first take-profit)
$3,880–3,890 (major supply)
Stretch: $3,930–3,940
Rationale: Higher low formation, bullish macro backdrop, aligned with strong weekly uptrend.
Scenario 2 – Countertrend short at resistance
Trigger zone: $3,880–3,890 (Bearish OB)
Confirmation: Rejection candles (H15–H1) such as wicks, engulfing, or failed breakout.
Stop loss: Above $3,895–3,900 (or above $3,945 if price spikes into the $3,930–3,940 fib zone).
Targets: $3,865 → $3,844 → $3,827
Rationale: Potential liquidity sweep ahead of ISM, with profit-taking likely near supply zones.
Scenario 3 – Breakdown through support
Trigger: 1H close below $3,841
Path: $3,827 → $3,792 (Strong Low) → $3,764–3,770 (Bullish OB)
Rationale: Loss of intraday structure would flip bias short until major demand zones.
4. How to Trade Around Today’s Data
If NFP is indeed delayed, the 08:30 ET / 12:30 UTC slot may bring limited volatility.
Focus instead on the ISM Services PMI at 10:00 ET / 14:00 UTC, which could trigger sharp swings in both USD and gold.
Adjust position sizing: Expect spread widening and slippage around the release. Reduce leverage or scale into positions.
5. Risk Management
Limit risk per trade to 0.5–1% of account equity.
Avoid chasing price once levels are tested; wait for H15–H1 candle closes for confirmation.
Monitor the U.S. Dollar Index (DXY) and Treasury yields – further dollar weakness would reinforce bullish gold setups.
🔑 Key Takeaway
Gold remains structurally bullish in the broader trend, with immediate support at $3,841–3,844 critical to maintain upside momentum. Watch for reactions around $3,880–3,890 and $3,930–3,940. With NFP possibly delayed, the ISM Services PMI at 10:00 ET / 14:00 UTC will be today’s most important catalyst for directional moves.

Gold XAUUSD: Double Top, Volume Profile, and VWAP Trade Plan📊 Gold (XAUUSD) has been trending higher overall, but recently formed a double top followed by a significant retracement ⚡. Despite that, price action is now beginning to show signs of a shift in structure back to the upside 📈.
🔎 In the video, we review both the VWAP and the anchored volume profile as part of the trade plan. For a potential long setup, I’ll be watching for price to break above the volume profile’s Point of Control (POC) 🎯.
❌ However, if price were to break below VWAP, that would invalidate the idea and I’d step aside until the next opportunity arises.
⚠️ Disclaimer: This analysis is for educational purposes only and not financial advice. Always manage risk appropriately.

Gold is strong. Analysis for next week.Gold rose slightly to around $3,886 in US trading on Friday, attempting to recover some lost ground. This followed a sharp correction on Thursday, with gold prices plummeting after reaching a record high of $3,896.60. The price fluctuated nearly 2% daily, ultimately closing slightly lower.
From the current technical perspective, gold's overall bullish trend remains intact. The trading strategy remains focused on buying on dips, avoiding chasing rallies. On the daily chart, gold prices are trading firmly above the 5-day and 10-day moving averages, maintaining a strong technical outlook. The 4-hour chart shows a narrowing of the Bollinger Bands, suggesting that gold prices may enter a period of high-level fluctuations rather than a one-way rally on Friday. Key resistance above is around $3,900, while initial support below is $3,850.
For next week's trading, we need to adapt to the rhythm of gains in the Asian and European sessions, followed by pullbacks and subsequent gains in the US session. Until a fundamental trend reversal occurs, every technical pullback is considered an opportunity to position for long positions. In the short term, we should focus on a breakout above the 3900 high. A successful breakout would open up new upside potential; conversely, a prolonged failure could lead to continued volatility.
Overall, the key strategy remains bullish, but caution should be exercised against the risk of a market whipsaw amidst high volatility. Patiently waiting for a low entry point after a pullback is a more prudent approach.

Gold Correction: Fed Warning vs. Massive Safe-Haven FlowsHello, traders!
Gold pulled back to $3,845.78/oz after Dallas Fed President Lorie Logan called for caution regarding further rate cuts.
Fundamentals: Fed Warns, But the Buying Wave is Unstoppable
The market stands at a crossroads:
Downward Pressure: The caution signal from Fed's Logan.
Upward Momentum: Government shutdown (increases instability, delays jobs report), weak private sector jobs data (down 32k), and SPDR Gold Trust ETF holdings rising to the highest level since 2022.
Conclusion: Political instability and weak economic data continue to reinforce the likelihood of a Fed rate cut. Massive safe-haven capital is flowing into Gold.
Technical Analysis & Strategy
Gold retreated to the FIBO 0.618 - 0.5 zone, indicating a healthy technical correction after the sharp rally. Priority remains Buy if the price holds above $3861. Be cautious of Stop Loss hunting.
Resistance: $3870, $3884, $3894
Support: $3855, $3833, $3798
Trading Strategy (Tight SL):
BUY SCALP: $3838 - $3836 / SL: $3832 / TP: $3846 - $3857
BUY ZONE: $3798 - $3796 / SL: $3788 / TP: $3816 - $3836
SELL ZONE: $3888 - $3890 / SL: $3898 / TP: $3870 - $3850
Do you think the Fed's warning is strong enough to reverse this trend? 👇
#Gold #XAUUSD #Fed #GovernmentShutdown #TradingView #PhânTíchVàng #ETF

GOLD Risky Short!
HI,Traders !
#GOLD grew up fast
But then hit a horizontal
Resistance level of 3891.71
From where we are already
Seeing a nice pullback
And we will be expecting
A further local move down !
Comment and subscribe to help us grow !
XAU/USD: Bullish Continuation Builds Within Upward ChannelXAU/USD continues to hold its structure inside the upward channel, recently rebounding from trendline support near 3,845. Price action is forming a series of higher lows, with bullish momentum strengthening after a breakout above equal highs, pointing toward the 3,923 resistance level.
As long as the price remains above 3,844, the bullish bias stays intact, supporting continuation toward the 3,940–3,960 target zone within the channel. Momentum favors buyers, with the broader trend still aligned to the upside.

Gold rises. Latest analysis.Key Points:
With the federal government shutdown, Trump's consideration of firing federal employees has dampened risk appetite. The White House said the layoffs will begin soon, and Trump plans to meet with White House budget director Russell Vought to discuss the cuts.
The government shutdown has halted the release of US economic data, and Fed officials' speeches have become a substitute for data, with every statement being over-interpreted by the market.
The non-farm payroll data failed to be released as scheduled, marking the first time since 2013 that a government shutdown has delayed the release of key data, further increasing market uncertainty about the economic situation and Fed policy.
Market Analysis:
Although gold prices retreated during the European session, the factors supporting the long-term uptrend remain intact. From the 4-hour chart, the current important support level is at the 38603865 area where the MA5, 10 and 20 moving averages intersect. Although the RSI14 period indicator fell slightly, it still remained above the midline. Judging by the indicator data, any dip in price is likely to be bought quickly.
Due to the data blank period on Friday, the price is likely to remain volatile at a high level today. Quaid recommends that you wait and see for a short period of time. Consider a small long position if the price pulls back to around 3860.

Gold Trade Set Up Oct 3 2025Price dropped heavily yesterday making a LL but bounced up 400+ pips so i will be waiting to see if price can close above this 15m CISD, retest it to target 75 FIb before continuing its bearish trend
www.tradingview.com

Non-farm payrolls delayed? Here's the analysis.Due to the government shutdown, the U.S. Bureau of Labor Statistics is not expected to release the non-farm payrolls report on Friday. However, several recent private sector indicators suggest weak hiring, limited layoffs, modest wage growth, and easing labor demand in September. This data generally aligns with the low hiring and low layoff trends observed before the government data release was suspended.
Even without the non-farm payrolls report, the market can still get a general sense of the labor market situation, allowing the Fed to confidently proceed with a rate cut later this month.
At the same time, combined with the MACD indicator, the downward cross formed far above the zero axis indicates that the upward momentum has weakened and the price is in a correction phase. In the short term, watch for signs of slowing in the decline; if the correction breaks below 3793, the trend could quickly shift to a downtrend.
Looking at the 1-hour level, with the sharp drop on Thursday, the overall trend is moving down from high to low and creating a new low, indicating that the 1-hour level trend has begun to fall. Short-term support is at the 3860-3865 area, which has been a significant resistance level for gold.
If the price cannot break through 3865 strongly, it will still usher in a trend of correction. At the same time, we should pay close attention to whether the non-farm data can be released as scheduled.
Before the non-farm payroll data release, if the price corrects to around 3830, consider a small long position, waiting for the data release.
