XAU/USD – Buy Setup from Support Zone Targeting 39451. Trend Direction:
Price is moving inside an ascending channel (bullish structure).
Higher highs and higher lows confirm the uptrend.
2. Support Zone:
Marked between 3820 – 3800 USD, a strong demand area where buyers previously stepped in.
3. Entry Point:
Suggested Entry: ~3821 USD
This aligns with the support retest inside the channel.
4. Stop Loss:
Around 3794 USD, just below the support zone.
This protects against false breakouts to the downside.
5. Target Point:
3945 USD (channel resistance).
This gives nearly +120 pips potential upside.
---
Risk/Reward Analysis
Risk: ~27 points (3821 → 3794).
Reward: ~124 points (3821 → 3945).
R:R Ratio: ≈ 1:4.5 → very favorable.
---
Overall Analysis
Market is bullish inside the channel.
Best trade setup: Wait for price to retest support (3820–3800) and then buy.
As long as support holds, price has high probability to reach the target zone (3945).
If support breaks, trend may weaken, and gold could move lower outside the channel.
📌 Conclusion:
This is a buy-the-dip setup with strong reward-to-risk. Patience is key → wait for confirmation bounce from support before entering.
Xauusdsignal

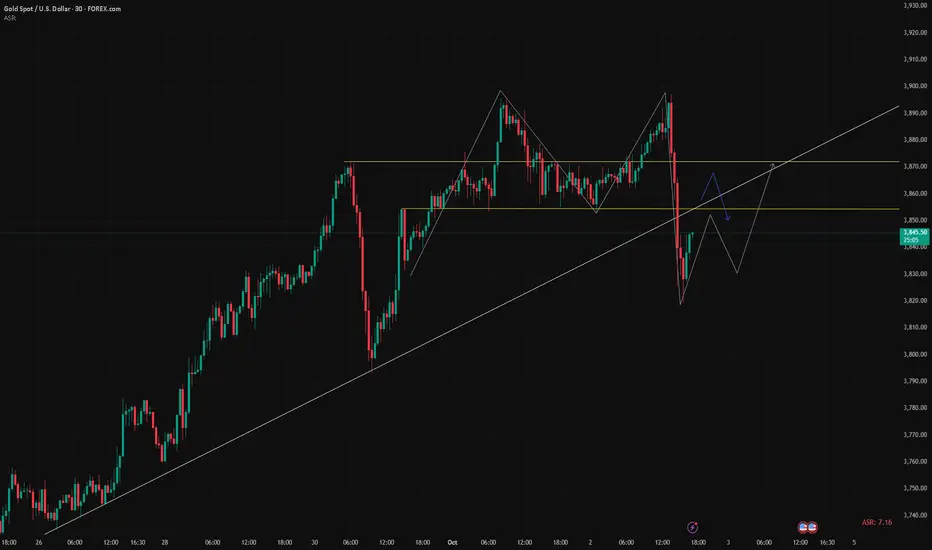
Gold: Start for a Meaningful Correction?Since Monday, I’ve been writing about the high probability of a correction after Gold’s impressive rise that started on 20 August.
My point was simple: even the strongest bullish trends are not one-way streets — retracements are part of the journey.
Yesterday proved that idea once again. After initially finding support near the 3860 zone, Gold staged a weak bounce, even printing a fresh but fragile ATH.
However, that move was quickly reversed as sellers stepped in aggressively, triggering four consecutive hours of selling, almost a mirror image of Tuesday’s drop.
From the local low at 3818, Gold managed a rebound and, at the time of writing, trades around 3846 — a natural recovery after such a sharp decline.
________________________________________
The Bigger Picture
The broader trend is undeniably bullish, and I don’t expect that to change anytime soon. But a more meaningful correction looks increasingly likely in the coming days.
Why do I call it meaningful? Because if we zoom out on the daily chart, we see that since late August, Gold has been in a near straight-line rise. Apart from a two-day pullback in mid-September and a minor setback on the 24th, every dip has been shallow, intraday, and quickly erased.
This type of price action cannot last forever. Markets need breathers, even in uptrends.
________________________________________
Key Technical Levels
• Resistance: The 3900 zone now acts as a strong ceiling, capping bullish attempts.
• Support: Bears could eye the 3790 zone first, with the potential for a deeper move toward 3700 if pressure intensifies.
________________________________________
Trading Plan
The strategy, in my view, remains unchanged: sell rallies until a proper correction develops.
The big trend is still bullish — but even bulls must allow the market to breathe. 🚀

Gold Stalls? A Deep Dive Analysis.Key Points:
Why Gold Rallied: Gold has been one of the strongest-performing commodities recently, driven by continued central bank buying and expectations of further Fed rate cuts.
Why Gold Fell: Lori Logan's call for caution on further rate cuts weighed on gold. Markets are cautious about whether the Fed will take more aggressive easing measures at its next meeting.
The government shutdown entered its second day, potentially delaying the release of key economic data, including the non-farm payrolls (NFP) report scheduled for Friday. The weekly initial jobless claims report, which was supposed to be released on Thursday, also failed to be released as scheduled.
Market Analysis:
Gold's current performance is significantly influenced by news. While the medium- to long-term upward trend remains unchanged, short-term bullish and bearish swings are often volatile, with significant fluctuations. Therefore, timely adjustments to market conditions are necessary.
The 1-hour chart shows that the short-term pressure is around 3860-3865. Only by breaking through and stabilizing above this position will there be momentum to continue to attack higher points. If this level is unable to hold, gold could fall further to test the key support at 3820. During the Asian session, traders should focus on 3865 as a key level for determining the direction of the market.
Trading Strategy:
Short at 3865, stop loss at 3875, target range 3845-3820.

Safe-Haven Demand Keeps Gold on Fire🔶 Gold Price Outlook – Trade Setup (XAU/USD)
📊 Technical Structure
Gold retreated after touching fresh highs, now consolidating between $3,844–$3,860. The chart shows repeated bounces from the ascending trendline support, suggesting buyers remain active. Key resistance stands at $3,881–$3,886, and a breakout above could open the way to $3,900 psychological level. The short-term bias remains bullish as long as support holds.
🎯 Trade Setup
Entry: $3,837–$3,843 (long)
Stop Loss: Below $3,833
Take Profit:
TP1: $3,881
TP2: $3,886
TP3: $3,900
Risk/Reward: 1 : 4.21
🌍 Macro Background
Gold remains supported by macro factors:
Fed Policy: Despite hawkish remarks from Dallas Fed President Logan warning about persistent inflation, markets are still pricing in a 99% chance of a 25bps rate cut in October. The USD has rebounded slightly, but overall sentiment remains bearish for the dollar.
Government Shutdown: The ongoing US government shutdown suspends official BLS data releases. However, September’s NFP figures are expected to be published, keeping labour market focus alive.
Labour Market: ADP report showed a surprise drop of -32K private payrolls, adding pressure on the Fed to cut rates.
Safe-Haven Demand: Rising geopolitical tensions and fiscal uncertainty continue to fuel safe-haven inflows into gold.
Despite intraday pullbacks, fundamentals remain gold-supportive.
🔑 Key Technical Levels
Resistance: $3,881 / $3,886 / $3,900
Support: $3,843 / $3,837
📝 Trade Summary
Gold is consolidating but holding critical support. As long as price sustains above $3,837, bulls retain control. The suggested long entry near $3,843 targets the $3,881–$3,886 area.
⚠️ Disclaimer
This analysis is for reference only and does not constitute trading advice. Trading involves significant risk, and proper risk management is essential.

ElDoradoFx PREMIUM 2.0 – ASIA GOLD FORECAST🥇 XAUUSD – Asia Session Outlook (03/10/2025)
🔎 Market Context
Gold rejected 3890–3896 highs yesterday, triggering a sharp selloff to 3820 before rebounding toward 3855–3860. Price is now consolidating in the Fibonacci golden zone (3855–3865) – a key battleground for bulls and bears.
⸻
📊 Technical Outlook
• Daily trend: Still bullish, but showing exhaustion after multiple failed breaks above 3890.
• H1 structure: Lower highs remain intact unless 3875 is broken.
• Liquidity zones:
• Buy stops above 3875–3890
• Sell stops below 3830–3820
Indicators:
• RSI (M15): Neutral around 50 – no clear momentum edge.
• MACD (M5/M15): Bearish pressure fading, divergence forming.
• Moving Averages (H1): Price retesting short-term averages, acting as dynamic resistance.
⸻
⚡ Asia Session Scenarios
1. Base case (high probability):
Rejection at 3860–3865 → drift lower toward 3840–3830 liquidity.
2. Alternative case (lower probability in Asia):
Break & hold above 3875 → opens squeeze toward 3890.
3. Support play:
Bounce from 3830–3835 → intraday recovery back to 3855–3860.
⸻
🎯 High-Probability Scalping Setups (max 60 pips SL)
• Sell bias: 3860–3865 rejection
• SL: 3871
• TP1: 3845
• TP2: 3830
• Buy bias (only if defended): 3830–3835 bounce
• SL: 3825
• TP1: 3850
• TP2: 3860
⸻
📅 Fundamental Watch
• Asia session expected to remain quiet with low liquidity.
• Main volatility risk comes in London & New York with U.S. labor data later this week.
• Thin liquidity in Asia = potential for false breakouts before London volume sets direction.
⸻
✅ Professional View
Gold remains inside a critical golden zone. Without a decisive break of 3875 (bulls) or 3830 (bears), Asia is likely to consolidate.
📌 My bias → rejection of 3865 area and drift toward 3840–3830.
Only a clean breakout above 3875 changes short-term bias to bullish continuation.
⸻
🥇 ElDoradoFx PREMIUM 2.0 - DAILY RESULTS 🥇
📆 02/10/2025
💰 GOLD TRADES RECAP 💰
🟢 BUY ✅ +210 PIPS
🔻 SELL ✅ +40 PIPS
🟢 BUY ✅ +210 PIPS
🟢 BUY ✅ +110 PIPS
🟢 BUY ✅ +20 PIPS
🟢 BUY ✅ +20 PIPS
🟢 BUY ✅ +20 PIPS
🟥 BUY ❌ -60 PIPS (SL)
🔻 SELL ✅ +110 PIPS
---
📈 TOTAL GOLD PROFIT: +680 PIPS 💸🔥
📊 9 Trades → 8 Wins | 1 SL
🎯 Accuracy: 89%
---
⚡️ GOLD delivered another strong session — scalps and swings stacked up consistent profits.
✅ Only 1 small SL
✅ 8 solid wins secured 📈
👏 Congratulations if you profited 🚀🚀🚀
— ElDoradoFx Team

Gold rebounds? Latest analysis here.Gold faced resistance and declined around the $3900 level, with significant downward pressure, confirming strong support at the 5-day moving average (3830-3820). The daily trend has been consistent this week, with the market repeatedly testing and finding support at the 5-day moving average. If this pattern continues, gold is likely to test the 10-day moving average on Friday, potentially stabilizing and consolidating around that level.
If the 10-day moving average is broken, the price is likely to fall further, approaching the middle Bollinger Band.
The 1-hour chart shows that the resistance zone of 3855-3890 has been broken to the downside, with 3855 now acting as short-term resistance. On Friday, during the Asian session, the price is likely to initially test 3860, potentially triggering further declines. However, if the 1-hour chart breaks above this level and sustains upward movement, adjust your trading strategy accordingly. If the downward trend continues, key support levels to watch are 3800-3790.

10/2: Possible Double or Multiple Bottom, Key Support Near 3826Good evening, everyone!
Today, gold faced resistance and pulled back when it approached the 3900 level—something I had already reminded you of yesterday. Key support remains at 3848–3842, with stronger support at 3826–3814. Those who followed my trading guidance captured this move very well, and I believe some of you who only followed the strategy also made profits—congratulations to all of you!
Currently, the market is in a recovery phase after a sharp drop. On the rebound, pay close attention to resistance around 3852–3858 and 3867. The probability of a straight, one-way rally is low. I tend to believe the market is forming a multi-bottom structure here, which would give the next upward move more strength and a higher chance of testing—or even breaking above—3900. So, if the price pulls back before touching resistance or retreats after an initial test, there’s no need to panic—just stay alert for opportunities.
Another key point: on the 4H chart, important support has now shifted upward to around 3826. This level is critical—if it breaks, strong bearish sentiment could form on the 4H chart, potentially driving prices below 3800, with the next key support near 3780.
No matter how the market moves, as long as we keep pace with the rhythm, it’s always an opportunity to profit. The bigger the volatility, the higher the potential gains.
GOLD H2 BULLISH SETUP , ATH AGAIN Gold Buy Zone
GOLD BUY QM And FVG
Lets Goo
Target New ATH
Good Luck Guys

New ATH, Same Fragility – Why I’m Still Selling Gold RalliesYesterday’s Picture
Gold opened the month with strength, pushing into uncharted territory and printing yet another all-time high, just shy of the 3900 figure. However, momentum faded quickly, and the market corrected lower, currently holding around the 3860 support zone — roughly 300 pips under the peak.
2. Key Question
Has the correction already played out, or are we just at the beginning of a deeper move?
3. Why I See More Downside Ahead
• Fragile bids: Looking back just two sessions, Tuesday’s sharp intraday selloff highlighted how quickly buyers can step aside at these stretched levels.
• Short-term technicals: Price is still above immediate support and the rising trendline, keeping the structure bullish on paper — but this doesn’t erase the vulnerability.
• Risk/reward misbalance: Buying directly into support after a fresh ATH might look attractive, but the risk of a sharp drop outweighs the potential reward.
• Bigger picture context: Even if gold spikes once more to marginal highs, the corrective leg is unlikely to be over — in fact, it may only be starting.
4. Trading Plan
My strategy remains unchanged: sell rallies. I’ll be watching for short-term strength to fade, especially around intraday resistance zones. For me, chasing longs here is not worth the exposure.
5.Final Thoughts
The market remains technically bullish until support breaks, but under the surface, gold is fragile. From my perspective, the real move is still to the downside — and patience will pay off. 🚀

Gold breaks below support. Is a bottom in sight?The US government shutdown delayed the release of several key economic data, including Friday's non-farm payrolls report, leading to the ADP report on Wednesday having a greater impact on the US bond market than usual. Market analysts believe that if the prolonged shutdown harms the economy, the government shutdown itself could further fuel market expectations of lower interest rates. The ISM data released on Wednesday also reinforced the impression of a weakening US economy. Most market participants now expect the Fed to cut interest rates by 25 basis points this month, with a probability exceeding 90%.
Gold traded in a narrow range on Thursday, reaching a high near $3897 before pulling back, indicating strong resistance above. The breakdown below the recent high suggests that gold may continue to decline.
In summary, Quaid believes that after a recent rally, gold is now facing selling pressure. For short-term trading, consider selling on rallies, with key resistance at $3850-3855 and support at $3820-3810.
Trading Strategy:
Sell at $3850-3860, stop loss at $3870, target $3830-3810;
Buy at $3815, stop loss at $3805, target $3840-3850.

ElDoradoFx PREMIUM 2.0 – US FORECAST (02/10/2025)🔎 XAUUSD Deep Technical & Fundamental Analysis – 02/10/2025 (US Session)
📊 Daily Chart (D1)
• Gold rejected 3,896–3,900 key resistance with a large upper wick, confirming strong supply.
• Current candle turning bearish, now pressing into 3,830 zone.
• Price remains above the 21 EMA and daily parabolic SAR, so medium-term trend still bullish but a retracement toward 3,820–3,800 support is underway.
• A daily close under 3,820 could shift momentum bearish into October.
⸻
⏰ 1H Chart
• Strong rejection after a liquidity sweep at 3,896.
• Break of structure (BOS) confirmed at 3,862 → sellers in control.
• Price testing 3,832 intraday support (last H1 low).
• MACD histogram deepening red, moving averages crossed bearish, RSI trending down.
• Unless bulls reclaim 3,860–3,862, intraday bias remains bearish.
⸻
⏱ 15M Chart
• Multiple CHoCH (change of character) moves after the sweep at 3,896.
• Strong momentum candles driving down into 3,832–3,827 liquidity pool.
• If broken, next downside targets = 3,820 and 3,805.
• Countertrend bounce possible only if 3,832 holds with divergence.
⸻
⏱ 5M Chart (Scalping Entries)
• Clear bearish momentum: continuous BOS with lower highs/lows.
• MACD & histogram deep in red, confirming strong sellers.
• Scalping levels:
• Sell continuation: Break & retest below 3,832 → TP 3,827 – 3,820. SL above 3,838 (~60 pips).
• Buy scalp (risky countertrend): If 3,832–3,827 demand holds with bullish candle pattern → TP 3,840–3,850. SL under 3,826 (~60 pips).
⸻
📌 Fibonacci Golden Zone
• From the last swing low → high, the golden retracement sits 3,820–3,832.
• This is where price is consolidating now.
• Break below 3,820 confirms bearish continuation.
• Hold above 3,832 could allow a bounce toward 3,850–3,860.
⸻
🌍 Fundamental Watch
• US ISM Manufacturing PMI (today) → already pressured gold after USD strength.
• Fed speakers later could increase volatility. Hawkish = bearish gold, dovish = bullish bounce.
• Dollar Index (DXY) firming, yields ticking higher → adds bearish bias to gold.
⸻
✅ High-Probability Trade Plans
🔻 SELL Setup (higher probability intraday)
• Entry: Break & retest 3,832.
• SL: 3,838 (≈ 60 pips).
• TP1: 3,827 / TP2: 3,820 / TP3: 3,805.
🔼 BUY Setup (countertrend scalp, lower probability)
• Entry: Bounce from 3,832–3,827 golden zone with bullish confirmation.
• SL: 3,826 (≈ 60 pips).
• TP1: 3,840 / TP2: 3,850 / TP3: 3,860.
⸻
📌 Summary:
Gold is under strong selling pressure after rejecting 3,896–3,900. The 3,832–3,820 golden zone is the key pivot.
• Break below 3,820 = bearish continuation to 3,805.
• Hold above 3,832 = possible bounce toward 3,850–3,860.
⚠️ Volatility will remain high with USD data & Fed comments today.

(XAU/USD) – Gold to reach $4,000/oz: Where is the best buy point1. Price Structure & Main Trend
On the H1 timeframe, gold still maintains a bullish structure with higher highs and higher lows.
After the Break of Structure (BoS), price retraced to test the Buy Zone around 3,862 and bounced back up.
Currently, price is trading above both EMA34 and EMA89, confirming that the uptrend remains dominant.
2. Key Zones
Buy Zone: 3,862 – 3,865. Short-term support, aligned with the previous BoS. If price holds above this zone, the bullish scenario is strengthened.
Order Block (OB) 1: 3,806 – 3,810. Next support zone if the Buy Zone is broken.
Order Block (OB) 2: 3,763 – 3,770. Deeper support, activated only in case of a strong correction.
Sell Scalping Zone (Fibo): around 3,912. A potential short-term resistance where profit-taking may occur.
Sell Zone / ATH: 3,933 – 3,935. Breaking above this area may lead gold to a new all-time high.
3. Trading Scenarios
Bullish (Main Scenario):
Look to buy at 3,862 – 3,865 if price retests.
SL: Below 3,850 (under Buy Zone and EMA89).
TP1: 3,912 (Sell Scalping Zone).
TP2: 3,933 – 3,935 (new ATH).
Bearish (Defensive Scenario):
If price breaks below Buy Zone and closes under 3,860, it may test OB 3,806 – 3,810.
In a worse case, if OB1 is also lost, short-term bullish momentum could weaken, pushing gold to OB 3,763 – 3,770.
4. Summary
Gold on H1 maintains strong bullish momentum after breaking structure. The optimal plan is to prioritize buying at key support, manage risk tightly, and gradually take profit at resistance zones. If price surpasses 3,933, gold may enter a new all-time high phase.

2/10/68 : XAUUSD ( US Session )Using it from US Session until 11.00AM , I'll new analysis and update at 12.00PM
Resistance
3906-3911
3896-3901
3891
Support
3880
3870-3875
3860-3865

Gold Trade Set Up Oct 2 2025Last night during Asian session price swept PDL, and changed state in the 15m to continue bullish so i will be looking buys once we get a close and retest of the CISD to continue higher above PDH but if price fails to change state and closes under 15m/30m lows i will look for a retest of 15m supply to target lows
www.tradingview.com

Xauusd Analysis Is Ready This analysis shows a bearish setup on Gold (XAUUSD 30m). A limit sell trade is suggested near 3892 with a stop loss around 3923. Price is expected to drop towards the target zone 3798–3800, with key support levels at 3863 and 3831.

XAUUSD Swing Buy Setup – Pullback Entry & Targeting 3968Gold is in a clear uptrend channel (highlighted in pink).
Price is currently trading around 3882, near the upper-mid of the channel.
Projection:
The chart shows a possible short-term pullback toward the BUY ENTRY ZONE (3759 – 3718) before resuming the bullish move.
This aligns with retesting the lower trendline support of the channel.
Key Levels:
Buy Entry Point: 3759
Stop Loss: 3718 (about 40 points below entry zone, safe buffer under support)
Target (TP): 3968
Risk-Reward:
Entry: ~3759
Stop: ~3718 → ~41 points risk
Target: ~3968 → ~209 points reward
Risk-Reward Ratio (RRR): ~1:5 → Very favorable.
Pattern:
The move suggests a bullish continuation setup after a corrective retracement.
Expected bullish wave could push Gold to new highs above 3960.
📌 Summary:
✅ Bullish bias remains intact.
🔵 Best entry: wait for a pullback to 3759–3718 zone.
🎯 Target: 3968.
❌ Stop Loss: 3718.
This is a swing trade setup with strong upside potential if Gold respects the channel structure.

Gold Record: Shutdown 'Blinds' the Fed Hello, traders!
Gold shows no sign of slowing down, closing the October 1st trading session at $3,866.66/oz, while futures contracts hit a record high of $3,897.50/oz. The precious metal has climbed nearly 50% year-to-date and just set its 39th record high this year!
Fundamental Analysis: Shutdown Risk Hits at the Worst Time
While government shutdowns usually have a minor impact, the timing of this one is critical:
Delayed Jobs Data: The crucial jobs report (scheduled for Oct 3rd) will be postponed. This uncertainty will leave the market and the Fed 'blind' regarding the economy's health just weeks before the next policy meeting, triggering strong demand for safe-haven assets (Gold).
Threat of Staff Cuts: President Trump threatened to use the shutdown to cut "a lot of" federal employees, escalating tensions beyond typical closures and increasing political instability.
Technical Analysis & Trading Strategy
Gold accelerated past the $387x region during the US session, confirming the upward momentum is still very strong. However, the market is prone to more "Stop Loss hunting" (liquidity sweeps). Continue to Prioritize Buy, but manage SL carefully due to wider price swings.
Resistance: $3887, $3895, $3904
Support: $3870, $3854, $3843
Suggested Trading Strategy (Absolute Risk Management):
BUY ZONE
Zone: $3870 - $3868 / SL: $3860
TP: $3878 - $3888 - $3898 - $3908
SELL ZONE (High Risk)
Zone: $3903 - $3905 / SL: $3913
TP: $3895 - $3885 - $3875
Gold is running on a foundation of fear. Do you think the $3900 mark will be breached this session? 👇
#Gold #XAUUSD #ATH #Fed #GovernmentShutdown #TradingView #FinancialMarkets #RecordHigh

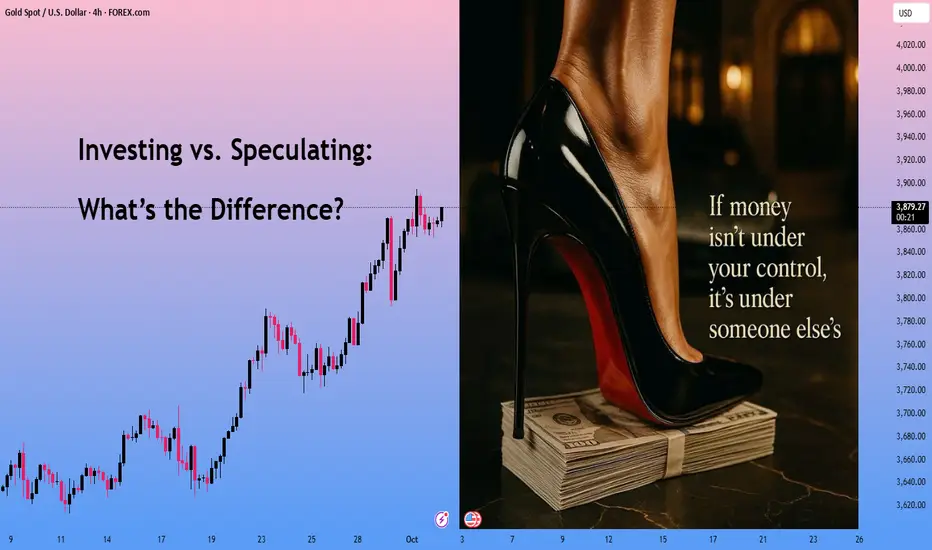
Investing vs. Speculating: What’s the Difference?Hey everyone, you’ve probably heard the words “investing” and “speculating,” but do you really know what sets them apart? Both are about putting money in to make more money, but the mindset and approach are Totally different. Let’s break it down super simply:
What’s Investing? (4 Keywords: Long-term, steady, knowledge, patience)
Investing is like a marathon—it’s about the long game, focusing on things that grow in value over time. You’re aiming for steady, lasting profits, not a quick buck.
When you invest, you do your research. You really understand what you’re putting your money into.
You use knowledge—like studying a company’s finances (FA), looking at market trends (TA), or knowing the rules of the game (FM, RM).
You stay cool-headed, not getting swept up by hype or greed.
Investing isn’t about betting everything on one big win. It’s about protecting your money first, then letting profits grow slowly.
Think of it like planting a tree: you care for it, water it, and wait patiently for the fruit.
For example , let’s say you research a solid real estate deal. You believe a piece of land will grow in value over 3–5 years because it’s in a great spot with new roads being built. You buy it, hold on, and later sell it for a profit. Or you keep it, build a house, or rent it out for monthly cash while owning something valuable.
Investing like this isn’t fazed by short-term ups and downs—it’s all about the long-term payoff.
What’s Speculating? (4 Keywords: Short-term, fast, risky, flexible)
Speculating is like surfing—you jump in to catch a quick wave and make money fast by riding short-term price changes.
You know the term “riding the wave”? That’s it! You need waves to surf, right? If there’s no wave, you’re stuck.
Speculating works the same: it’s a bit daring, and you have to be ready to lose.
When you see a chance, you dive in fast or cut your losses quickly if things go wrong.
For example , back in the day, I got hyped up when Elon Musk tweeted about SHIBA coin. I jumped in, my money shot up 10 times in a short time, and I sold fast. Good thing, because the price crashed right after! If I hadn’t moved quickly, my account would’ve been wiped out.
Speculating is all about quick moves—”buy the rumors, sell the news”, and cashing in on the hype. It’s not about long-term value; it’s about grabbing profits fast. But it’s way riskier, and you can lose everything if you’re not sharp. Knowing when to stop is super important.
So, What’s the Key Difference?
Investing is all about patience.
Speculating is about being quick and flexible.
Someone asked me: “If I trade short-term but do research, is that investing?” Awesome question! But even with research, short-term trading is usually called speculating.
Why?
Because it’s focused on fast profits and higher risks, unlike the steady, long-term foundation of investing.
If you trade short-term with a solid plan, that’s cooler—pros call it systematic trading, way better than just guessing. But in general, short-term moves are still seen as speculating, not investing, because they don’t have that long-term vision.
Investing without a plan? That’s just gambling. (Investing + No plan = Gambling)
Speculating with a strategy? You’re thinking like a smart entrepreneur. (Speculating + Strategy = Entrepreneur)
Whether investing or speculating is better depends on you—your style and your game plan!
That said, choosing between investing and speculatingsometimes depends on each person's position. I’ll share more details in my next video.
If you agree with my opinion, drop a comment here!
I’m Anfibo , just sharing what I know about finance.
GOLD HIGH PROBABILITY SETUPS SOON!!!🚨 XAUUSD HIGH PROBABILITY SELL SETUP 🚨
* Here We Can See Clearly The Next Potential Moves For GOLD Coming Hours/Days.
* Keep Your Eyes Close On Your Trading Positions.
* Happy PIP Hunting Traders.
FXKILLA.

ElDoradoFx PREMIUM 2.0 – GOLD FORECAST (02/10/2025)
🔎 Deep Technical Analysis (XAUUSD – 02/10/2025, London Session)
Current Price: 3,867
⸻
📈 Daily Chart
• The bullish trend remains intact with higher highs and higher lows.
• Price has tested 3,895–3,900 resistance zone, leaving an upper wick yesterday → clear sign of supply.
• Parabolic SAR dots remain bullish, but momentum is slowing.
• EMA20 sits far below at 3,771, leaving room for correction without breaking the structure.
⸻
⏳ H1 Chart
• Double top rejection forming at 3,872–3,875.
• RSI around neutral (50–55), showing lack of trend direction.
• MACD histogram contracting, signalling reduced bullish momentum.
• Key intraday support sits at 3,862–3,855. Break here → possible quick drop to 3,840–3,832.
⸻
⏱️ M15 Chart
• Price consolidates inside the Fibonacci golden zone (3,862–3,868).
• Liquidity sits above equal highs at 3,874 → if bulls break, stop runs could fuel a rally toward 3,888–3,895.
• If 3,862 fails to hold, short-term downside pressure opens into 3,855–3,852 and then 3,840.
⸻
⏱️ M5 Chart
• Sweep at 3,872 followed by immediate rejection.
• MACD flipped red with bearish momentum building.
• EMA alignment turning flat/down, suggesting short-term weakness.
⸻
🎯 Scalping Setups (Max 60 pips SL)
• Buy scalp:
• Entry: 3,862–3,864 support zone
• SL: 3,858
• TP1: 3,872
• TP2: 3,888
• Sell scalp:
• Entry: 3,872–3,874 rejection
• SL: 3,878
• TP1: 3,862
• TP2: 3,852
⚠️ Current higher probability = short scalps on failed rejections at 3,872, unless price decisively breaks above with strong volume.
⸻
✅ Overall Outlook
• Bias: Neutral-to-bearish below 3,875.
• Breakout upside trigger: 3,875 → target 3,888–3,895.
• Breakdown downside trigger: 3,862 → target 3,852–3,840.
• Golden zone (3,862–3,868) is the intraday pivot. Reactions here will define London’s move.

2/10/68 : XAUUSD ( Europe / London Session )Using it from Europe Session until 7.00PM , I'll new analysis and update at 8.00PM
Resistance
3885-3890
3875-3880
3870
Support
3859
3849-3854
3839-3844

Waiting for a trend? A continued rise?In early Asian trading on Wednesday, prices rallied before retracing several times, providing continuous confirmation of bullish entry opportunities. Prices surged sharply around the European session, accelerating past the highs and encountering short-term resistance below the 3900 mark. The US ADP data, released below previous expectations, failed to drive price gains, suggesting the market may test support levels in the short term.
Gold prices are currently fluctuating around 3865. Bulls are focusing on $3850, which has become effective support. Go long immediately upon reaching this target. If prices successfully rise from around 3850 and stabilize above 3875, bulls will likely continue their push towards the 3900 mark on Thursday. Conversely, if prices fail to hold above this level, prices are likely to develop a shoulder-top pattern and experience a short-term correction.
Trading strategy:
Go long in the 3850-3855 area, with a stop-loss at 3840 and a profit target at 3875. Break through 3875 and stabilize in the European session, then go back to 3870 to cover the position, with the profit target at 3900.

Gold Price Outlook – Trade Setup (XAU/USD)📊 Technical Structure
OANDA:XAUUSD Gold remains in a bullish consolidation phase after printing a fresh record high near $3,895, supported by safe-haven demand. On the 1H chart, price is consolidating between the Support Zone ($3,847–$3,840) and the Resistance Zone ($3,900–$3,905). A short-term pullback is visible, but the broader ascending channel structure remains intact, suggesting dips could be treated as buying opportunities.
🎯 Trade Setup
Entry: $3,847 (near support zone)
Stop Loss: $3,837
Take Profit: $3,900 / $3,925 (extension if momentum sustains)
Risk/Reward: ~1 : 6
🌍 Macro Background
Gold’s rally is fuelled by a weaker USD, plunging US Treasury yields, and heightened Fed rate cut expectations. According to CME FedWatch, markets are pricing in a 98% chance of a 25bps cut in October and strong odds of another in December. The US government shutdown adds a political risk premium, while softer US jobs data (ADP: –32k private payrolls in September) reinforced dovish bets. Meanwhile, geopolitical tensions (Ukraine conflict, Middle East uncertainty) continue to attract safe-haven flows.
🔑 Key Technical Levels
Resistance Zone: $3,900 – $3,905
Intermediate Resistance: $3,925
Support Zone: $3,847 – $3,840
Deeper Support: $3,800
📌 Trade Summary
Gold is consolidating below $3,900, but the supportive macro backdrop keeps the bias bullish. Any dip toward the $3,847–$3,840 support offers a favourable long setup targeting $3,905–$3,925. Traders should watch today’s US ISM Manufacturing PMI and upcoming FOMC member speeches for volatility triggers.
⚠️ Disclaimer
This analysis is for reference only and does not constitute trading advice. Trading involves significant risk, and proper risk management is essential.
