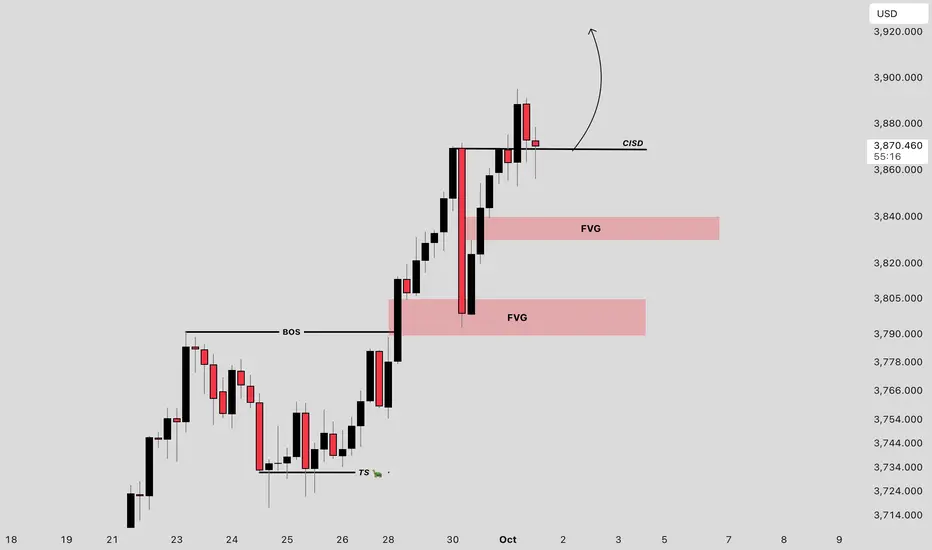
Gold continues to make new highs. Watch for key support levels.With the government shutdown, data collection and reporting by federal agencies may be delayed or suspended. Therefore, employment and inflation reports scheduled for release in the coming days may not be published, creating uncertainty and fueling a flight to safety.
Since the start of this week, gold has essentially set new all-time highs almost daily. While there have been significant pullbacks, they have been short-lived, and gold has rebounded to new highs. The surge in gold suggests that pullbacks are merely opportunities to buy.
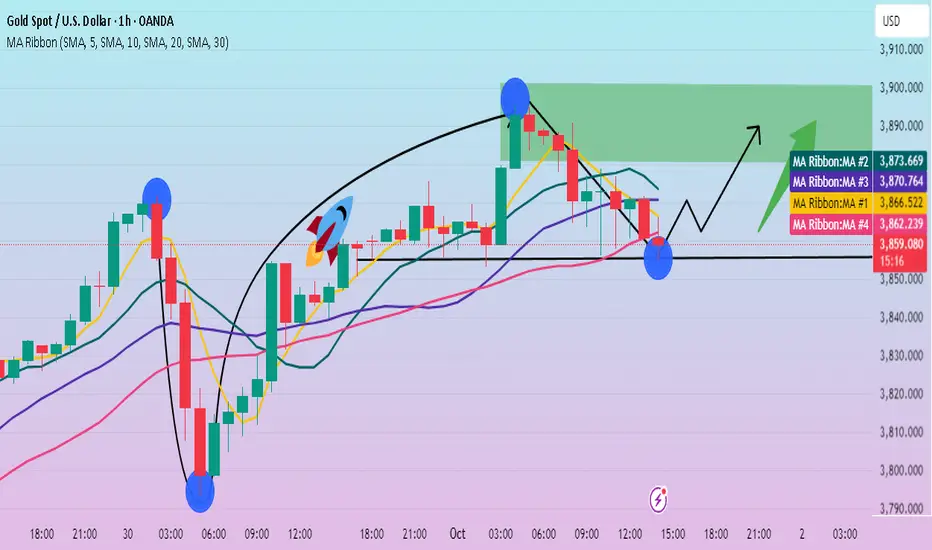
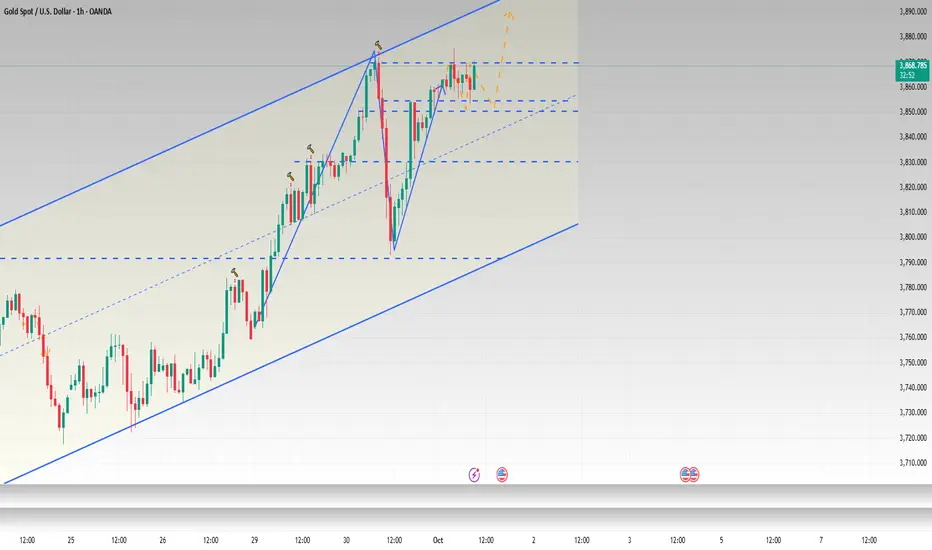
On the 1-hour chart, after reaching its all-time high of 3895, gold's momentum has slowed. The moving average system is flattening out, and after several attempts to break below support, gold has rebounded. In the short term, there is strong support below, with the lowest point reached at 3856. As long as gold doesn't break below 3856, it is likely to continue its strong upward trend.
Trading Strategy:
Buy at 3855, stop loss at 3845, target profit range: 3880-3890-3900.
Xauusdsignal
Gold at PRZ – Crab Pattern in PlayGold ( OANDA:XAUUSD ) started to rise as I mentioned in my previous idea and created a new All-Time High(ATH) again .
How long do you think the trend toward forming a new ATH will continue?
Gold is currently trading near the Potential Reversal Zone(PRZ) and Resistance lines .
In theory, Elliott waves , PRZ , and Resistance lines could be the start of a correction, even a deep one( End of the main wave 5 ) .
There is also a Bearish Crab Harmonic Pattern seen in the Gold chart that could lead to a decline in Gold .
I expect Gold to start correcting again.
First Target: $3,819
Second Target: $3,807
Third Target: $3,793
Stop Loss(SL): $3,854
Please respect each other's ideas and express them politely if you agree or disagree.
Gold Analyze (XAUUSD), 1-hour time frame.
Be sure to follow the updated ideas.
Do not forget to put a Stop loss for your positions (For every position you want to open).
Please follow your strategy; this is just my idea, and I will gladly see your ideas in this post.
Please do not forget the ✅ ' like ' ✅ button 🙏😊 & Share it with your friends; thanks, and Trade safe.

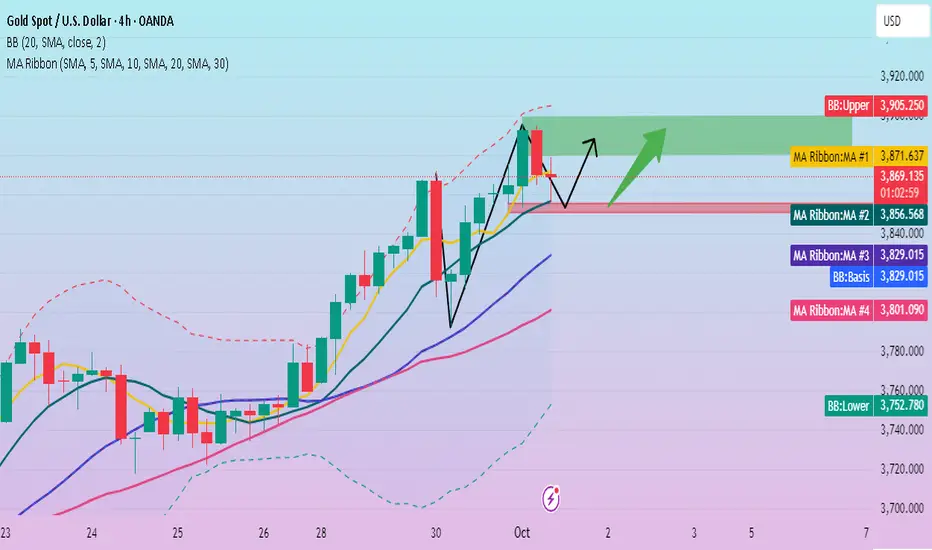
Fear-driven pullback? Still strong.From a daily chart perspective, gold is currently in a very strong uptrend. The price has been steadily rising, supported by the 5-day moving average, and has seen four consecutive days of gains. Wednesday is expected to see further upward momentum.
The Bollinger Bands are widening upwards, and the moving average system is perfectly aligned in an uptrend, confirming the strength of the upward trend. The key support level is around 3820. As long as the price doesn't break below this level, the strong uptrend will likely continue. Therefore, the trading strategy should remain focused on buying on dips.
The 4-hour chart shows that while there was a significant pullback on Tuesday, the price did not break below the middle Bollinger Band. Following this, a strong rebound quickly recovered the losses and reached a new high, indicating that the previous decline was merely a technical correction, not a trend reversal. In terms of short-term operations, we need to focus on the key support area of 3855-3850 below, and we can wait for the price to fall before choosing an opportunity to go long.
Trading Strategy:
Buy at 3855-3850, with a stop loss at 3840. Target profit levels: 3880, 3890, 3900.
3830: The Line Between Bullish Control and a Waterfall Drop1. Recap of Yesterday’s Key Move
Yesterday was a decisive day for Gold traders, and it perfectly confirmed what I have been pointing out since Monday: at these elevated levels, Gold is extremely vulnerable.
After printing yet another All-Time High overnight, the yellow metal sold off aggressively for nearly 5 hours straight, with losses amounting to almost 800 pips.
Importantly, the bounce came exactly from the 23 September ATH level and by the end of the session, bulls managed to step in and regain control.
________________________________________
2. Overnight Price Action
Overnight, the asian session was once again bullish – Gold reached a fresh ATH at 3875, only to retreat slightly, which for now can be classified as nothing more than a shallow correction.
Despite the recovery, what matters is not the new high, but the fragility revealed during yesterday’s sell-off. Momentum looks stretched, and price action confirms the market’s increasing instability.
________________________________________
3. Technical Outlook
From a structural point of view:
• Price is still contained within the upper bullish channel.
• Bulls have also managed to reclaim the median line, suggesting they are still in control.
• However, the 800-pip collapse proved that even in such a strong uptrend, cracks are starting to show.
Key levels to watch:
• 3830 → if this level breaks, the market could trigger a waterfall of selling.
• 3785-3790 → support that held before, but I believe this time it won’t survive.
• 3700 → the logical corrective target if 3780 is breached.
________________________________________
4. Trading Mindset & Strategy
Yesterday, I couldn’t sell into the initial drop — and that’s fine. Such a move was more about timing luck than pure skill. No frustration, because the analysis was right: fragility is here.
From now on, my plan is clear:
• I’ll be looking for structured patterns with larger targets.
• Minimum: +1000 pips setups.
• Stretch target: +1500 pips.
________________________________________
5. Conclusion
Gold remains in bullish mode on the surface, but yesterday’s sell-off clearly revealed how fragile and overstretched the trend has become.
If 3830 fails, that could be the decisive moment when bulls finally lose control and the long-awaited correction accelerates.
Until then, I will stay patient and disciplined, waiting for the market to provide a clean pattern with a strong risk/reward setup. 🚀
XAUUSD Analysis: Rising Wedge StructureThe 1-hour chart of Gold (XAUUSD) is currently presenting a rising wedge structure, a pattern known for its potential reversal characteristics when it forms after a strong upward move. This wedge is neatly defined by converging support and resistance trendlines, capturing price action within a narrowing upward channel.
Scenario 1 – Bullish Breakout Above the Wedge Resistance
In the bullish case, if the price breaks above the upper resistance trendline decisively with strong momentum and volume, it will signal a continuation of the uptrend. This could push Gold prices toward $3,920–$3,960 and possibly even the psychological $4,000+ mark in the short term. For this to play out, the breakout should be clean and sustained, not a false spike followed by a quick sell-off. Traders looking for long opportunities should wait for a confirmation candle and place stops below the breakout zone.
Scenario 2 – Bearish Breakdown from the Wedge Support
Alternatively, if Gold fails to break out and drops below the wedge's lower support, it will trigger a bearish reversal pattern. This breakdown could accelerate downside momentum, pulling prices back toward $3,820, followed by $3,760, and possibly even $3,700 or lower. Such a breakdown would confirm the wedge's bearish implications and shift intraday sentiment into a corrective or reversal phase. In this scenario, short trades can be considered with strict stop-loss placement just above the breakdown candle.
Scenario 3 – Sideways Consolidation Before Decision
If neither a clear breakout nor breakdown occurs, Gold may enter a sideways consolidation zone around current levels ($3,860–$3,880). This would indicate temporary indecision in the market and a potential buildup before a sharp move in either direction. This type of price action can trap both bulls and bears if acted upon prematurely. Therefore, in this scenario, it is best to remain neutral and patient, waiting for volatility to pick a direction.
Final Thoughts for Traders
Gold is at a critical juncture, and traders must approach this setup with discipline. The rising wedge structure demands clear confirmation before execution, and each scenario offers its own opportunity — but also its risks. Always follow strict risk-reward ratios, and avoid emotional trades inside the wedge before confirmation.
Keep an eye on macroeconomic events or dollar strength/weakness that could act as a catalyst for the breakout or breakdown.

Gold Trade Set Up Oct 1 2025Price pushed higher in London session creating another ATH so i am still bullish. I want to see a test of either demand to see a continuation higher
www.tradingview.com

3930 is still pending Our previous commantary sucessfully TP HIT As we took buy from 3855-3867 Both TP HITS at 3890
What will I do on NY SESSION?
I'm buying gold on every DIP
✅️ My First buying will be start from 3870 area - if the market drops for retest on H4 BOS I will took buy trade with very strict Stoploss.
✅️Secondly my buying area will be 3835-3845 zone where we have structurel support and liquidity meets the bottom trendine.
-My target will be 3930 In extension !!
Additional TIP: Buy the dips

XAU/USD 4H Chart – Bullish Pullback Setup to Key Support ZoneAnalysis Overview:
📈 Trend:
The price is currently moving in an ascending channel, indicating a bullish trend.
Price has recently touched or slightly exceeded the upper boundary of the channel, suggesting a potential pullback.
🟦 Support Zone (Buy Zone):
Marked in blue, between 3,764.828 (Trade Entry) and 3,718.674 (Stop Loss).
This zone aligns with a previous consolidation area, which now acts as a strong support.
✅ Entry Plan:
Wait for price to retrace into the blue support zone.
Ideal entry around 3,764.828, possibly after a bullish signal (e.g., pin bar, bullish engulfing).
❌ Stop Loss:
Placed just below the support zone at 3,718.674, protecting the trade in case the structure fails.
🎯 Target (TP):
3,975.534 — This is labeled as the LABA TARGET POINT, near the upper boundary of the ascending channel.
Risk-reward ratio appears favorable, roughly 4:1 if using the full range between entry and stop loss.
🧠 Trade Idea Summary:
Setup Type: Pullback to Support in Bullish Channel
Bias: Long/Bullish
Entry Zone: 3,764.828 (support)
Stop Loss: 3,718.674 (below structure)
Target: 3,975.534 (channel top)
Conditions to Watch:
Confirm reversal within the buy zone before entering.
Monitor for bearish breakdown if price closes below stop loss zone.
⚠️ Risk Management Tips:
Use proper position sizing based on your account size and stop loss.
Do not enter early; wait for confirmation (e.g., bullish candle pattern) in the support zone.
Keep an eye on macroeconomic news (e.g., NFP, interest rate updates) as gold is very sensitive to these events

XAU/USD: Bullish Trend Strengthens with Breakout and RetestXAU/USD maintains a strong bullish structure after breaking out of the consolidation zone and successfully retesting support. The price is moving steadily within an upward channel, forming higher highs alongside a clear A-B-C corrective structure, confirming trend continuation.
As long as buyers hold above the 3,850 support zone, the next target is the 3,950 resistance area. With momentum firmly favoring the bulls, a sustained breakout could pave the way for new all-time highs in the sessions ahead.

ATH $3871: Shutdown Fear & 97% Fed Cut Fuel Gold SurgeHello, investors and traders!
Gold continues to show phenomenal strength, setting a new ATH at $3,871.45/oz (on Sept 30), and closing at $3,843.43/oz. This gain confirms the strongest September since 2011, solidifying the explosive growth trend for the precious metal.
Fundamental Analysis: Politics and the Fed Drive Buying Wave
Two core drivers are pushing gold prices higher, making any attempt to call the top extremely risky:
Political Instability: The risk of a looming US Government shutdown increases uncertainty, strongly boosting safe-haven demand.
Low-Rate Expectations: Weakening jobs data has almost certainly cemented the probability that the Fed will cut interest rates in October. The market is currently pricing in a 97% chance of a Fed rate cut.
Technical Analysis & Trading Strategy
After a recent shock drop of 70 points, Gold quickly recovered and created a new ATH, proving that buying pressure is overwhelming any profit-taking efforts. The strong upward bias continues.
Outlook: Continue to Prioritize Buy given the powerful upward trend and supportive fundamentals. Only attempt a Sell Scalp (short-term short) near psychological resistance levels with an extremely tight Stop Loss (SL).
Key Resistance: $3894, $3904, $3914
Key Support: $3869, $3843, $3834
Suggested Trading Strategy (Absolute Risk Management):
BUY SCALP
Zone: $3870 - $3868 / SL: $3864
TP: $3875 - $3885 - $3900
BUY ZONE
Zone: $3834 - $3832 / SL: $3824
TP: $3842 - $3862 - $3892
SELL SCALP (High Risk)
Zone: $3904 - $3906 / SL: $3910
TP: $3901 - $3891 - $3876
The market is running on fear and rate-cut anticipation. Are you betting on the $3900 mark this week? 👇
#Gold #XAUUSD #ATH #Fed #GovernmentShutdown #TradingView #InterestRates #FinancialMarkets

Gold Hits New Highs; Can It Break Through 3900?This week, key economic data releases to watch include the US ADP employment report, the ISM Manufacturing PMI, and the crucial September non-farm payrolls report. If data continues to show a slowdown in the U.S. economy, it will reinforce expectations of a rate cut by the Federal Reserve, which will be good for gold.
While an October rate cut is highly anticipated, any clues about the future path of interest rates could cause market volatility.
On Wednesday, gold generally showed a volatile upward trend, breaking through a new all-time high in early Asian trading, reaching a high of 3895.37. The 3900 level seems unable to halt the price's upward momentum. From the perspective of technical indicators, the 1-hour chart shows that the price rebounded on Tuesday and touched the lower track of the Bollinger Band, and then rose strongly to a new high of 3875. The moving average system is arranged in a straight line upward, and the momentum of gold bulls remains abundant.
The 4-hour moving average shows a golden cross bullish arrangement, the price remains above the 5-day moving average, the gold price is above the middle Bollinger band, the gold bulls are strong and remain unchanged. In the short term, pay attention to the MA10 moving average position of 3870-3875 area. You can still go long when the price pulls back to this position.
Trading Strategy:
Buy around 3870, with a stop loss at 3860. Target profit range: 3890-3900. Hold the position if it breaks above 3900.

ANFIBO | XAUUSD - DON'T SELL IT TODAY AT ANY COST [01.10.2025]Hello, Anfibo's here!
OANDA:XAUUSD Analysis – Daily Trading Plan
Overall Picture:
OANDA:XAUUSD continues its impressive rally, printing new ATHs one after another. The buy zone recommendation around 3785 – 3795 from yesterday has already delivered nearly 🎯 1000 PIPS 🎯 in profit – an outstanding result that once again showcases the strength of this trend. Truly, the profits from gold are extraordinary – enough for me to say: “I can take my family on another vacation thanks to OANDA:XAUUSD !”
Looking ahead, unless there are major unexpected shifts in fundamentals, gold is poised to keep conquering new highs. With global geopolitical tensions still simmering, safe-haven demand remains robust, and this continues to fuel the bullish momentum. At this stage, we prioritize the buy side over sell side, until gold decisively breaks its trend structure.
Technical Outlook
Short-term trend: Strong bullish continuation on both H4 and Daily timeframes.
Momentum: Healthy and sustainable, with steady higher highs and higher lows.
SUPPORT KEY / BUY ZONES: 3870 - 3834 - 3816 - 3800
RESISTANCE KEY / SELL ZONES: 3904 - 3918 - 4000
Trading Plan Today
>>> BUY ZONE:
ENTRY: 3860 - 3871
SL: 3750
TP: 3915 - ATH
>>> BUY ZONE:
ENTRY: 3815 - 3820
SL: 3710
TP: 3870 - 3915 - ATH
Risk Management
- Favor long trades in line with the prevailing trend; sell setups only for intraday scalps at key resistances.
- Keep a Risk:Reward ratio ≥ 1:2.
- Control position sizing and avoid overtrading during consolidation phases.
- Stay alert to global news headlines, as unexpected geopolitical updates may trigger high volatility.
Conclusion
Gold remains in a strong bullish cycle, consistently breaking into new ATH territory. Our plan continues to focus on buying dips and breakouts, riding the prevailing uptrend.
Key strategy: Buy dips around 3800 - 3816 – 3870 .
Near-term targets: 3900 – 3920 – 3950, while higher levels remain possible if momentum persists.
Gold is rewarding those who stay aligned with the trend – and for now, the bulls are still firmly in control.
HAVE A NICE DAY FRIENDS!!!

XAU/USD – 01/10 | US Government Shutdown Confirmed | Gold awaits🔎 Context & News
US Politics : The US government officially shut down after the Senate failed to pass the federal funding bill. A major political risk catalyst, triggering safe-haven flows into Gold.
FED : Probability of a -25bps rate cut in October rises to 96.2% → almost certain.
Key Events Today (ET / UTC) :
• ADP Employment Change: 08:15 ET / 12:15 UTC
• ISM Manufacturing PMI: 10:00 ET / 14:00 UTC
→ Both will be crucial data points that may shake Dollar and Gold.
📌 Summary : US politics + FED easing = Gold remains supported, but ADP & ISM tonight could spark strong volatility in the US session.
📈 Technical Analysis (H1)
Main Trend : Bullish after multiple BoS.
EMA : EMA 34 > EMA 89 → bullish momentum intact.
Resistance :
3,897 – 3,907 (Sell scalp – Fibo 0.5–0.618).
3,920 – 3,921 (Liquidity / ATH test).
Support :
3,872 – 3,876 (old high retest).
3,833 – 3,841 (OB zone).
3,814 – 3,822 (deep Support Zone – losing this shifts bias).
🎯 Trade Plan
✅ Buy (trend priority)
Buy Zone 1 : 3,872 – 3,876
• SL: 3,869
• TP: 3,897 → 3,907 → 3,920
Buy Zone 2 (OB) : 3,833 – 3,841
• SL: 3,826
• TP: 3,872 → 3,897 → 3,907
Buy Zone 3 (Deep Support) : 3,814 – 3,822
• SL: 3,808
• TP: 3,841 → 3,872 → 3,897
⚡ Sell (short scalps only – lower RR)
Sell Zone 1 : 3,897 – 3,907
• SL: 3,912
• TP: 3,885 → 3,876 → 3,841
Sell Zone 2 (ATH sweep) : 3,920 – 3,921
• SL: 3,925
• TP: 3,907 → 3,885 → 3,876
📝 Conclusion
Gold remains strongly supported by the US government shutdown + FED rate cut expectations.
Strategy today: Prioritize Buy at support; Sell only for short scalps around 3,907 – 3,921.
⚠️ Watch out: ADP & ISM tonight may trigger unexpected volatility → manage risk carefully and move SL to BE after TP1.
📢 If you find this Captain’s Log useful, don’t forget to Follow Captain Vincent ⚓ for the latest updates.
💬 What do you think, crew? Will Gold break ATH 3,920 right after ADP & ISM tonight?

3875-3850 sell high and buy low,break to determine the directionGold continued to rise during the day and then fell into a narrow range of fluctuations after hitting the high of 3870. Initially, we expected gold to form a double top pattern, suggesting a potential sharp decline. But brothers, do you remember that I have repeatedly emphasized recently that the US government is facing the risk of shutdown? Yes, the U.S. federal government officially shut down at 12:01 a.m. Eastern Time on Wednesday because Democrats and Republicans failed to reach an agreement on a short-term spending plan.
As I mentioned before, a government shutdown would impact the release of important data such as ADP and NFP. The NFP data, originally scheduled for Friday, may not be released on time. At the same time, the government shutdown will also have a certain impact on the US economy, which will indirectly affect the gold trend. This is why VIP members and I chose to change the TP to 3855 and exit the market with profits.
Judging from the market trend, the current gold rising channel has not been broken, and gold is still in a bullish trend in the short term. Key support is at 3850; as long as this level holds, the bullish outlook remains. Pay attention to the pressure of 3870-3875 on the upside. Once it breaks, the gold price will test the channel pressure of 3890-3900.
Is This the Start of Gold’s Next Major Upside Trend?✨ GOLD vs USD Market Wealth Strategy Map (Swing Trade) ✨
🟡 Asset: XAU/USD (Gold vs U.S. Dollar)
📈 Plan: Bullish Outlook
The Thief Strategy 🥷 is in action — using a layering style of limit orders (multiple staged entries). Instead of a single "all-in" shot, we scale in like a smart thief sneaking layer by layer.
🔑 Entry (Layered Style):
Possible levels: 3720 / 3730 / 3740 / 3750 (you can increase layers depending on your own plan).
The idea: Build positions gradually instead of chasing the candle.
🔒 Stop-Loss Zone (Protect Capital):
3680 (nicknamed the “Thief SL” 🚨).
⚠️ Note: This is just my reference level. Please adjust to your own risk style — don’t just follow blindly.
🎯 Target (Profit-Taking Zone):
3860 (Trend Flip Alert ⚡ – High Voltage Zone).
Why? This area aligns with resistance + potential overbought conditions + trap vibes. That’s where I expect smart thieves to escape with their bags 💼.
💡 Reminder for the Thief OGs: I’m not recommending you copy my SL/TP blindly. The market is your playground — grab your profits your way, manage your risk your way.
🔎 Related Pairs to Watch (Correlation Radar)
TVC:DXY (U.S. Dollar Index) → Strong inverse correlation with Gold. If DXY weakens, XAU/USD often rallies.
TVC:SILVER (XAG/USD) → Precious metals move in packs. Silver strength can be a leading indicator for Gold.
BLACKBULL:WTI (USOIL/USD) → Energy inflation links can push Gold higher as a safe haven.
SP:SPX (S&P 500 Index) → Risk-on/off sentiment. Equity weakness often boosts safe-haven demand for Gold.
📌 Key Takeaways:
Thief Strategy = Layered limit order entries (smart scaling).
🚨 Protect your capital with personalized SL — don’t just copy mine.
⚡ Watch for resistance traps near 3860.
📊 Always monitor correlated assets like DXY, Silver, Oil, S&P 500.
✨ “If you find value in my analysis, a 👍 and 🚀 boost is much appreciated — it helps me share more setups with the community!”
📜 Disclaimer: This is a Thief Style Strategy shared just for fun & educational vibes. Not financial advice. Trade responsibly and manage your own risk.
#XAUUSD #GOLD #SwingTrading #TradingStrategy #LayeringStrategy #ThiefStyle #Forex #Commodities #TradingView

Gold Bullish Setup Towards 3910 ATHThis chart shows the XAU/USD (Gold vs US Dollar) 1-hour timeframe analysis. Price is currently trading around 3863, following a strong bullish trend supported by an upward trendline. The market recently bounced from the support area and continues to push higher, confirming buyer strength.
Key levels are highlighted:
Immediate support: 3853 – 3807 zone, aligned with the trendline.
Resistance levels: 3873 and 3900, with the next target at 3910 (new all-time high).
The projection suggests that as long as gold holds above the support trendline, price is likely to continue its bullish momentum, potentially reaching 3910. However, a break below the support could trigger a deeper pullback.
👉 Overall bias: Bullish, targeting 3910 ATH if momentum sustains.

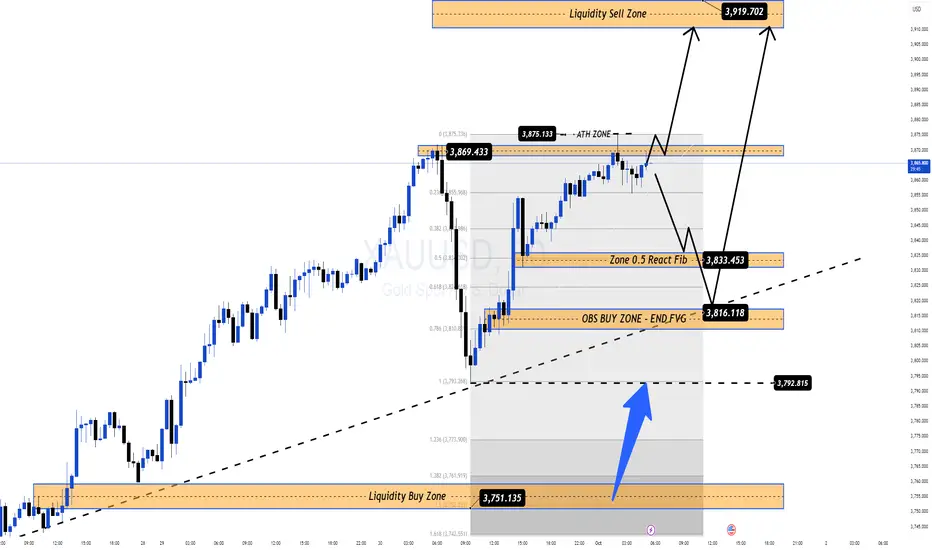
US Government Shutdown Boosts Gold, FOMO BUY Momentum Continues🚀 XAUUSD – Daily Trading Plan| MMFLOW TRADING
📊 Market Context
Gold kicks off Q4/2025 with strong bullish sentiment as safe-haven flows continue to dominate. The shock of a US government shutdown has sparked fresh concerns, driving investors to accelerate their demand for gold as the ultimate hedge.
Adding to the momentum, the potential delay in the NFP jobs report this week leaves markets “thirsty” for guidance, putting gold in the spotlight. Meanwhile, the US Dollar remains under pressure from political instability and expectations that the Fed may lean closer to further rate cuts.
Together, this backdrop highlights gold’s resilience after its explosive rally and points to further upside potential as safe-haven inflows and FOMO buying pressure continue to fuel the trend.
🔎 Technical Analysis (H1/H4)
Price remains within the main bullish structure, holding above key supports.
Primary BUY Zone: 3833–3831 (Fib + CP zone), strong reaction expected.
Secondary BUY Zone: 3817–3815 (OBS zone), deeper support, ideal for additional long entries.
Liquidity Sell Zone 3919–3923: A potential liquidity trap area to watch.
🔑 Key Technical Levels
BUY Zones: 3833–3831, 3817–3815
SELL Zone (watch carefully): 3919–3923
Key Levels: 3800, 3855, 3880
📈 Trading Scenarios & Plan
✅ BUY ZONE 1: 3833–3831
SL: 3827
TP: 3838 - 3842 - 3846 - 3850 - 3855 - 3860 - 3870 - ???
✅ BUY ZONE 2: 3817–3815
SL: 3810
TP: 3822 - 3826 - 3830 - 3835 - 3840 - 3850 - 3860 - 3870 - ???
⚠️ Risk Management Notes
A US government shutdown may trigger unexpected volatility, especially with the NFP delay.
Enter longs only with price action confirmation at support zones.
Avoid chasing highs – patience is key, wait for pullbacks into BUY zones.
✅ Summary
Gold is directly benefiting from political turmoil and delayed US economic data. The main bias remains BUY with safe-haven inflows, focusing on 3833–3831 and 3817–3815 as strategic zones. Targets expand toward 3870–3880 and potentially above 3920 if bullish momentum holds strong.
📢 Follow MMFLOW TRADING for real-time updates and early access to BIGWIN setups!
Gold Hits Record High: US Shutdown Looms - Buy the Dip?Gold just hit a record high of $3,833.37/oz (Sept 29), driven by a surge in safe-haven demand over the potential US Government shutdown (Oct 1) and expectations for FED rate cuts (PCE data confirmed). A slight decline in the USD (0.2%) also offered support.
The sharp drop to $3,794 is viewed as likely end-of-month profit-taking, not a fundamental shift. This keeps the Buy opportunity open if US budget tensions escalate.
📈 Technical Analysis & Trading Strategy
Gold saw a big shake-out, flushing out FOMO buyers early in the European session. Selling pressure remains, but don't rush to SELL immediately. Watch for a technical bounce to fill the FVG before any potential continuation lower.
Key Levels:
Resistance: $3827 / $3846 / $3870
Support: $3787 / $3778 / $3763
Detailed Trading Strategy (US Session):
1. BUY Zone (Counter-Trade/Dip Buy):
Price Zone: $3784 - $3782
SL (Stop Loss): $3774
TP (Target): $3792 / $3812 / $3832
2. SELL Scalp (Quick Short):
Price Zone: $3827 - $3829
SL (Stop Loss): $3833
TP (Target): $3824 / $3814 / $3804
3. SELL Zone (Main Short Entry):
Price Zone: $3866 - $3868
SL (Stop Loss): $3876
TP (Target): $3858 / $3838 / $3818
⚠️ Warning: The US Government shutdown is the core focus. If budget negotiations succeed, Gold could retreat sharply. Use tight SL and manage risk carefully!
Will you be buying the dip at $378x or selling the rally at $382x? 👇
#XAUUSD #Gold #TradingStrategy #USShutdown #FED #TechnicalAnalysis #Forex #MarketUpdate

1/10/68 : XAUUSD ( Europe / London Session )Using it from Europe Session until 7.00PM , I'll new analysis and update at 8.00PM
Resistance
3885-3890
3875-3880
3870
Support
3860
3849-3854
3839-3844

10/1: 3900 in Sight, Watch Support at 3826–3814Today marks the 76th anniversary of the founding of the People’s Republic of China. The whole nation is celebrating. In previous years, a military parade would be held on this day, but this year it was brought forward to September 3rd.
Back to the market—yesterday, gold surged to 3870 before pulling back to around 3790, and today it has once again returned to 3870, reaching a new high. From a technical perspective, a nearly $100 rally suggests that some correction is due. Current support is mainly at the 3848–3842 zone, with stronger support at 3826–3814.
On the daily chart, this round of the rally is likely approaching its end today. However, the overall structure remains healthy, meaning a pullback followed by another leg up is quite possible. On the weekly timeframe, the bullish trend is not yet finished, so gold still has room to make new highs in the medium term.
Now that the price has risen near 3875, testing 3900 is within reach. That level will likely act as a new psychological barrier, so a pullback from there would be normal and could present trading opportunities.
📌 Trading plan for today:
If gold rises to the 3900 area → consider short positions.
If it pulls back to the 3840 area → look for long opportunities.

Gold Volatility: New Highs Ahead?Gold bottomed out and rebounded on Tuesday, breaking below the 3800 level with a significant decline. Most market participants expected a trend reversal; however, the subsequent rise during European and US sessions demonstrated the strength of the bullish sentiment, driving gold sharply higher.
The bullish momentum remains strong in the short term, with gold consolidating around 3860. The fresh high reached in early Asian trading, around 3875, further reinforced the bullish sentiment.
The 1-hour line is also rising in slow fluctuations. In the short term, we need to focus on the trend of the European session. If the bulls are strong, the retracement of the European session will be relatively limited, otherwise it will lose the momentum to continue to attack; and the top and bottom conversion below will also be maintained around 3855, which may form a watershed position.
You can try to continue to go long near this position, and if the European session breaks down, then we need to abandon the long strategy in the US session. Currently, the competition between bulls and bears is fierce, and prudent traders can maintain a wait-and-see attitude for a period of time.
For more aggressive traders, consider buying around 3855, with a profit target of 3880-3890 and a stop loss at 3845.

Gold experiences a correction. The bull market continues.Gold saw a sudden and significant pullback on Tuesday, but under the influence of a series of risk-averse news related to the potential US government shutdown, gold bulls rallied again, pushing prices higher. Gold closed the day at a high level. The strength of the gold bulls remains robust; this single-day correction suggests that the upward momentum for gold is still strong.
Although gold fell significantly, it did not break below the key support level of 3791, indicating that the bears did not gain complete control. After a short-term correction, the bulls launched a counterattack. The 1-hour moving average for gold remains upward, with no signs of a trend reversal. The bullish momentum for gold is still strong, and the moving average support has now moved to around 3828.
Quaid believes that gold may continue its upward trend, as the current gold bull market is unlikely to end soon. Quaid recommends continuing to buy on dips, maintaining a bullish stance on gold.
Trading Strategy:
Buy around 3825-3830, with a stop loss at 3805, and target profit levels of 3865-3875.
