Gold Volatility: New Highs Ahead?Gold bottomed out and rebounded on Tuesday, breaking below the 3800 level with a significant decline. Most market participants expected a trend reversal; however, the subsequent rise during European and US sessions demonstrated the strength of the bullish sentiment, driving gold sharply higher.
The bullish momentum remains strong in the short term, with gold consolidating around 3860. The fresh high reached in early Asian trading, around 3875, further reinforced the bullish sentiment.
The 1-hour line is also rising in slow fluctuations. In the short term, we need to focus on the trend of the European session. If the bulls are strong, the retracement of the European session will be relatively limited, otherwise it will lose the momentum to continue to attack; and the top and bottom conversion below will also be maintained around 3855, which may form a watershed position.
You can try to continue to go long near this position, and if the European session breaks down, then we need to abandon the long strategy in the US session. Currently, the competition between bulls and bears is fierce, and prudent traders can maintain a wait-and-see attitude for a period of time.
For more aggressive traders, consider buying around 3855, with a profit target of 3880-3890 and a stop loss at 3845.
Xauusdsignal

Gold experiences a correction. The bull market continues.Gold saw a sudden and significant pullback on Tuesday, but under the influence of a series of risk-averse news related to the potential US government shutdown, gold bulls rallied again, pushing prices higher. Gold closed the day at a high level. The strength of the gold bulls remains robust; this single-day correction suggests that the upward momentum for gold is still strong.
Although gold fell significantly, it did not break below the key support level of 3791, indicating that the bears did not gain complete control. After a short-term correction, the bulls launched a counterattack. The 1-hour moving average for gold remains upward, with no signs of a trend reversal. The bullish momentum for gold is still strong, and the moving average support has now moved to around 3828.
Quaid believes that gold may continue its upward trend, as the current gold bull market is unlikely to end soon. Quaid recommends continuing to buy on dips, maintaining a bullish stance on gold.
Trading Strategy:
Buy around 3825-3830, with a stop loss at 3805, and target profit levels of 3865-3875.

Gold Trade Set Up Our morning buy set up played out perfectly bouncing off 15m demand to secure 200 pips now i see a 15m supply that price can play off of before continuing higher so i have a sell limit placed there to target the most recent 15m demand
www.tradingview.com

GOLD H2 OUTLOOK !Letsss Goo
Selling Gold Guys
PENDING ORDER : 3850 , 3870 SELL ZONE
REASONS
TURTLE SOUP
IFVG
FVG
ORDER BLOCK
Hope You Got It ? Enjoy It

The trend has not changed, bulls are still the main themeGold experienced another rollercoaster ride this evening, with both bulls and bears having a very volatile day. Gold has rebounded to around 3855 and then fell into high-level fluctuations. There is no good entry point in the current trend, so waiting and watching for the time being is a good decision. If gold in the US market continues to rise to around 3870 and can form an M-top trend in the short term, then I will participate in shorting gold moderately based on market conditions. If gold first falls back to around the intraday starting point of 3825, we can still consider continuing to go long on gold.
First, Trump’s new round of tariffs will take effect tomorrow, October 1st. Second, the risk of the US government shutdown has not been eliminated, and short-term risk aversion still lingers in the market. At the same time, the gold price is still above the MA10 moving average, and the short-term bullish structure has not been destroyed. Therefore, for intraday trading, I still tend to focus on long positions and short positions as a supplement.

Gold is making another record pullback then spike This chart analysis of XAU/USD (Gold vs US Dollar) on the 1-hour timeframe shows a bullish outlook with a focus on the support trend line.
Price recently pulled back after a sharp rise but is holding above the support zone and support trend line.
If the support holds, gold is expected to bounce and resume its upward move.
Key resistance levels to watch are 3873 and 3900, with a potential target at 3910 (New ATH).
A break below the support trend line could weaken bullish momentum, but as long as it holds, the outlook remains positive.
👉 Overall, the analysis suggests a bullish continuation setup with higher targets if support sustains.

Gold retracement? The trend remains unchanged.Gold continued its typical pattern of rising and then falling on Tuesday, reaching a high near 3872 before retracing, and a low near 3793 before rebounding upwards.
The gold daily level shows a large positive line, and it is still in a bullish trend. After a deep correction on Tuesday, it rose again, indicating that gold needs adjustment. Short-term focus should be on whether gold can sustain its upward momentum.
On the whole, Quaid believes that gold is adjusting at a high level and there is a probability of maintaining a range of fluctuations. In short-term operations, a high-altitude and low-multiple strategy should be considered. In the short term, pay attention to the upward suppression range of 3855-3865, and pay attention to the strong support of 3820-3800 below.
Trading Strategy:
Buy in batches between 3830 and 3820, with a stop loss at 3810. Profit range: 3850-3865.

ANFIBO | XAUUSD this week. I'm still bullish up to $3880/ozHi guys, Anfibo's here!
OANDA:XAUUSD Analysis – Start of the Week
Overall Picture:
As I predicted earlier, gold has skyrocketed past the $3,800/oz mark, delivering more than 700 pips of profit from the strategy I previously outlined . This is clear evidence of the strength of the prevailing bullish trend, as safe-haven flows continue to pour into gold amid ongoing global economic uncertainties.
Looking ahead to this week, the outlook remains in favor of the bulls. If no adverse news emerges, I believe gold is highly likely to continue its breakout and challenge the $3,880/oz level – the next key resistance zone.
Technical Outlook:
Short-term trend: Strong increase, momentum remains stable on H4 and Daily frames.
> SUPPORT KEY / BUY ZONES : 3800- 3787 - 3750 - 3723 - 3713 - 3703
> RESISTANCE KEY / SELL ZONES : 3825 - 3835 - 3865 - 3880
Here's my Trading Plan today:
>>> SELL ZONE:
ENTRY: 3834 - 3836
SL: 3840
TP: 3800 - 3790
>>> BUY ZONE:
ENTRY: 3790 - 3800
SL: 3780
TP: 3825 - 3835 - 3865
Risk Management:
- Prioritize buy trades in line with the dominant trend, limit countertrend shorts.
- Maintain a R:R ratio of at least 1:2 on all setups.
- Manage capital strictly, avoid overtrading during sideways phases before breakout.
HAVE A GREAT WEEK, GUYS!!!

ANFIBO | XAUUSD Analysis – Daily Trading Plan (09.30.2025)Hello traders, Anfibo's here!
OANDA:XAUUSD Analysis – Daily Trading Plan
Overall Picture:
As anticipated, OANDA:XAUUSD has surged strongly above the $3,865/oz resistance level, delivering more than 600 PIPS of profit from the previously executed trading plan. This once again confirms the strength of the dominant bullish trend and the market’s confidence in gold as a safe-haven asset.
Heading into this week, I remain bullish, with gold likely to test the $3,880/oz level and potentially push further toward $4,000/oz, provided no negative news emerges. The $4,000 mark is not only a key psychological round number resistance but also aligns with the projected target of wave 5 in Elliott Wave structure on the Monthly timeframe – an area where strong profit-taking pressure often occurs. Traders should pay close attention to this zone.
Technical Outlook:
Short-term trend: Strong increase, momentum remains stable on H4 and Daily frames.
> SUPPORT KEY / BUY ZONES : 3790 - 3770 - 3750 - 3723 - 3713
> RESISTANCE KEY / SELL ZONES : 3825 - 3845 - 3860 - 3870 - 3882
Here's my Trading Plan today:
>>> SELL ZONE:
ENTRY: 3860 - 3870
SL: 3873
TP: 3835 - 3800
>>> BUY ZONE:
ENTRY: 3785 - 3795
SL: 3780
TP: 3835 - 3860 - 3870 - 3880
Risk Management:
- Prioritize buy trades in line with the dominant trend, limit countertrend shorts.
- Maintain a R:R ratio of at least 1:2 on all setups.
- Manage capital strictly, avoid overtrading during sideways phases before breakout.
GOODLUCK GUYS!!!

Gold – Straight Up, Straight Question1. Yesterday’s Move Recap
Like everyone else these days, I’m trying to make some sense of Gold’s move. Let’s be honest: even if you were extremely bullish, you wouldn’t have expected this kind of vertical line in the past 6 weeks or so.
The market is clearly overextended, and while momentum is impressive, technical traders know what usually follows such parabolic moves.
2. Key Question
Is Gold about to enter a much-needed correction, or can this euphoric rally defy gravity for longer?
3. Technical Observations
• Since the 2700 ATH zone in September, Gold has been carving out a repeating rhythm:
o Monday: explosive new ATH push
o Tuesday: spikes and volatility
o End of the week: corrective drop
• The last strong move (Friday the 19th → Wednesday the 23rd) measured around 1600 pips.
• If we project a similar extension from last Friday’s start, the measured move points toward 3885–3890 — right at the top of the newly formed channel.
This zone is not a certainty but an interesting confluence of measured move symmetry and technical channel resistance.
4. Why I Expect a Correction
• Gold has recently shown a tendency to correct after Wednesday.
• We are already in stretched territory with limited room for new buyers at these levels.
• Corrections are not only natural but necessary for healthy continuation.
5. Trading Plan
For me, the only trade that makes sense here is shorting spikes into resistance — anticipating a strong correction. I’m currently flat, but if we see exhaustion signs near 3885–3890, I’ll consider positioning short. The same strategy worked well last time,so...
6. Closing Thought
Patterns don’t always repeat perfectly, but they rhyme. If Gold follows its recent script, a midweek top followed by correction wouldn’t surprise me at all. 🚀

Gold Trade Set Up Sep 30 2025Price made ATH once again but pushed down 700 pips in London session making a LL and creating a big 4h FVG so i will either want to see price trade into the 4h FVG or Fib levels, make a LH before trading lower or wait for a BOS on the 5m of the most recent low followed by a test of 5m Supply to trade lower to PDL

30/9/68 : XAUUSD ( US Session )Using it from US Session until 11.00AM , I'll new analysis and update at 12.00PM
Resistance
3836-3841
3826-3831
3820
Support
3809
3799-3804
3787-3793

XAUUSD BUY SETUP Price action trading from a 4Hour Decisional Level and creating a PD Array as well, price showing its willingness to respecting bullish pd arrays, like fair value gaps and disrespecting the bearish ones. Expecting price to trade higher from the entry.

rally back up to sweep the BSL again.POI (Point of Interest): Highlighted in purple around the 3,780 – 3,790 level, where price is expected to react.
BSL (Buy Side Liquidity): Marked in blue near the 3,860 – 3,880 zone, suggesting liquidity resting above recent highs.
SSL (Sell Side Liquidity): Marked in red near the 3,710 – 3,720 zone, showing liquidity below recent lows.
Price Action: Price made a strong bullish move upward, tapped into the BSL zone, then rejected sharply down toward the POI area.
Projection: The dotted arrow suggests a bullish expectation — price may retrace to the POI and then rally back up to sweep the BSL again.

ElDoradoFx PREMIUM 2.0 – GOLD FORECAST (30/09/2025)
📊 XAUUSD Deep Analysis (30/09/2025 – London Session)
Daily (D1):
• Gold rejected the 3,871 high, forming a strong bearish rejection candle.
• Structure remains bullish above 3,769–3,770, but today’s move shows correction pressure.
• Trend is intact while above the 10EMA (~3,769), with next support at 3,733–3,740.
1H Chart:
• Clear breakdown from 3,863–3,871 resistance.
• Price is now sitting around 3,802, testing 200 EMA + Fib retracement zone.
• Momentum indicators (MACD & histogram) show increasing bearish pressure, RSI cooling off from overbought.
15M & 5M Charts:
• Strong bearish momentum with BOS (break of structure) confirmed.
• 15M shows a descending channel, short-term support at 3,797–3,800.
• 5M chart oversold but still pressing lower, confirming short bias unless a sharp reversal forms.
⸻
🟡 Fibonacci Golden Zone
Using swing low 3,769 → swing high 3,871:
• 38.2% = 3,833
• 50% = 3,820
• 61.8% = 3,807
➡️ This zone (3,833–3,807) is now active support — price is inside it. If it fails, deeper retracement toward 3,782–3,769 is likely.
⸻
⚡ Scalping Opportunities (5M & 15M, 60 pip SL max)
🔹 Sell Scalps (preferred while below 3,833–3,840):
• Entry: 3,832–3,838 rejection
• TP: 3,820 → 3,812
• SL: ~3,844 (60 pips)
🔹 Buy Scalps (counter-trend, only if Fib support holds):
• Entry: 3,804–3,801 zone
• TP: 3,820 → 3,828
• SL: ~3,795 (55–60 pips)
⸻
📌 Breakout Levels to Continue Trend
• Bullish: Break & hold above 3,842 → recovery toward 3,858–3,871.
• Bearish: Break below 3,797 → opens 3,782–3,769.
⸻
✅ Summary
Gold is correcting inside the Fib golden zone (3,833–3,807). Short-term momentum favors sells on bounces, but buyers may defend 3,807–3,797. Scalpers can sell rejections under 3,833 or look for countertrend bounces from 3,807–3,810 with tight SLs.

Gold Price Outlook – Trade Setup (XAU/USD)📊 Technical Structure
Gold (XAU/USD) has extended its rally to a new all-time high above $3,870, but short-term charts show slight profit-taking pressure. Price action is consolidating within a narrow range between Support Zone $3,842–$3,846 and Resistance Zone $3,869–$3,873. As long as the support holds, the bias remains bullish with potential continuation towards higher resistance levels.
The ascending trendline is intact, suggesting the trend remains strongly upward. A decisive close above $3,873 could open the door to $3,900–$3,910 levels in the near term.
🎯 Trade Setup
Entry: $3,846–$3,842 (Support Zone retest)
Stop Loss: $3,840
Take Profit 1: $3,873
Take Profit 2: $3,900
R:R Ratio: ~1 : 4.04
🌍 Macro Background
Gold’s rally is supported by geopolitical tensions, US government shutdown risks, and dovish Fed expectations. The USD remains under pressure as markets price in a 90% probability of a Fed rate cut in October and a 70% chance of another cut in December (CME FedWatch). Additionally, escalating geopolitical risks—Russia’s warning over US missile supplies to Ukraine and heightened Middle East tensions—are fuelling safe-haven flows into gold.
Meanwhile, US political uncertainty continues as President Trump’s last-minute negotiations with Congress failed to yield a budget agreement, keeping the government shutdown threat alive. This adds another layer of support for gold’s safe-haven demand.
🔑 Key Technical Levels
Resistance: $3,869 / $3,873 / $3,900
Support: $3,846 / $3,842
📌 Trade Summary
Gold remains in a bullish structure, with strong fundamental backing from Fed rate cut bets and geopolitical risks. Dips into the support zone near $3,846–$3,842 are likely to attract buyers, targeting $3,873 and potentially $3,900+. Only a break below $3,840 would weaken the bullish bias.
⚠️ Disclaimer
This analysis is for reference only and does not constitute trading advice. Trading involves significant risk, and proper risk management is essential.

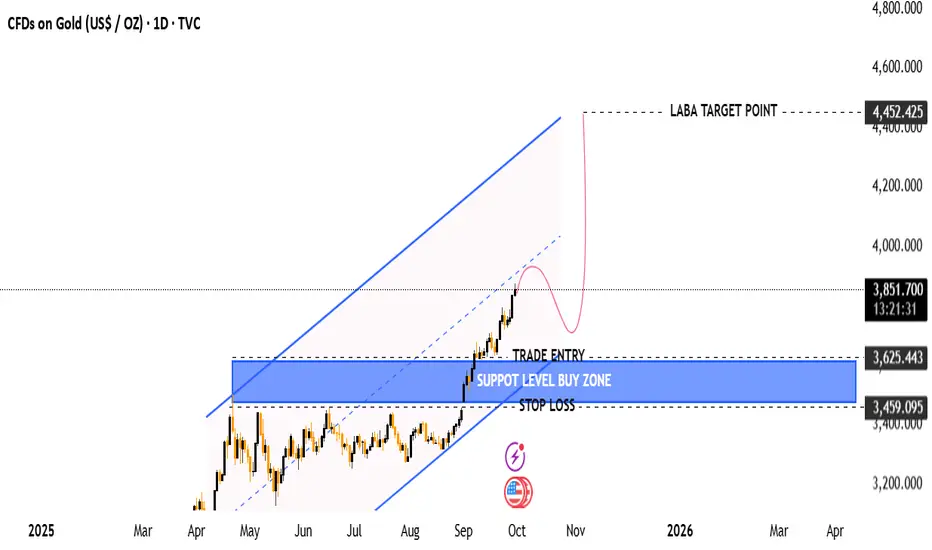
(XAU/USD) Daily Analysis – Bullish Continuation Setup Toward $4,(Gold Daily - as of Sep 30, 2025)
Current Price: ~$3,851.68
Trend: Strong uptrend with price following a rising channel
Timeframe: Daily candles
Tool Used: TradingView
🧩 Key Chart Elements
Support Level Buy Zone (Blue Box)
Range: $3,459.10 – $3,625.44
This is the planned re-entry/buy zone.
Coincides with a previous resistance zone turned support, and the lower bound of the channel.
Trade Entry Point
Suggested entry near $3,625.44
Aligned with the lower edge of the blue support zone.
Stop Loss
Placed slightly below the blue zone at $3,459.10
This protects against a breakdown from the channel and invalidation of the setup.
Price Action Forecast (Pink Line)
Expectation of a short-term pullback into the buy zone.
Followed by a strong bullish continuation toward the target.
Target Point
$4,452.425 marked as the LABA TARGET POINT
Suggests a long-term upside potential of around +17% from current price levels.
Trend Channel
Price is respecting an upward sloping parallel channel.
This provides structure and validation for the projected bullish move.
📈 Strategy Summary
Element Value
Buy Zone $3,459 – $3,625
Target $4,452
Stop Loss ~$3,459
Risk/Reward Favorable
Trend Bullish
🔍 Final Thoughts
This is a momentum-based trend-following strategy:
Wait for a retracement into the support zone.
Look for bullish reversal confirmation (e.g. bullish engulfing, RSI bounce, etc.).
Enter long with stop just below the zone.
Hold for the move toward ~$4,450.
Bulls are going wild. Is a pullback an opportunity?The gold market has recently demonstrated a strong, one-sided upward trend. Gold prices surged again on Tuesday, reaching a new all-time high, confirming the bulls' absolute dominance. The early Asian session low has become a key intraday turning point. As long as prices hold above this level, the short-term bullish trend will persist. Trading strategies should prioritize buying on dips.
Analysis of multiple technical charts indicates a bullish trend. The monthly chart indicates a solid long-term uptrend; the weekly and daily charts are also trading above key support levels, providing support for a medium-term upward trend. The four-hour chart is particularly crucial. After effectively breaking through resistance last Friday, short-term bullish momentum is strong. On the whole, the strategy should continue to follow the trend. The European session should focus on entering the market at key support and resistance levels. The focus on the lower side is the 3850-3840 support line. The short-term target on the upper side can be seen in the 3890-3900 area.
Operational Strategy:
Short at 3875-3880, stop loss at 3890, profit target at 3855.
Long at 3855-3850, stop loss at 3840, target at 3880-3890.

Swing trading, holding short positionsI executed the short trade as planned and added to the short position in batches as gold rallied. Current technical analysis is no longer valid; in the short term, gold's price is primarily driven by news events. Please remember, there is no market that only goes up and never goes down. Although most people are bullish at the moment, how many people really dare to chase the long position in an extreme rising market? Gold is currently setting new historical highs, but today gold is facing the end of the monthly line. In addition, the situation in the Middle East has eased. Once bad news comes, those who blindly go long will suffer huge losses. Therefore, in the short term, I am still inclined to short gold at the top. Since we adopt swing trading and have sufficient funds in the account, short-term floating losses are still within our controllable range. During this period, I will flexibly adjust the trading layout according to market trends. If you are currently in trouble with your short position, you can contact me for help.

Gold 09/30 |Safe-haven flows surge | Gold sails toward new highs🟡 XAU/USD – 30/09 | Captain Vincent ⚓
🔎 Captain’s Log – Context & News
US Politics : Meeting between Trump and bipartisan leaders ended without agreement → growing risk of a US government shutdown by Wednesday.
Conflict : Democrats demand concessions, Republicans fiercely oppose → wide gap remains, both sides blaming each other.
Market : Investors watch JOLTS data and speeches from 3 FED members, but political risks are the strongest catalyst for Gold.
Trend : Safe-haven flows keep pouring into Gold → increasing likelihood of testing new ATH.
⏩ Captain’s Summary : US political seas are stormy, Gold becomes the fortress of safety. The voyage toward ATH is widening.
📈 Captain’s Chart – Technical Analysis (H1)
EMA : EMA 34 (yellow) > EMA 89 (red) → bullish trend clearly dominant.
Golden Harbor (Support / Buy Zone)
Near FVG: 3,856
FVG Scalping: 3,842
Big Volume Dock: 3,827
Storm Breaker (Resistance / Sell Zone)
ATH test: 3,916 – 3,917
Market Structure : Gold broke out strongly, now trading around 3,870. Main trend remains bullish, with 3,842 – 3,827 as key anchor zones.
🎯 Captain’s Map – Trade Plan
✅ Buy (main priority)
Buy Zone 1 – Scalping FVG
Entry: 3,842 – 3,844
SL: 3,835
TP: 3,846 – 3,849 – 3,852 – 3,859 – 3,8xx
Buy Zone 2 – Big Volume
Entry: 3,827 – 3,824
SL: 3,815
TP: 3,870 – 3,899 – 3,916
⚡ Sell (short scalp – high risk)
Sell Zone – ATH test
Entry: 3,917 – 3,920
SL: 3,925
TP: 3,899 – 3,870 – 3,856
⚓ Captain’s Note
“The Golden sails are filled by safe-haven winds, pushing the ship close to ATH. Golden Harbor 🏝️ (3,842 – 3,827) is the ideal dock for sailors to position Buys. Storm Breaker 🌊 (3,916 – 3,920) may unleash violent waves, suitable only for short Quick Boarding 🚤 scalps. If the political storm from Washington breaks out, Gold’s voyage could surpass the peak and expand its horizon.”
📢 If you find the Captain’s Log useful, don’t forget to Follow for the earliest updates.
💬 What’s your view, crew? Will Gold conquer ATH around 3,917 this week?

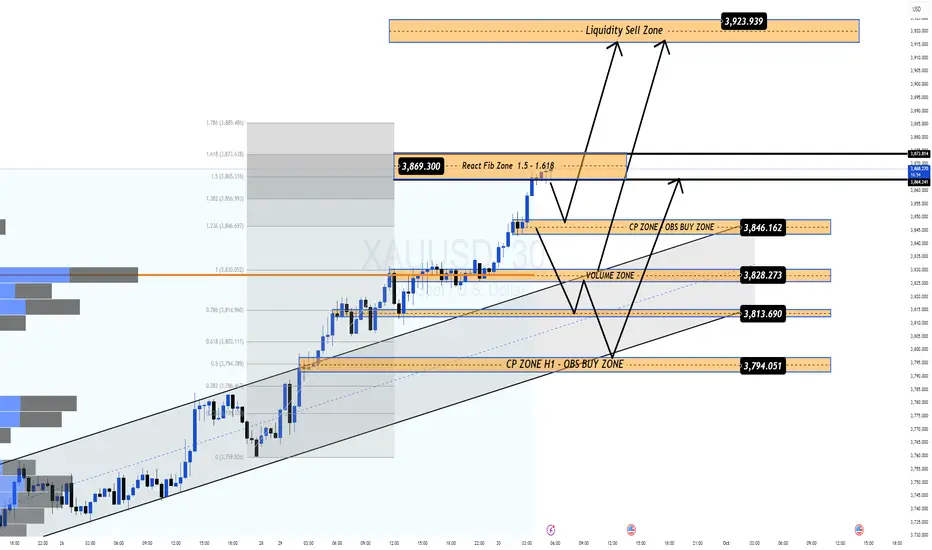
No Room for SELL, Only BUY with Strong Market Flows📊 Market Context
Talks between Trump and US congressional leaders ended with no clear agreement, leaving the threat of a US government shutdown hanging over the market. Both sides continue to blame each other with no common ground in sight.
On the last trading day of the month, focus shifts to the upcoming JOLTS job openings data and speeches from three Fed officials. Combined with political uncertainty and strong safe-haven flows, gold remains heavily supported. For now, there’s no space for SELL setups — the primary direction is still BUY.
🔎 Technical Analysis (H1/H4)
Price has broken higher, continuing to print fresh ATHs with strong bullish momentum.
Main BUY Zone sits at 3846–3844 (confluence of FIB + CP zone).
Secondary support at 3827–3825 (volume zone) where strong reactions are expected.
If momentum persists, medium-term upside targets lie toward the 3923–3930 liquidity zone.
🔑 Key Technical Levels
BUY Zones: 3846–3844, 3827–3825
SELL Zone (Observation only – potential liquidity trap): 3923–3930
📈 Scenarios & Trading Plan
BUY ZONE 1: 3846–3844
SL: 3840
TP: 3850 - 3855 - 3860 - 3870 - 3880 - ???
BUY ZONE 2: 3827–3825
SL: 3820
TP: 3835 - 3840 - 3850 - 3860 - 3870 - 3880 - ???
⚠️ Risk Notes
Expect volatility with JOLTS data and Fed speeches today.
Avoid FOMO buying at highs — wait for price action confirmation at key zones.
Manage position size carefully as end-of-month trading can bring unexpected swings.
✅ Summary
Gold remains firmly in bullish territory, supported by political risks and macroeconomic uncertainty. Plan of the day: prioritize BUY entries at 3846–3844 and 3827–3825, with extended targets at 3880+ and potentially 3920+. Momentum is strong, and following the BUY side remains the higher-probability path.
📢 Stay tuned with MMFLOW TRADING for real-time updates and BIGWIN setups!
30/9/68 : XAUUSD ( Europe / London Session )Using it from Europe Session until 7.00PM , I'll new analysis and update at 8.00PM
Resistance
3878-3884
3877-3882
3872
Support
3862
3851-3856
3841-3846

GOLD H1 Chart Update for 30 Sep 25Hello guy,
GOLD H1 Zonal chart just shared with you, as you can see that there multiple psychological zones appear there
Try to go with Psychological zones in Long direction, Trend remains bullish in GOLD
we might see 4000 Giant Psychological zone in the near term
Today is monthly closing, Stay Active
Disclaimer: Forex is Risky
