Gold Trade Secured 600 pips!On friday price made a HH/HL on the 1h so i was expecting a continuation higher as long as price made HL which it did so i bought at a 15m demand zone which played out perefectly securing 600 pips
www.tradingview.com
Xauusdsignal

Gold Trade Set Up Sep 29 2025Price pushed well above PDH an made ATH again creating HH/HL so price is bullish as of now but if price breaks and closes under the most recent support and demand i will look for sells but if price respects the 15m demand and bounces i will look for a continuation higher
www.tradingview.com

XAU/USD: When Common Sense Beats Hype1. Market Recap
Gold’s rally looks unstoppable. Fundamentals are clearly supportive and technically, the chart screams bullish .
But here comes the trader’s problem: just saying “Gold is bullish” doesn’t make a trade. Everyone knows that already. What matters is not the direction, but the structure of the trade itself.
2. The Educational Point – The 3 Pillars of Every Trade
No matter what market you trade, a professional trader always defines three things before taking a position:
1. Entry Point – where you get in.
2. Exit Point (Target) – where you aim to take profit.
3. Negation Point (Stop-Loss) – where you admit you’re wrong and cut the trade.
Without all three, you don’t have a trade — you just repeating what everyone knows.
3. The Current Problem With Gold
• If you buy at market (3816), your nearest stop is today’s low (3758). That’s ~600 pips risk, and with a 1:2 ratio, you need 3950 just to make sense of it. Not impossible, but not elegant either.
• If you wait for a dip to support at 3785, risk improves to ~300 pips. But this setup is already a 450 pip fail from the ATH — and failures at highs are not to be ignored and not very bullish either.
• Selling at market? Again tricky, because spikes in bullish trends can wipe out shorts before the market even breathes.
In short: at current levels, both long and short lack a clear, controlled setup.
4. My Trading Approach
Here’s where I apply common sense:
• Gold is already +1.5% since Friday’s close.
• If it extends to 3850, that’s where I’ll look to fade the move.
• Even if it’s not a major correction, an intraday drop is realistic. From 3850, a 500 pip move back to 3800 is enough to structure a 1:2 trade.
• If stop-loss gets hit, so be it — that’s trading.
5. Conclusion
At current price (3816), I don’t see a clean entry and I don’t have a favorite scenario. However, if Gold pushes into 3850, the most probable outcome in my view is at least a short-term correction.
This should be a trader’s mindset: not chasing every move, but waiting until risk, reward, and probability align. 🚀


ANFIBO | XAUUSD - The week's last day, I'm bullish over $3800Hi guys, Anfibo's here!
OANDA:XAUUSD Analysis – Daily Trading Strategy
Overall Picture:
At present, gold (XAUUSD) continues to hold steadily within the H4 bullish channel, without any unusual volatility. The dominant uptrend remains intact, and the market structure still favors buyers. Personally, I remain optimistic that gold will soon head toward a new ATH above $3,800/oz in the medium term. However, in the short term, the market may continue to fluctuate around key support and resistance levels before confirming its next move.
Technical Outlook:
Short-term trend: Solidly bullish, though momentum is slowing; accumulation may form before the next breakout.
> SUPPORT KEY / BUY ZONES : 3740 - 3723 - 3713 - 3703
> RESISTANCE KEY / SELL ZONES : 3770 - 3777- 3788 - 3799 - 3836
Here's my Trading Plan today:
>>> SELL ZONE:
ENTRY: 3769 - 3775
SL: 3780
TP: 3740 - 3723
>>> BUY ZONE:
ENTRY: 3700 - 3705
SL: 3695
TP: 3760 - 3800 - 3836
Risk Management:
- Prioritize buy trades in line with the dominant trend, limit countertrend shorts.
- Maintain a R:R ratio of at least 1:2 on all setups.
- Manage capital strictly, avoid overtrading during sideways phases before breakout.
✅ Conclusion:
Gold is maintaining a stable uptrend on H4, with market structure still supporting buyers.
Main scenarios: Buy on dip around 3700 – 3705.
A clear move beyond 3780 would likely pave the way toward a new ATH above $3,800.
HAVE A NICE WEEKEND, GUYS!!!

GOLD HIGH PROBABILITY SETUP SOON!!!🚨 XAUUSD HIGH PROBABILITY SELL SETUP 🚨
* Here We Can See Clearly The Next Potential Move For GOLD Coming Hours/Days.
* Keep Your Eyes Close On Your Trading Positions.
* Happy PIP Hunting Traders.
FXKILLA.

3780-3790: A potential price reversal point; buy on dips.On Friday night, we expect gold to hit a new high of 3800-3810 after holding the key support of 3765-3755. At present, gold has broken through the expected target and is expected to move towards 3830.
The current geopolitical situation has worsened, and the new round of tariffs that came into effect on October 1st has continuously stimulated the market's risk aversion sentiment, causing investors to flock to the gold market to seek risk shelter. Today's news needs to focus on the U.S. trading session. Members of the U.S. Congress from both parties are negotiating on avoiding a government shutdown. The U.S. government faces the risk of shutdown. If it is not effectively resolved, this will affect the subsequent release of key data such as NFP CPI.
With the rising gold price, it has broken through previous resistance and reached a new high. The previous high of 3780-3790 has become a key level for a potential trend reversal. During the European session, if gold retraces to this range, we can consider buying gold with a target of 3820-3830.
Gold Soars Past $3,800: Can Shutdown Fears Push Gold to $3,900?📊 Technical Structure
Gold (XAU/USD) has surged to a record high above $3,800, confirming strong bullish momentum within a rising channel. Price action is currently holding above the support zone at $3,774–3,786, while eyeing the next resistance cluster at $3,837–3,848. Beyond this, extended targets sit near $3,910–3,922, aligned with Fibonacci 1.618–2.618 extensions. The structure remains buy-the-dip as long as the channel support holds.
🎯 Trade Setup (Long)
Entry: $3,786–3,774 (on retest of support zone)
Stop Loss: $3,768
Take Profit 1: $3,837
Take Profit 2: $3,910
Take Profit 3: $3,922
Risk/Reward (R:R): ~1 : 7.71
🌍 Macro Background
Gold’s rally is fuelled by safe-haven flows as the US government shutdown risk looms. Investors are moving into gold amid uncertainty over budget negotiations in Washington, with shutdowns historically boosting demand for safe-haven assets. At the same time, the Fed’s recent 25 bps cut and market pricing of another cut in October (88% probability) and December (65%) lower the opportunity cost of holding gold.
The August PCE inflation came in line with expectations (core +2.9% YoY, headline +2.7%), reinforcing the view that the Fed remains on a gradual easing path. However, hawkish commentary from Fedspeak later today could inject short-term volatility into the USD and cap gold’s momentum.
🔑 Key Technical Levels
Resistance Zone 1: $3,837 – $3,848
Resistance Zone 2: $3,910 – $3,922
Support Zone: $3,774 – $3,786
📌 Trade Summary
Gold maintains a strong bullish structure, underpinned by Fed rate cut expectations and geopolitical + political risks. As long as $3,774–3,786 support holds, the bias remains long, targeting $3,837 initially and potentially $3,910–3,922 if momentum extends. Caution is warranted during Fed speeches, as hawkish tones could trigger short-lived pullbacks.
⚠️ Disclaimer
This analysis is for reference only and does not constitute trading advice. Trading involves significant risk, and proper risk management is essential.

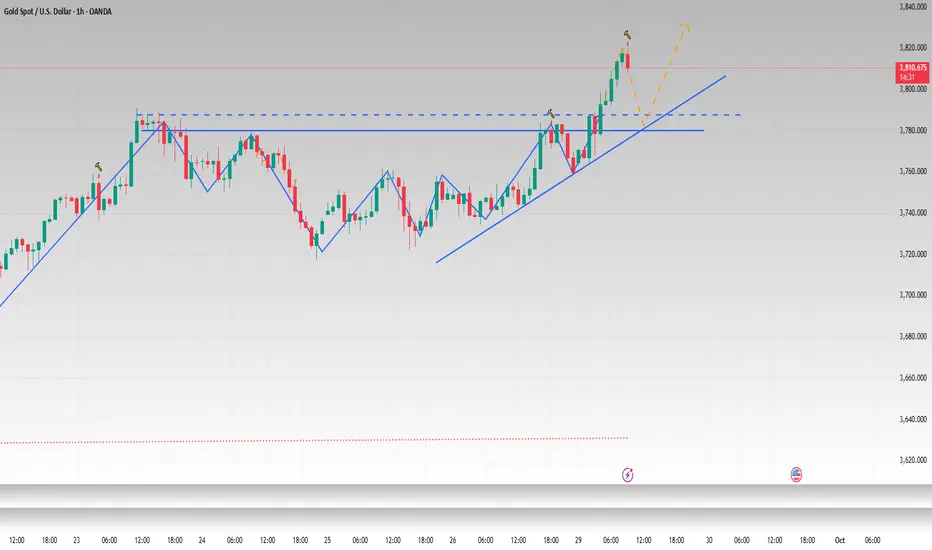
"XAUUSD Bullish Setup Toward 3800–3810"This chart shows the XAU/USD (Gold vs US Dollar) 1-hour analysis.
Price is currently trading around 3769 after a bullish move.
A support trend line is holding price momentum, suggesting buyers are still active above this level.
Immediate support is seen near 3753, while the trendline also aligns with this support zone.
If price respects the support trend line, a bullish continuation is expected.
The upside targets are marked at 3800 as the next key level, and 3810 as a potential new all-time high (ATH).
The projection indicates a possible short-term pullback to the trend line before resuming upward movement.
Overall, the setup suggests a bullish outlook, as long as price stays above the support and trend line.

Buying momentum continues. Has the top been reached yet?Witnessing history once again, gold hit a new all-time high during the Asian trading session, surging by nearly $48.
Why did gold surge again at the start of this week?
1. Growing concerns about a US government shutdown prompted investors to seek safety in traditional store-of-value assets, thus weakening demand for the US dollar and driving gold higher.
2. Ongoing geopolitical tensions, including UN sanctions against Iran, and other risk-averse factors, will continue to benefit gold.
After gold broke through a new high, the previous high of 3790 has now become a potential support level. For buyers, they need to see the price close above the psychological level of 3800 to provide additional support for the record-breaking rally. In the short term, expect some price retracement.
Quaid believes that if the price remains above 3800 during the European session, the next target could be 3850. A decisive break above 3850 could push gold further to around 3880.
Trading Strategy:
Buy around 3790, with a stop loss at 3780, and target profit between 3835 and 3850.
If the price remains above 3800 during the European session without any retracement, consider a small long position at 3800.

29/9/68 : XAUUSD ( Europe / London Session )Using it from Europe Session until 7.00PM , I'll new analysis and update at 8.00PM
Resistance
3825-3830
3815-3820
3810
Support
3800
3789-3794
3779-3784

International dynamics shift. Gold prices rise.Information Summary:
The United Nations imposed a new round of tough sanctions on Iran, directly impacting its economy and nuclear program, triggering a sharp escalation in regional tensions. Iran's assertive stance and refusal to compromise have fueled market concerns about escalating conflict. The rapid decline in gold prices was followed by a strong pullback, which fully confirmed the strong bullish sentiment in the market. It is expected that this geopolitical driver will continue to provide strong upward momentum for gold prices.
Market Analysis:
From a technical perspective, gold closed with a solid bullish candlestick on the daily chart, forming a classic bullish bottoming-out pattern and fully reversing earlier losses. The current gold price has firmly stood above all major moving averages, especially near the 3755 line, which has transformed from resistance to strong support. Influenced by the international situation, bullish momentum is strong in the market.
Quaid recommends going long in line with the market, targeting the 3800 integer mark, and continuing to hold positions after breaking through.

Gold Analysis – Weekly Outlook (Sep 28, 2025# Gold Analysis – Weekly Outlook (Sep 28, 2025)
On the **15M timeframe**, price action is showing clear liquidity structures:
- **Buy-side liquidity** targeted around **3796 – 3781** zone.
- The market created an **ABC corrective move**, with an **inducement** before liquidity grab.
- After the liquidity sweep, a potential **CHOCH** signals possible bearish continuation.
- Price could retrace lower to fill liquidity gaps, with the next demand zone near **3745 – 3736**.
- Below that, further downside liquidity sits around **3730 – 3720**.
### Key Levels:
- **Upside liquidity:** 3796 / 3781
- **CHOCH confirmation:** ~3761
- **Downside targets:** 3745 → 3736 → 3720
### Trading Plan:
If liquidity at **3796 – 3781** is swept and **CHOCH** confirms, we could expect a bearish leg towards the downside liquidity levels.
📊 Structure aligns with Smart Money Concept (SMC) approach: liquidity sweep → inducement → CHOCH → BOS → continuation.

𝐌𝐓𝐗 | Pitstop Zone to Continue the 1,300 Pip Potential Rally1️⃣ Key Levels
• 729 – 737 → Major golden support zone.
• 759 – 760 → Key resistance / breakout trigger.
• 691 – 683 → Strongest potential buy zone of the week.
⸻
2️⃣ Expected Scenarios
• Bearish:
• 4H close below 759 → retest of the 729–737 support zone.
• 4H close below 729 → extension toward 709 → 700 → 691.
• Zone 691–683 is the most important potential reversal area this week, with multiple confluences, possibly triggering a strong rally toward the 3800 high again.
• Bullish:
• 4H close above 760 → continuation toward 780 → 791.
• 4H close above 792 → further bullish momentum targeting 808 → 817 → 830.
⸻
⚖️ Summary
The market is positioned between critical zones:
• Holding above 759–760 confirms strength toward 830.
• Breaking below 729 increases the probability of testing the 691–683 demand zone, which could be the week’s strongest reversal setup.

Gold Trade Set Up Sep 28 2025Price broke structure to the downside on the 15m on friday so i will want to see a pullback into supply before a continuation down towards PDL/SSL
www.tradingview.com

Trend changes? Outlook for next week.Gold rose strongly on Friday, hitting a high of around 3783. It began to fall before the closing of the US market and did not break through the new high. So, will gold hit a historical high or start to correct?
Gold has broken through the recent consolidation range on the 4-hour chart, and the upward trend extends to the historical high of $3,791. If the gold price continues to fall below $3,750, short-term trend will be more bears, and may return to the previous consolidation range. The downward target will focus on 3720-3700. On the upside, if the gold price clearly breaks through the suppression position of 3780-3790, it will release new bullish momentum and pave the way for gold prices to move towards a new price range.
The gold 1-hour trend temporarily remains in a narrow range oscillation, but after continuous oscillation, there are signs of upward movement in the short-term moving average. If the 1-hour moving average cannot continue to run upward, then gold may be in a state of reaching its peak.
Some major data will appear next week, and there is a high probability that the golden week will still remain fluctuating at the beginning of the golden week. If there is no stimulating news, please pay attention to the first support of 3750, followed by the support of 3720 area. In terms of short-term operation ideas in Asia on Monday, Quaid recommended that rebounds should be the main focus, and pullbacks should be the supplement. The short-term focus on the suppression position of 3780-3790, and the lower focus on the first-line support of 3740-3730.
The happy weekend is approaching, I wish you all a happy transaction next week.

Plan 28-sep-2025Related Information:!!!
Federal Reserve Governor Stephen Miran told Fox Business on Thursday that there is no clear evidence of tariff-driven inflation, but it appears to be holding back policymakers. The economy is more vulnerable to downside shocks because Fed policy is too tight, and that policy is restraining by 200 basis points, Miran added.
Separately, Chicago Fed Governor Austan Goolsbee noted that the labor market seems to be cooling, but inflation is rising, and relying on inflation being temporary makes him uneasy. Goolsbee said interest rates could come down a bit further if inflation moves toward 2%, but he is also cautious about cutting rates too soon, stressing that inflation must be brought back to the 2% target.
personal opinion:!!!
XAUUSD sideway 3750-3780, breakeven 3780 then 3800(ATH)

XAUUSD Weekly Scenarios⚙ Weekly Scenarios
Bullish Scenario:
The price holds above support at ~$3,660 and breaks resistance at ~$3,760–3,800.
Then, a rally to $3,900 and beyond is possible, especially with support from rate and geopolitical news.
Consolidation:
The price may move sideways between $3,660 and $3,760 until a strong signal (from news or volume) breaks the range.
Bearish Scenario:
A break below $3,660 with volume confirmation could lead to a correction to $3,600 or even lower.
In this case, it's important to watch whether lower support levels hold, otherwise a deeper pullback is possible.
🔎 Conclusion
The overall picture for the week is bullish, but with the risk of a pullback or consolidation due to overbought conditions and resistance.
Key: Watch for a reaction in the resistance zones of ~$3,760–3,800 and for support to hold at ~$3,660.
For traders: consider buying on dips near support zones and shorting (or taking profits) as the price approaches strong resistance if it fails to break through.

Reaching the High Point. Price Retracement?After a period of consolidation this week, gold surged upwards, reaching a new all-time high near $3791. However, following the retracement on Wednesday, the upward momentum weakened. On Friday, during the US session, gold briefly touched $3783 before retracing, closing near $3759. It remains above the moving average, suggesting a potential second wave of upward movement.
Overall, the market sentiment remains bullish, and a series of bullish patterns suggest that gold may continue its upward trend next week. The Friday pullback could be seen as a consolidation by the bulls. The resistance level around $3770, where the previous high and low were formed, will be an important short-term resistance level.
If the Asian market opens at 3770 under downward pressure on Monday, it is very likely to break down again in the later period, and the low point of 3717 generated last week may also be broken.
The current unilateral trend is not clear. Try to short near 3770 when the Asian market opens next Monday. Focus on the profit range near 3730 and set a stop loss at 3780. If there is no sign of decline in the European session, adjust the strategy in time in the US session.

XAUUSD H1 OUTLOOK FOR NEXT WEEKI’ve Setup My Sniper Shot For A Sell From The Premium IFVG
Who’s With Me ?
Selling on IFVG And FVG Zones
Target Is Sell Side Liquidity
Good Luck Guys

XAUUSD H1 OUTLOOK I’ve Setup My Sniper Shot For A Sell From The Premium IFVG
Who’s With Me ?
Selling on IFVG And FVG Zones
Target Is Sell Side Liquidity
Good Luck Guys

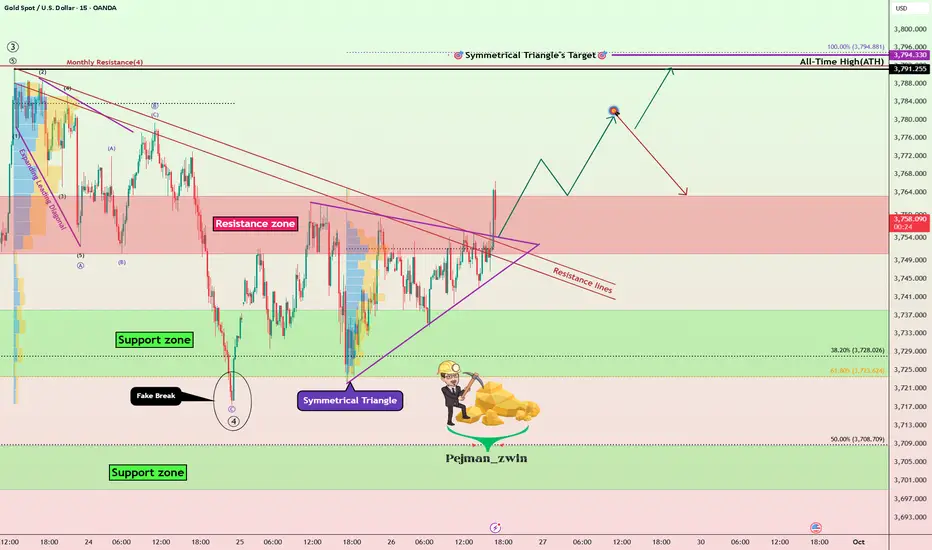
Gold Roadmap: Breakout Confirmed –New ATH or Another Correction?Gold ( OANDA:XAUUSD ) as I expected in the previous idea (Short and Long positions hit the target).
First of all, I should say that this analysis is for the short term and on a 15-minute time frame.
Gold seems to have managed to break the Resistance lines, Resistance zone($3,763-$3,750), and the upper line of the symmetrical triangle in the past few minutes.
I expect Gold to rise to at least $3,779, and then there are two scenarios for Gold: creating a new All-Time High, OR re-correcting.
Stop Loss(SL): $3,741.7
Please respect each other's ideas and express them politely if you agree or disagree.
Gold Analyze (XAUUSD), 15-minute time frame.
Be sure to follow the updated ideas.
Do not forget to put a Stop loss for your positions (For every position you want to open).
Please follow your strategy; this is just my idea, and I will gladly see your ideas in this post.
Please do not forget the ✅ ' like ' ✅ button 🙏😊 & Share it with your friends; thanks, and Trade safe.
XAUUSD | First Line of DefenseXAUUSD | Watching the First Support
On XAUUSD, I see the first major support around the blue box. That’s where I’ll be paying attention as price drifts lower.
When we get there, I’ll be watching the 1-hour CDV closely. A positive divergence would suggest buyers are absorbing and could set up a tactical bounce.
My track record speaks for itself: the win rate of my trades is listed below. Trading with me costs nothing. You can check my profile.
I keep my charts clean and simple because I believe clarity leads to better decisions.
My approach is built on years of experience and a solid track record. I don’t claim to know it all, but I’m confident in my ability to spot high-probability setups.
If you would like to learn how to use the heatmap, cumulative volume delta and volume footprint techniques that I use below to determine very accurate demand regions, you can send me a private message. I help anyone who wants it completely free of charge.
I have a long list of my proven technique below:
🎯 ZENUSDT.P: Patience & Profitability | %230 Reaction from the Sniper Entry
🐶 DOGEUSDT.P: Next Move
🎨 RENDERUSDT.P: Opportunity of the Month
💎 ETHUSDT.P: Where to Retrace
🟢 BNBUSDT.P: Potential Surge
📊 BTC Dominance: Reaction Zone
🌊 WAVESUSDT.P: Demand Zone Potential
🟣 UNIUSDT.P: Long-Term Trade
🔵 XRPUSDT.P: Entry Zones
🔗 LINKUSDT.P: Follow The River
📈 BTCUSDT.P: Two Key Demand Zones
🟩 POLUSDT: Bullish Momentum
🌟 PENDLEUSDT.P: Where Opportunity Meets Precision
🔥 BTCUSDT.P: Liquidation of Highly Leveraged Longs
🌊 SOLUSDT.P: SOL's Dip - Your Opportunity
🐸 1000PEPEUSDT.P: Prime Bounce Zone Unlocked
🚀 ETHUSDT.P: Set to Explode - Don't Miss This Game Changer
🤖 IQUSDT: Smart Plan
⚡️ PONDUSDT: A Trade Not Taken Is Better Than a Losing One
💼 STMXUSDT: 2 Buying Areas
🐢 TURBOUSDT: Buy Zones and Buyer Presence
🌍 ICPUSDT.P: Massive Upside Potential | Check the Trade Update For Seeing Results
🟠 IDEXUSDT: Spot Buy Area | %26 Profit if You Trade with MSB
📌 USUALUSDT: Buyers Are Active + %70 Profit in Total
🌟 FORTHUSDT: Sniper Entry +%26 Reaction
🐳 QKCUSDT: Sniper Entry +%57 Reaction
📊 BTC.D: Retest of Key Area Highly Likely
