Bullish momentum strengthens. Trend change?Gold remained volatile before the release of the PCE data, touching around $3761 before retracing to around $3722, consistent with short-term range-bound trading. Recent significant price gains and continuous new highs have boosted bullish sentiment in the market.
However, these continuous new highs have also instilled fear and caution among many traders. Each pullback has served to build momentum for further upward breakouts. With these new highs, short-term bullish sentiment has rebounded.
Looking at the 1-hour chart, the moving average system is running upward. The early price correction touched the lower track of the Bollinger band, and then rebounded to maintain volatility. After the PCE data release, bullish momentum surged, pushing the price sharply higher, currently trading near the upper Bollinger Band. Indicators suggest that bullish strength is gradually recovering.
On the last trading day of this week, the market is likely to maintain a high-level fluctuation trend, but be wary of sudden black swan events. If the price retraces to around $3740, Quaid recommends establishing a long position at that level and waiting for a rebound.
Xauusdsignal

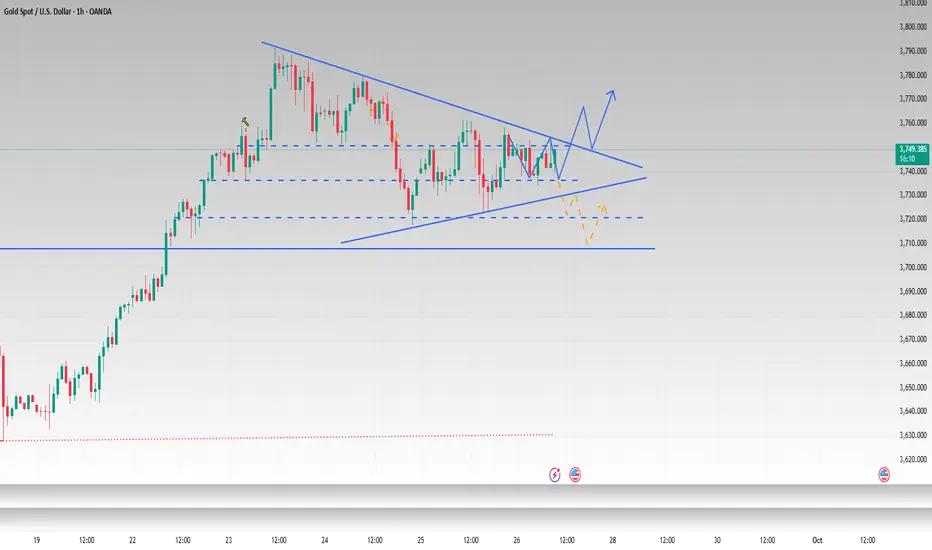
If it doesn't break 3755, we will continue to be bearishYesterday, gold tested the lowest level of 3720 and then began to rebound. In the evening, gold rebounded again to around 3758, but it did not effectively break through the trend suppression, so gold still fluctuated and fell.
Today, gold has traded in a narrow range during the Asian session, with no clear trading direction in the short term. The overall trend is currently consolidating within a triangular pattern. As time goes by, the short-term trend pressure has come to around 3750. The European session will focus on the pressure of 3750-3755. If it fails to break through effectively, gold will continue to fluctuate and consolidate in the short term, and you can consider shorting gold. On the contrary, once 3755 is effectively broken through, it means the end of the short-term downward adjustment. Key support levels are at 3730-3720. For intraday trading, adopt a "buy low, sell high" strategy within the 3750-3720 range, aiming for profit targets of $10-$30, until the triangular pattern is broken. At the same time, it should be noted that 3710-3700 below is still the key support.
Gold Trade Set Sep 26 2025Price is trading within a 1h range but is still bearish until breaking 1h HH at 3761. So will be looking for sells from the most recent 15m supply/OB to target SSL
www.tradingview.com

Gold Pauses: PCE Inflation Report is the Next Battleground.Hello, investors!
Gold saw only a slight 0.1% gain, closing at $3,739.42/oz on September 25, after encountering resistance from better-than-expected US jobs data (weekly jobless claims dropped sharply). This news slightly pared back expectations for a Fed rate cut in October (down to 85%).
However, gold remains supported by dovish Fed comments and potential political instability (like Trump's proposed 100% drug tariff). The market's focus is now entirely on today’s (Sept 26) PCE Inflation Report.
Expert Warning: If PCE is hotter than expected, gold could face sharp, temporary downward pressure.
Technical Analysis & Strategy
Gold is currently consolidating within a triangle pattern and has yet to break the $375x resistance. While further selling pressure is possible before the PCE data, the long-term trend remains bullish.
Outlook: Prioritize Buy positions if the price stays above the Key Level $373x. If the news causes the price to break $373x, be ready to flip the strategy to Sell.
Key Resistance: $3755, $3768, $3778
Key Support: $3738, $3727, $3712
Suggested Trading Strategy (Strict Risk Management):
BUY SCALP
Zone: $3739 - $3737
SL: $3733
TP: $3742 - $3747 - $3752 - $3757 - $3767
BUY ZONE
Zone: $3704 - $3702
SL: $3694
TP: $3712 - $3722 - $3732 - $3742 - $3762
SELL ZONE
Zone: $3776 - $3778
SL: $3786
TP: $3768 - $3758 - $3748 - $3728 - $3708
The market is at a crossroads. What's your strategy today? 👇
#Gold #XAUUSD #PCE #Fed #Inflation #TradingView #ATH

Gold Trade SetupI will risk!!!
It seems we are near at the end of correction wave...
The first target R/R is 2 and the second is 4...

ElDoradoFx PREMIUM 2.0 – GOLD FORECAST (26/09/2025)🔍 Multi-Timeframe Technical Analysis
Daily (D1)
• Gold is trading at 3,752, holding above the 10EMA and the 3,732 pivot support.
• Momentum remains bullish overall after the rally from early September, but candles show hesitation under 3,791 high → signs of consolidation before a potential new breakout.
• As long as 3,732 holds, the structure remains bullish.
⸻
1H (Intraday Structure)
• Price has broken above the descending trendline resistance (~3,748), now retesting this area.
• Support cluster: 3,745–3,740 (aligned with EMA + structure lows).
• Resistance zone: 3,752–3,755 (capping upside before 3,764).
• MACD: momentum just flipped positive, but histogram is shallow → momentum still fragile.
• RSI: mid-zone (~55) → suggests potential to expand higher if resistance breaks.
⸻
15M (Short-Term View)
• Price consolidating 3,745–3,752.
• Higher lows forming since Asian session → bullish micro-structure.
• MACD showing bullish divergence after last sweep of lows near 3,734.
⸻
5M (Scalping View)
• Strong sweep earlier at 3,751, rejection but held 3,747–3,745 base.
• Micro ascending channel → scalpers eyeing breakout confirmation.
• Momentum picking up, but volume still thin → London likely decides breakout direction.
⸻
📌 Fibonacci Golden Zone
Swing High 3,791 → Swing Low 3,732:
• 38.2% = 3,754
• 50% = 3,761
• 61.8% = 3,767
➡️ Golden retracement lies at 3,754–3,767 → exactly where London session resistance sits. A break into this zone will decide continuation vs. rejection.
⸻
🎯 Scalping Setups (Max 60 Pips SL)
✅ Buy Setup (Preferred if bullish momentum holds)
• Entry: Above 3,752–3,754 breakout & retest.
• SL: 3,746 (≈ -60 pips).
• TP1: 3,761
• TP2: 3,767 (Fib 61.8%).
• Reasoning: Break above golden zone support confirms bullish continuation.
✅ Sell Setup (If rejection at resistance)
• Entry: Rejection at 3,754–3,755 or confirmed break below 3,740.
• SL: 3,760 (≈ -60 pips).
• TP1: 3,734
• TP2: 3,722.
• Reasoning: Failure to hold golden zone leads to pullback toward London lows.
⸻
⚠️ Key London Session Levels
• Bullish Breakout: 3,754 → opens 3,761–3,767.
• Bearish Breakdown: 3,740 → exposes 3,734 then 3,722.
• Pivot Level: 3,745 (control zone for scalpers).
⸻
✅ Summary:
Gold sits at a decision point. If 3,752–3,754 breaks and holds, expect bullish continuation into 3,761–3,767 (golden zone). If rejected, scalpers can look for shorts back toward 3,734–3,722. London open will likely provide the breakout.

26/9/68 : XAUUSD ( Europe / London Session )Using it from Europe Session until 7.00PM , I'll new analysis and update at 8.00PM
Resistance
3769-3774
3759-3764
3753
Support
3743
3733-3738
3722-3728

Waiting for the data to be released. Continue to fluctuate?Gold is experiencing a volatile downward trend. On the 4-hour chart, prices are currently under pressure at $3,765. The short-term rebound has completed its technical pattern repair, suggesting further downward movement. The 1-hour chart shows prices trading near short-term support, while the short-term moving average has flattened downward, indicating weakening short-term momentum. Focus on the resistance area around 3,750-3,755 in the short term, while support remains around 3,715.
Gold is currently experiencing small fluctuations. Quaid recommends maintaining trading within the 3,755-3,715 range pending the release of the PCE data.
New analysis and trading strategies will be provided after the data is released.
Gold – Waiting for the Perfect DipIn yesterday’s analysis, I mentioned that after reaching a new ATH just under 3800, Gold could enter a correction, and that this corrective move should be seen as a buying opportunity.
Indeed, we’ve had a pullback, but it hasn’t gone deep enough to trigger my buy limit orders – which kept me on the sidelines for now.
Still, my idea remains unchanged: I expect a liquidity dip closer to the 3700 zone, which stands out as the key support area for buyers.
Trading Plan:
• I continue to look for buying opportunities on dips, ideally around 3700.
• If price holds this zone, the bullish structure remains intact and another run toward ATH levels becomes likely.
• However, if Gold breaks below 3700, the market could enter a deeper correction phase, and I will have to re-evaluate my bias and strategy.

XAU/USD Technical Setup: Reversal Brewing Inside Bearish ChannelAbsolutely! Let's break down the technical analysis chart for **Gold Spot U.S. Dollar (XAU/USD)** on the 1-hour timeframe. Here's what it's signaling:
---
### 📉 Chart Structure: Descending Channel
- The price action is confined within a **descending channel**, marked by two parallel trend lines sloping downward.
- This typically indicates a **short-term bearish trend**, but also sets the stage for a potential **bullish breakout** if momentum shifts.
---
### 🔄 Reversal Signal: Rounded Bottom
- Inside the channel, there's a **rounded bottom pattern**—a classic reversal formation.
- This suggests that selling pressure is weakening and buyers may be preparing to take control.
---
### 📈 Trade Setup Overview
| Component | Level | Purpose |
|----------------|-------------|----------------------------------|
| **Entry Point**| 3,754.95 | Buy trigger after breakout |
| **Target Point**| 3,726.91 | Profit-taking level |
| **Stop Loss** | 3,775.95 | Risk control if breakout fails |
> ⚠️ Note: The **target point is lower than the entry**, which is unusual for a bullish breakout. This might be a labeling error or a short-term scalp strategy. Typically, you'd expect the target to be **above** the entry in a long trade.
### 🧠 Strategic Interpretation
- **Bullish Bias**: The rounded bottom and breakout arrow suggest a bullish move is expected.
- **Risk Management**: The stop loss is placed above the entry, which is unconventional. Normally, you'd place it below the entry in a long setup.
- **Channel Breakout**: If price breaks above the descending channel with volume confirmation, it could trigger a strong upward

Gold Price Outlook – Trade Setup (XAU/USD)📊 Technical Structure
Gold (XAU/USD) is trading near $3,740, consolidating below the descending trendline resistance. The support zone lies at $3,723 – $3,719, while the resistance zone is around $3,761 – $3,765. The price structure shows a “buy-the-dip” bias as long as support holds, but near-term pressure remains capped by the downtrend line. A breakout above $3,765 could open the path toward $3,785.
🎯 Trade Setup
Entry: $3,719 – $3,723 (support retest)
Stop Loss: $3,715
Take Profit: $3,764 / $3,785
Risk/Reward (R:R): ~1 : 5.4
🌍 Macro Background
Markets await the US Core PCE Inflation data later today – the Fed’s preferred inflation gauge. Stronger-than-expected PCE could strengthen the USD and pressure gold lower. On the other hand, a softer reading may revive rate cut expectations, supporting gold. Additionally, Trump’s new tariffs (100% on pharmaceuticals, 50% on cabinets, 30% on furniture, etc.) and ongoing geopolitical risks with Russia provide safe-haven flows that keep gold attractive. Despite the USD holding at three-week highs, investors continue to see gold as a hedge amid policy uncertainty and trade tensions.
🔑 Key Technical Levels
Resistance: $3,764 / $3,785
Support: $3,723 / $3,719
📝 Trade Summary
The overall structure favours a buy-the-dip strategy near support zones, with upside potential toward $3,764 – $3,785 if US PCE comes in softer. However, a stronger inflation print may trigger a deeper pullback below $3,719. Traders should stay alert for volatility around the data release.
⚠️ Disclaimer
This analysis is for reference only and does not constitute trading advice. Trading involves significant risk, and proper risk management is essential.

Gold is trading sideways. Focus on PCE data.Gold's 1-hour moving average continues to trend downward, and gold bears may continue to exert their strength. Although it remains volatile, the overall trend has begun to fluctuate downward, and each rebound in the 1-hour gold price has been under pressure.
On Thursday, the price briefly dipped below the 5-day moving average in Asian trading before stabilizing and rebounding. However, it broke below it again during the US trading session. Although it closed above the moving average, it failed to reverse the weak trend.
Currently, 3715 below has become the core support level. If it breaks through this position downward, the adjustment space may open further. The upper resistance will primarily focus on the pressure near 3760. If this position cannot be broken through strongly, the weak and volatile tone will continue.
Trading strategy:
Short around 3760, stop loss at 3770, profit range 3730-3720.
Short around 3760, stop loss at 3770, profit range 3730-3720.
Maintain this strategy before the release of the US PCE data. After the data is released, observe market trends and adjust the strategy.

3717 Won’t Hold—Gold’s Next Breakdown AheadThe highest point of gold during the day was around 3761. It can be clearly seen that as the bullish momentum of gold gradually declines, the high point of the candlestick chart is also gradually moving downward. Judging from the daily candlestick chart, a bearish candlestick chart appeared for the second consecutive day today, and it is very likely to close in a doji pattern, suggesting that gold is likely to continue to fall.
From the perspective of short-term morphological structure, gold has currently perfectly constructed a downward trend channel based on the wave top areas of 3790, 3778 and 3761; and upper shadows appear on many candlestick charts, suggesting that the selling pressure from above is relatively large, and the center of gravity continues to move downward and test the lower support area many times. Based on the current structure, 3717 is likely not the current low, and gold will continue to fall. The upper short-term resistance is in the 3750-3760 area; the lower support is in the 3715-3705 area, followed by the 3695-3690 area.
Therefore, for short-term trading:
1. Prioritize waiting for a gold rebound and then continue shorting gold within the 3750-3760 area; the short-term target is 3725-3715.
2. If gold first retreats to the 3715-3705 area, we can take advantage of the initial pullback and go long gold in that area, with the short-term target being 3730-3740.

ElDoradoFx PREMIUM 2.0 – GOLD FORECAST 25/09/2025 (ASIA SessioN)🔍 Multi-Timeframe Technical Outlook
Daily Chart
• Price trading 3,750, consolidating just below recent high at 3,791.
• Momentum still bullish overall, but candles show rejection at highs → suggesting possible short-term retracement before continuation.
• 20EMA support at 3,727, stronger structure support at 3,705.
⸻
1H Chart
• Price has created a triangle structure, now testing resistance 3,748–3,751.
• Clear invalidation/decision levels:
• Break & Retest 3,748/3,751 = bullish continuation.
• Break & Retest 3,732 = bearish continuation.
• MACD histogram turning positive, showing early bull momentum.
• RSI mid-zone → neutral bias, awaiting breakout confirmation.
⸻
15M Chart
• Price consolidating above 3,744, respecting intraday demand zone.
• Bullish divergence forming on MACD → supports a possible bounce.
• Key resistance: 3,751–3,756 (short-term profit zone if broken).
⸻
5M Chart
• Current consolidation 3,746–3,750, coiling for Asia session move.
• Micro trend supports scalping longs if 3,748 holds as support.
• Downside scalp possible if 3,732 breaks & retests.
⸻
🎯 High Probability Scalping Entries (Asia Session)
(max 60 pips SL)
✅ Scalp Buy Setup
• Entry: Above 3,748 with retest confirmation.
• SL: 3,742 (-60 pips).
• TP Zones: 3,756 / 3,764.
• Reasoning: Break above intraday resistance aligns with bullish MACD & higher-timeframe trend.
✅ Scalp Sell Setup
• Entry: Below 3,732 with retest confirmation.
• SL: 3,738 (-60 pips).
• TP Zones: 3,722 / 3,710.
• Reasoning: Clean liquidity pocket below 3,732, bearish MACD cross on 5M supports momentum lower.
⸻
📌 Fibonacci Golden Zone Check
• Pullback from 3,791 high → 3,732 low shows golden zone at 3,748–3,755.
• Price is inside golden zone right now → high chance of reaction.
• This strengthens the importance of 3,748–3,751 breakout for bullish continuation.
⸻
⚠️ Key Asia Session Levels
• Bullish Breakout: 3,748 → target 3,756 / 3,764.
• Bearish Breakout: 3,732 → target 3,722 / 3,710.
• Intraday Pivot: 3,744–3,746 zone (control level).
⸻
✅ Summary:
For Asia, gold is coiling inside the golden zone. A break above 3,748–3,751 should open the path to 3,764, while a clean drop below 3,732 could accelerate toward 3,710. Both setups respect a 60-pip stop loss. Wait for break-and-retest confirmations on 5M & 15M before entering.

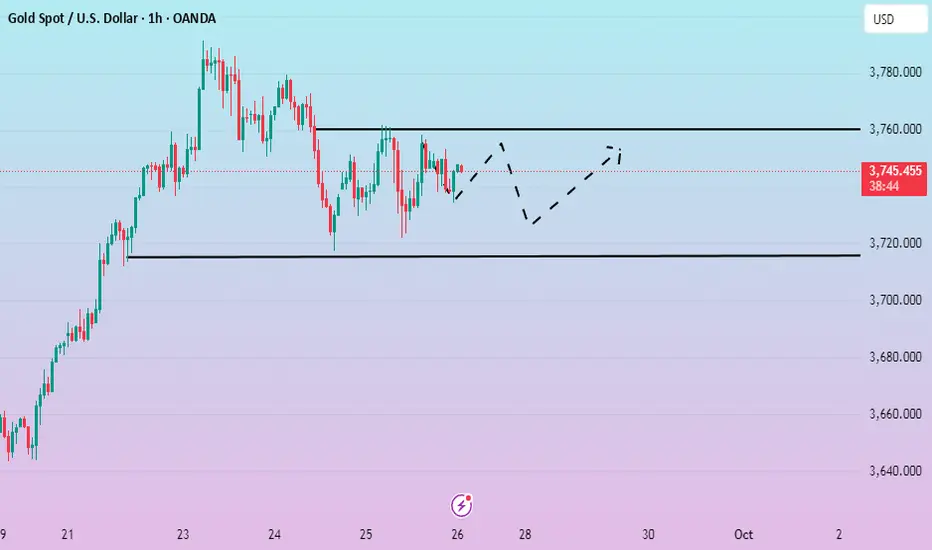
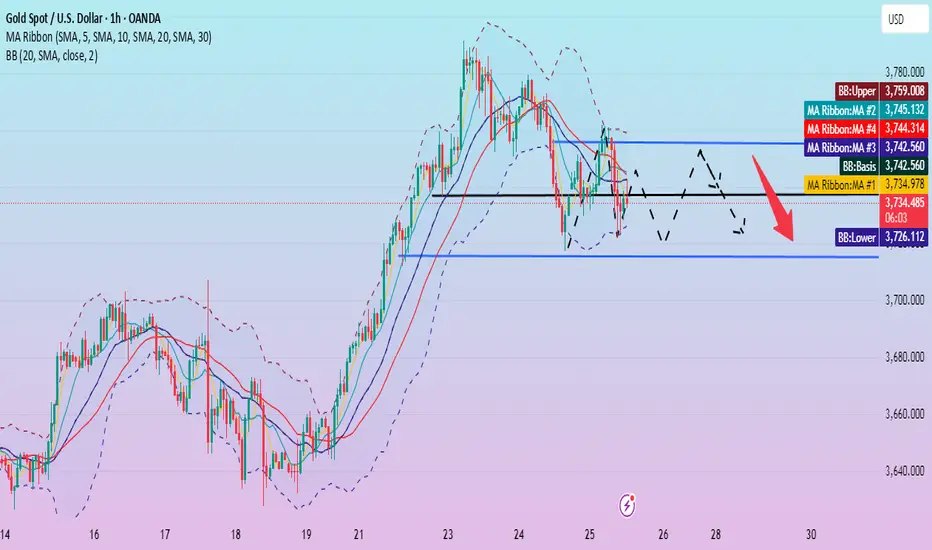
Is the correction over? Has the low been reached?This price correction began near the upper Bollinger Band at 3760, reaching a low near the lower Bollinger Band at 3722. It's currently rebounding slightly and trading near the middle Bollinger Band. The 1-hour MA20 moving average is converging with the middle Bollinger Band, indicating the possibility of further price adjustments in the short term.
Gold's 1-hour moving average is sloping downward, and the price is currently fluctuating around the low of 3735. Despite the bearish US initial jobless claims data, gold prices did not fall. Instead, they rebounded from around 3722 to 3745 before falling under pressure. As of now, it has not broken through the important support level of 3715. This level is a key focus in the short term.
From the 4-hour perspective, the effective support below is still maintained around 3715, which is consistent with the 1-hour line support. The upper pressure is focused around 3755. The short-term operation strategy of maintaining range fluctuations remains unchanged.
Trading strategy:
Go long around 3715, stop loss at 3705, profit range 3740-3750.
Short around 3755, stop loss at 3765, profit range 3725-3710.
The price fell as expected. Waiting for a rebound?Gold prices fell as expected. Quaid recommends maintaining the strategy and waiting for a rebound before continuing to short.
The 1-hour moving average has begun to turn downward, and gold bullish momentum is gradually weakening. US data is slightly bearish, and short-term fluctuations and declines will continue. Despite a slight rebound to 3745, downward pressure remains. Currently, the price is suppressed by the downward trend line, so shorting is still necessary for rebounds.
Gold bullish momentum is gradually weakening. Following the market trend and executing a short-selling strategy at the rebound high is market insight.
The short selling strategy near position 3755 remains unchanged, waiting for a rebound to continue short selling. If you want to trade aggressively, you can go long with a light position around 3715, and the profit point is above 3735.

9/25: Buy at Lows, Watch Resistance at 3758–3763Good morning everyone!
Yesterday, gold rebounded from support but failed to break resistance, then continued its decline to around 3720, completing the divergence correction on the 30M chart. This downside move was well captured.
Currently, price is in a rebound phase:
3752–3758 is the key resistance zone. A clean breakout and consolidation above would give the bulls stronger momentum.
3733–3726 is the key support area. If price retests without breaking lower and forms bullish candles (especially strong bullish candles without long upper wicks), the probability of another upward move increases.
If volume supports a breakout, watch the 3770–3780 resistance area, as it may trigger further upside.
📌 Trading Outlook:
Trend setups:
Long opportunities below 3710;
Short opportunities above 3780;
If price breaks above 3770 and retests near 3760 without losing 3752, this could present another long entry.
Range setups:
Consider swing trades within the 3766–3726 range.
⚠️ Reminder: If your account condition is not favorable, avoid unnecessary trades. Focus on higher-probability setups to steadily grow profits while controlling risk.

Gold Trade Set Up Sep 25 2025Last night we caught a buy from 15m demand securing 300 pips followed by a sell at 1m supply securing 100 pips then now another sell from 15m supply currently running 200 pips aiming for 350 pips at 15m demand
overall im bearish for now until it hits a 4h demand at 3658-3644 to continue its bullish move back to ATH

GOLD Bearish Breakout!
HI,Traders !
#GOLD made a bearish
Breakout of the key horizontal
Level of 3750.17 and the
Breakout is confirmed so
We are bearish biased and
We will be expecting a
Further bearish move down !
Comment and subscribe to help us grow !

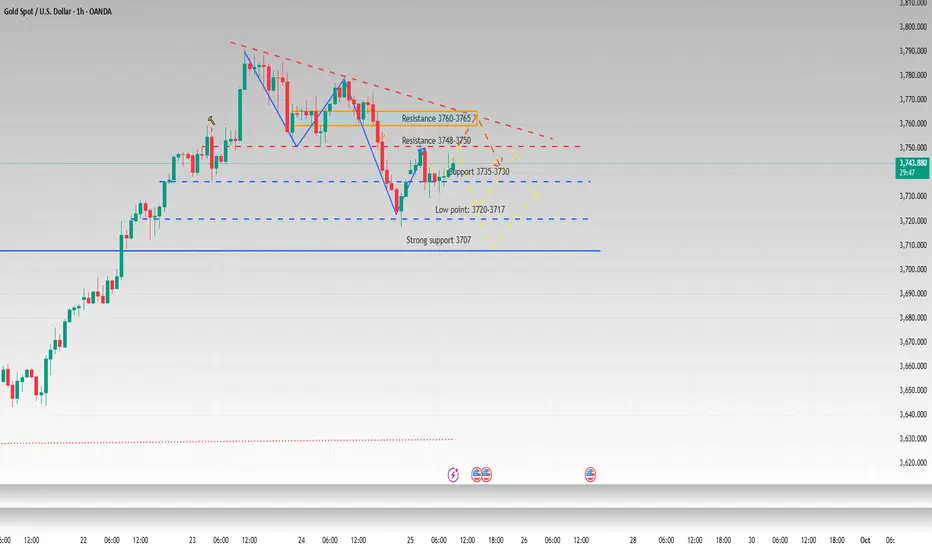
The trend has not changed, continue to shortAfter yesterday's high-level fluctuations, gold prices retreated significantly in the US market due to news, hitting a low near 3717.
Yesterday's daily gold price closed in the red, with the MA5 moving average near 3735. If today's daily closing price falls below the MA5 and reaches the MA10, bears will regain control of the market. Looking at the 4-hour Bollinger Bands, after breaking below the middle line, the price has fluctuated, briefly stabilizing near 3735. Currently, it is consolidating sideways, but if the European/US session breaks below 3735-3720, further declines to 3710-3700 are possible. The short-term downward trend is still under pressure and the market is in a weak state. Therefore, intraday gold trading is still mainly short selling, with long buying as an auxiliary.
The main pressure range above is 3750-3765. If the rebound touches the upper resistance range without breaking it, you can continue to short gold. The short-term support is at 3735-3720 below. If it falls back but does not break through, you can go long with a light position. Strong support focuses on the previous top and bottom conversion of 3710-3700.
Gold: Opportunities for both longs and shorts.Gold still pulled back downward overnight, which is the time window we reminded everyone to pay attention to yesterday. On the daily timeframe, the price has started to approach MA5. After a relatively large short-term gain, it is facing correction pressure. Today, focus on the support from MA10; there is also a need for a pullback on the weekly timeframe. However, note that there will still be an upward move after the correction—fundamentals have not changed, and the main trend remains intact.
After the strong one-way trend shifted to consolidation, short positions can also be traded; there are opportunities for both short-term long and short positions, but it is necessary to seize the right levels. Pay attention to shorting on rebounds near the 3765/3770 resistance, and look to go long near the 3710 support and the daily MA10 level. Currently, price volatility is relatively high, so be sure to control risks properly.
Buy 3730 - 3740 TP 3750 - 3760 - 3770 SL 3725
Sell 3760 - 3770 TP 3770 - 3775 SL 3758
Daily-updated accurate signals are at your disposal. If you run into any problems while trading, these signals serve as a reliable reference—don’t hesitate to use them! I truly hope they bring you significant assistance

Gold Roadmap| Short-termGold ( OANDA:XAUUSD ) has been surprising everyone in the last few weeks, making new All-Time Highs(ATHs) every day.
Let me start by saying that this is a short-term analysis on a 15-minute time frame .
Technical analysis generally works worse when assets are creating ATHs . One reason for this is that there is no past history .
Gold has started to correct after the formation of the last All-Time High(ATH=$3,791.55) .
In terms of Elliott Wave theory , given the bullish momentum of Gold , it seems that the main wave 3 has been completed, and we should wait for the main wave 4 . It seems that the main wave 4 can be completed with a Zigzag Correction(5-3-5) .
I expect Gold to continue its downward trend to the Support zone($3,738-$3,723) , and then if we find a trigger for a Long position , we can ride the bullish wave of Gold again .
Note: If the Resistance lines are broken, we can expect a new All-Time High.
Note: If the Support zone($3,738-$3,723) is broken, we can expect a deeper correction.
Please respect each other's ideas and express them politely if you agree or disagree.
Gold Analyze (XAUUSD), 15-minute time frame.
Be sure to follow the updated ideas.
Do not forget to put a Stop loss for your positions (For every position you want to open).
Please follow your strategy; this is just my idea, and I will gladly see your ideas in this post.
Please do not forget the ✅ ' like ' ✅ button 🙏😊 & Share it with your friends; thanks, and Trade safe.

ANFIBO | XAUUSD - A psychological zone $3800 ? [09.25.2025]Hi guys! Anfibo's here!
Overall Picture Today:
OANDA:XAUUSD is currently maintaining stability within the H4 bullish channel, reflecting the sustainability of the prevailing uptrend. Although no major breakout has occurred in recent sessions, the technical structure indicates that buyers still hold the advantage. However, the market is showing signs of stalling at a key resistance zone, so short-term trading plans should focus on resistance and support levels to optimize profits.
> SUPPORT KEY LEVELS: 3748 - 3733 - 3703
> RESISTANCE KEY LEVELS: 3768 - 3777- 3788 - 3799
Here's my Trading Plan today:
>>> SELL SCALP:
ENTRY: 3770 - 3765
SL: 3780
TP: 3720 - 3705
>>> BUY ZONE:
ENTRY: 3700 - 3705
SL: 3695
TP: 3760 - 3800
Always set stop-loss and good money management for success!
GOODLUCK GUYS!!!
