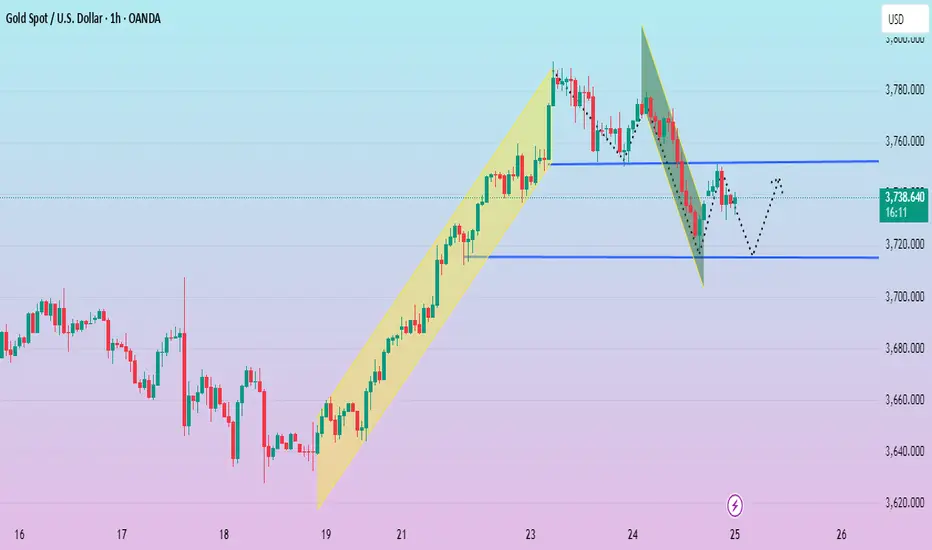
Gold Roadmap| Short-termGold ( OANDA:XAUUSD ) has been surprising everyone in the last few weeks, making new All-Time Highs(ATHs) every day.
Let me start by saying that this is a short-term analysis on a 15-minute time frame .
Technical analysis generally works worse when assets are creating ATHs . One reason for this is that there is no past history .
Gold has started to correct after the formation of the last All-Time High(ATH=$3,791.55) .
In terms of Elliott Wave theory , given the bullish momentum of Gold , it seems that the main wave 3 has been completed, and we should wait for the main wave 4 . It seems that the main wave 4 can be completed with a Zigzag Correction(5-3-5) .
I expect Gold to continue its downward trend to the Support zone($3,738-$3,723) , and then if we find a trigger for a Long position , we can ride the bullish wave of Gold again .
Note: If the Resistance lines are broken, we can expect a new All-Time High.
Note: If the Support zone($3,738-$3,723) is broken, we can expect a deeper correction.
Please respect each other's ideas and express them politely if you agree or disagree.
Gold Analyze (XAUUSD), 15-minute time frame.
Be sure to follow the updated ideas.
Do not forget to put a Stop loss for your positions (For every position you want to open).
Please follow your strategy; this is just my idea, and I will gladly see your ideas in this post.
Please do not forget the ✅ ' like ' ✅ button 🙏😊 & Share it with your friends; thanks, and Trade safe.
Xauusdsignal

ANFIBO | XAUUSD - A psychological zone $3800 ? [09.25.2025]Hi guys! Anfibo's here!
Overall Picture Today:
OANDA:XAUUSD is currently maintaining stability within the H4 bullish channel, reflecting the sustainability of the prevailing uptrend. Although no major breakout has occurred in recent sessions, the technical structure indicates that buyers still hold the advantage. However, the market is showing signs of stalling at a key resistance zone, so short-term trading plans should focus on resistance and support levels to optimize profits.
> SUPPORT KEY LEVELS: 3748 - 3733 - 3703
> RESISTANCE KEY LEVELS: 3768 - 3777- 3788 - 3799
Here's my Trading Plan today:
>>> SELL SCALP:
ENTRY: 3770 - 3765
SL: 3780
TP: 3720 - 3705
>>> BUY ZONE:
ENTRY: 3700 - 3705
SL: 3695
TP: 3760 - 3800
Always set stop-loss and good money management for success!
GOODLUCK GUYS!!!

A weak rebound? Bearish sentiment persists.Gold saw a correction in the market on Wednesday, starting to decline after rebounding from the high of around 3778 in the European session and continuing into the U.S. session. The lowest point was around 3717, a drop of about 60 US dollars, which was also a heavy blow to the bulls in the recent continuous market.
In a pattern of significant gains, without a significant correction, upward momentum will eventually falter. The previous day's high and Wednesday's early Asian session levels also act as key resistance points for bulls. After hitting 3717 in the US market, prices are currently rebounding.
Considering the previous gains, the current pullback is not significant. Key resistance is currently around 3755, a key short-term watershed. In the short term, try to short at this position and wait for the second pullback correction. Quaid recommends maintaining short positions near 3755. If there is a significant upward movement in the European session, consider adjusting positions before the US market opens.
Trading strategy:
Short around 3755, stop loss at 3765, profit range 3730-3720-3700.

XAUUSD Analysis: Precarious Levels, Here's My Trade Plan📊 Looking at Gold (XAUUSD) on the 4-hour timeframe, price is sitting at a precarious level. Recently, we’ve seen a bearish break of structure, but some bullish momentum is beginning to show 📈.
🔎 That said, there’s still no confirmation of a bullish market structure break just yet. I’ll be watching two possible scenarios:
1️⃣ If price breaks the current high, then retests and fails, this could set up a potential long entry 🚀.
2️⃣ If price instead breaks the current low, then retests and fails, that would signal a possible short opportunity 📉.
⚠️ Disclaimer: This analysis is for educational purposes only and not financial advice. Always trade responsibly and manage your risk carefully.

Gold: Correction Near 3700, Bulls Preparing for Another RunAfter printing a new ATH near 3800, Gold started a correction that pushed price as low as 3717.
The decline from the highs is corrective in nature, not impulsive, which keeps the broader bullish structure intact.
The key question now: has Gold finished its pullback, or will we see one more leg lower before the uptrend resumes?
Why I favor upside continuation:
• The 3700 zone stands out as a strong support area where buyers are expected to defend.
• Momentum indicators show loss of bearish pressure, consistent with a corrective move.
• The broader trend remains strongly bullish, with no structural break to the downside.
If 3700 holds, a reversal from here could easily re-expose the 3800 zone and potentially new highs beyond it.
Trading Plan:
My strategy is to buy dips into support, especially around 3700, aiming for a continuation higher. Risk management is crucial to such elevated prices, but the bullish bias dominates as long as 3700 remains defended.

Gold "Cools Down": A Sign of a Coming Downturn?Gold "Cools Down": A Sign of a Coming Downturn? 📉🤔
Hello, investors!
Gold saw a notable correction on September 24, closing at $3,762.73/oz after reaching a historic high of $3,790.82/oz just one day earlier. Gold futures also dropped 0.5% to $3,795.80/oz. Is this a sign of a deeper correction or just a short-term profit-taking before key news?
Fundamental Analysis: Market "Holds Its Breath" Before the PCE Inflation Report
Yesterday's drop in gold seems to have little to do with the released U.S. economic data, as the USD index only had a slight rebound and housing data wasn't strong enough to cause such a major move. Instead, the most likely reasons are:
Cautious Profit-Taking: Investors are taking profits after a rapid run-up, aiming to mitigate risk before the upcoming PCE inflation report on September 26.
Fed Expectations: Despite short-term volatility, the market holds firm on its expectation that the Fed will cut rates in October and December with a high probability (94% and 77%). A low-rate environment and geopolitical concerns remain the core drivers supporting gold's price in the long term.
Technical Analysis: "Sell" or "Wait to Buy"?
Gold had a significant correction from the $3,770 area, indicating that a large number of profit-taking sell orders were triggered. However, the downtrend has paused and is now looking for a new balance point.
Outlook: With the current cautious sentiment, there's a chance gold may see further selling pressure in the short term. However, any deeper drop would be an excellent opportunity to buy back at a better price, as the long-term bullish momentum is still intact.
Suggested Trading Strategy (Strict Risk Management):
Sell Zone: Zone $3766 - $3768, SL $3776
Buy Zone: Zone $3702 - $3700, SL $3692
The market is highly sensitive. Do you think this correction is a buying opportunity or a time to step back? Share your thoughts! 👇
#Gold #XAUUSD #Fed #GoldAnalysis #TradingView #InterestRates #Inflation #PCE #USD

25/9/68 : XAUUSD ( Europe / London Session )Using it from Europe Session until 7.00PM , I'll new analysis and update at 8.00PM
Resistance
3759-3764
3749-3754
3743
Support
3733
3722-3728
3712-3717

Gold Record Highs Under the Lens of ATAI VPA & VPRCGold Analysis Report
In recent days, as gold has reached new historical highs, two analytical tools have been used to assess the market conditions:
- ATAI Volume analysis with price action V 1.03
- ATAI Volume Pressure Analyzer (VPA)
It is important to emphasize that the gold market is heavily influenced by global economic and political events, and precise volume data is not publicly available. The only volume data considered here comes from OANDA. For this evaluation, a 70-day period has been chosen to study the broader behavioral and volume pattern of gold over the past two months.
Bull Trap Risk Detection (ATAI Volume analysis with price action V 1.03)
In this indicator, Bull Trap detection is based on the interaction of price behavior and order-flow volume. The logic is as follows:
1. Bull Sweep (False Breakout with Long Wick)
- If price exceeds the recent high (`high_level`) but closes back below it, and the upper wick of the candle makes up a sufficiently large fraction of the total range, then a Bull Sweep is detected.
- Formula:
upper_wick_ratio = (high - max(open, close)) / (high - low)
Condition: upper_wick_ratio >= trap_wick_threshold (e.g., 0.6)
2. Bull Break
- If the close is above the breakout level without a long wick, it is treated as a Bull Break.
3. Mismatch Condition
- If the candle is bullish (close > open) but delta ≤ 0 or seller ratio > 50%, then there is a mismatch between price action and order flow.
- Formula (simplified):
mismatchBull = (close > open) and (delta <= 0 or seller_ratio > 0.5)
4. Dominance Inversion
- If buyer volume ranks highest in the lookback window, but cumulative seller volume is greater than buyer volume while the candle is bullish, a dominance inversion occurs.
- Condition:
domInvBull = (rank_buy == 1) and (sum_sell > sum_buy) and (close > open)
5. Low Volume Breakout
- If a bullish breakout occurs with total volume less than the average total volume, then the breakout is flagged as low-volume.
- Condition:
lowVolBull = isBullBreak and (TF_tot < avg_tot)
The module assigns scores to these conditions:
- Sweep: +2
- Break: +1
- Mismatch: +2
- Dominance Inversion: +2
- Low-volume Break: +1
If total score ≥ trap_score_risk (default = 3), then a Bull Trap Risk is flagged. If, within `trap_confirm_bars`, price reverses and closes back below the breakout level, then Bull Trap Risk Confirmed is displayed.
Complementary View (ATAI Volume Pressure Analyzer – VPA)
The VPA indicator, with its left (C→B) and right (B→A) wings and offset capability, allows a parallel evaluation of flow balance. In the current gold chart, the right wing (B→A) reflects weakness on the buyers' side, reinforcing the Bull Trap risk detected by the previous indicator. This alignment strengthens the probability of a bearish scenario.
However, the extent of any downward path will depend on the pivotal price levels where the largest buy and sell volumes were registered over the past 70 days. These are represented by points B1 and S1, clustered around the 3409 USD level.
Notes
- On lower timeframes, accuracy in buy/sell volume calculation depends on the data window. Here, a 1-minute timeframe was selected, which provides ~74 days of buy/sell flow data.
- Gold remains highly sensitive to political and economic news globally.
- This analysis is based solely on mathematical calculations and volume/behavioral pattern recognition. It must not be interpreted as investment advice of any kind.

Daily Plan: What’s Next After the All-Time High Correction?📊 Market Context
Gold is struggling to recover from yesterday’s pullback after hitting a record high at 3791 USD/oz. In the Asian session on Thursday, price action remains cautious as traders await U.S. mid-tier data and further speeches from Fed officials for fresh momentum. While the long-term trend remains bullish, the current pause highlights how sensitive gold is to short-term liquidity sweeps and macro catalysts.
🔎 Technical Analysis (H1/H4)
ATH zone sits at 3791, with sellers reacting strongly from that level.
Price is currently trading below the downtrend reaction zone 3755–3757, showing near-term weakness.
Buy-side liquidity remains intact at 3712 and deeper at 3688–3686 (CP + OBS Buy Zone).
Sell-side liquidity zone identified at 3775–3777, likely to attract reactions if retested.
Larger liquidity magnet lies at 3824–3830, but only if bulls regain momentum above 3777.
🔑 Key Levels
Resistance / Sell Zones: 3775–3777 - 3791 - 3824–3830
Support / Buy Zones: 3712 - 3688–3686
📈 Scenarios & Trading Plan
✅ BUY ZONE (Main Setup): 3688–3686
SL: 3680
TP: 3696 - 3700 - 3705 - 3710 - 3720 - 3730 - …
✅ SELL ZONE (Liquidity Reaction): 3775–3777
SL: 3782
TP: 3770 - 3765 - 3760 - 3750 - 3740 - 3730 - …
⚠️ Risk Management Notes
Stay alert for false breakouts around 3775–3777, as price may sweep liquidity before reversing.
Avoid chasing entries mid-range; wait for price action confirmation in the buy/sell zones.
U.S. data and Fed commentary could trigger volatility spikes — adjust risk accordingly.
✅ Summary
Gold is consolidating after its record high at 3791, with traders waiting for new catalysts. The plan today: buy dips at 3688–3686, targeting a recovery towards 3720–3730, while looking for short-term sells at 3775–3777 if rejection occurs. A break above 3777 would re-open the path towards 3824–3830.
📢 Follow MMFLOW TRADING on TradingView for real-time liquidity setups and BIGWIN strategies as gold approaches its next critical levels.

Gold prices are correcting and entering a period of volatility.Gold prices rebounded slightly after a sharp drop on Wednesday and are currently fluctuating slightly.
From a news perspective, speculation about the continued effectiveness of the Federal Reserve's rate cuts and the entry of global central banks into an era of monetary easing have led to a depreciation of the US dollar, while non-US currencies have temporarily appreciated due to the depreciation of the US dollar. Excessive money supply will also lead to global currency depreciation.
Gold prices have continued to fluctuate at high levels, testing support at 3750 and 3715. However, they are still some distance from a top-bottom reversal. However, the upward rebound in early Asian trading coincided with a new top-bottom reversal, with resistance concentrated around $3750.
There are currently two positions that need attention, the pressure position of 3750 and the support position of 3710. If either direction is broken within this range, the trend will continue. Short-term volatility is a normal trend, and we should accept this periodic correction.
On Thursday, Quaid recommends a light short position at 3750, with a move to long positions appropriate if the price touches 3710-3715. Focus on a breakout of the 3750-3710 range.
Gold Price Forecast – Long Setup (XAU/USD)📊 Technical Structure
Gold price retraced from the 3777–3785 resistance zone and is currently consolidating during Asia Session. The chart indicates a solid support base around 3714–3723, while resistance is capped near 3777–3785. As long as price holds above support, the bullish bias remains intact, with potential to retest upper resistance.
🎯 Trade Setup
Entry (Buy): 3723
Stop Loss: 3712
Take Profit: 3785
Risk/Reward (R:R): 1 : 5.62
🌍 Macro Background
Gold holds firm near $3,750 in early Asian trading, supported by expectations of further Fed rate cuts and elevated geopolitical risks. The Fed has already cut rates by 25bps in September, bringing the Federal Funds Rate to 4.00%–4.25%, with projections showing two more cuts this year and one in 2026. Lower interest rates reduce the opportunity cost of holding non-yielding assets like gold, boosting demand.
Meanwhile, heightened geopolitical tensions — with NATO warning Russia over repeated airspace violations — continue to fuel safe-haven flows. However, Fed Chair Powell’s cautious comments about balancing labour market weakness with inflation risks may limit the upside momentum in the short term. Despite this, the medium-term structure still favours the bulls.
🔑 Key Technical Levels
Resistance (R): 3777 / 3785 / 3790
Support (S): 3723 / 3714
📝 Trade Summary
Gold remains supported by rate cut expectations and safe-haven demand. A buy setup near 3723 with stops below 3712 and target at 3785 offers a favourable risk/reward profile. Sustained momentum above 3785 could open the path towards the 3800 psychological level.
⚠️ Disclaimer
This analysis is for reference only and does not constitute trading advice. Trading involves significant risk, and proper risk management is essential.

Gold is under pressure. Is a correction underway?Gold is fluctuating at a high level on the daily chart, but short-term weakness is evident.
On the 4-hour chart, prices have fallen below the range and are currently under pressure near 3750. The candlestick chart continues to trade below the short-term moving average, indicating a generally volatile and weak pattern. The recent rebound has approached a key resistance zone, and a correction is likely after the rebound correction is complete.
Although a reversal has formed on the 1-hour chart, the price has stagnated near the pressure band, and the MACD technical indicator has shown a divergence signal. The price is gradually approaching the lower track of the Bollinger band, indicating that the short-term momentum is gradually weakening and there is a probability of turning to adjustment.
From a comprehensive technical perspective, gold faces downside risks in the short term. The strength of the correction and the performance of key support levels are key. Focus on the resistance level of 3750 on the upside and the support level of 3715 on the downside.
Trading Strategy:
Short around 3755, stop loss at 3765, profit at 3730-3720-3710.
Long around 3710, stop loss at 3700, profit at 3740 or above.

Quick Gold Long: Playing the Rebound GameGold has now fallen below the 3755 area, disconfirming the ascending triangle formation in the short term. The price has continued to fall below the downward channel support around 37740, signaling a short-term shift from strength to weakness. However, since gold hasn't shown clear signs of a peak, and the decline hasn't been a cliff-like drop, but rather a volatile downward pattern, the current technical pullback remains within normal limits and hasn't reached the level of a reversal. Therefore, gold still has the potential to rebound after this pullback.
Gold has retreated to the 3730-3725 area. While the decline hasn't completely stopped, the decline has certainly slowed. Furthermore, this area offers some technical support. Gold may rebound in the short term after fluctuating within this area, potentially reaching the 3740-3750 range.
Thus, for short-term trading, we can initially consider going long on gold in the 3730-3725 area, with a short-term rebound target of 3740-3750.

Prices fell. Has a low been reached?The daily gold chart suggests a continued bullish trend. Consecutive breakouts confirm continued upward movement. The MACD indicator remains within overbought territory, indicating a modest rise and not signaling a lack of upward momentum.
In the short term, the 4-hour chart also suggests an upward bias for gold. Technical indicators are extending gains within positive territory, with prices retreating to the middle Bollinger Band and now overlapping the 20-day moving average. The MACD indicator has formed a golden cross and is trending downward. Gold remains above the 20-day moving average. While the longer-term moving average maintains an upward trend, it remains well below the 20-day moving average. Most indicators suggest a easing of bullish momentum.
Prices are currently retreating. For stable trading, it is recommended to remain cautious and wait for a price low before entering a long position.
Of course, if aggressive trading is desired, long positions around 3725-3730 are still an option.

Go long on pullbacks; avoid chasing highsToday, as long as it breaks through 3780, I will stop going long and continue to monitor the market 📊. If it climbs to around 3800, we can attempt short positions and set the SL properly ⚠️
I reminded everyone multiple times yesterday to exit long positions at 3790 to avoid pullbacks 📉, and our stance remains unchanged today: we still favor looking for long opportunities during pullbacks 🐂—under no circumstances should we chase long positions at high levels ⚠️
Buy 3750 - 3755
TP 3760 - 3770 -3780
Sell 3798 - 3800
TP 3780 - 3770 - 3760
SL 3802
Accurate signals are updated every day 📈 If you encounter any problems during trading, these signals can serve as your reliable guide 🧭 Feel free to refer to them! I sincerely hope they'll be of great help to you 🌟 👇

Gold continues to fluctuate. Will it hit a new high?Information Summary:
Federal Reserve Chairman Powell delivered his first public speech since the September policy meeting. He stated that the Fed faces a challenging situation, with the risk of faster-than-expected inflation remaining. Job growth remains weak, raising questions about the health of the labor market.
Compared to the tone of the gold market last week, Powell's speech contained no significant content that could alter gold's upward trajectory. Geopolitical developments also provided support for gold prices. Expectations of rate cuts, concerns about the Fed's independence, and geopolitical developments all contributed to gold's strength.
Market Analysis:
Overall, gold's upward trend remains unchanged. After a slight pullback to 3750 on Wednesday, prices rebounded around 3780 before falling under pressure. In the short term, as long as gold does not fall below this week's 3735 starting point, the 3800 high remains a possibility. The upward trend remains intact, and long positions remain the main driver.
Looking at the 1-hour chart, the price retreated after encountering pressure at 3780, continuing to fluctuate slightly. Long positions are still possible around 3750 in the US market. If the US market continues to fluctuate, the 3800 mark may not be far behind.
Trading strategy:
Long positions at 3755-3750, stop loss at 3745, profit range 3780-3800.

Gold Trade Set Up Sep 24 2025Price is still making HL but playing within a range so i will want to see either 1h demand tapped, respected followed by 5m bullish structure to look for buys higher or a test of 15m supply to look for 5m bearish structure for sells.
But if either of the demand or supply get ran through/closed above or below i will look for a continuation of that direction
www.tradingview.com

Ascending Triangle Hints at One More Push to 3800?Currently, gold is encountering resistance around 3790-3800, and the bullish momentum has slightly weakened, but the overall pattern is still bullish. Moreover, judging from the two recent pullbacks, although the bears were given the opportunity to escape from the predicament, they were supported near 3750 and rebounded many times. The strong buying support below greatly limited the retracement space.
Gold has formed an ascending triangle structure in the short term. If this structure is valid, then gold as a whole may still hit 3800, or even continue the upward trend to the 3820-3830 area, which is also the upward limit area I mentioned earlier; but this condition must be established under the premise that gold cannot fall below the 3760-3750 area during the short-term retracement.
Therefore, it is clear that the short-term structural support of gold is located in the 3760-3750 area, and the further strong support below is located in the area around 3730. At present, gold is in the ascending triangle structural resistance area of 3775-3785, so there is still a chance of a pullback in the short term.
Therefore, for short-term trading:
1. For the time being, consider shorting gold in the 3775-3785 area, with a retracement target of 3765-3755.
2. Once gold retraces to the 3765-3755 area, consider going long on gold based on market fluctuations and structural support.
ElDoradoFx PREMIUM 2.0 – GOLD FORECAST (24/09/2025, London SessiGold is trading around 3,764–3,766, pulling back from yesterday’s high at 3,791. Momentum has slowed, with intraday charts showing corrective pressure, but the higher timeframe trend remains bullish.
⸻
🔍 Technical Outlook
Daily (D1):
• Still bullish, holding above 21 EMA (3,731) and 50 EMA (3,665).
• Price rejected at 3,791 resistance, forming a short-term top.
• As long as 3,731 holds, structure favors higher continuation.
1H Chart:
• Range developing between 3,791 high resistance and 3,750 intraday support.
• Price retesting dynamic trendline support near 3,760–3,756.
• MACD still negative, histogram showing bearish momentum building.
• RSI ~40, confirming corrective bias.
15M Chart:
• Clear rejection at 3,779–3,782 zone, now acting as intraday resistance.
• Support forming around 3,756–3,750.
• Structure lower highs / lower lows → short-term bearish pressure.
• MACD bearish crossover aligned with momentum.
5M Chart:
• Price broke minor support at 3,766–3,763, now testing lower zone 3,759–3,756.
• MACD histogram negative, RSI oversold → possible bounce setup.
• Price approaching strong demand cluster at 3,752–3,750.
⸻
🟡 Fibonacci Golden Zone
Using swing low 3,741 to swing high 3,791:
• 38.2% Fib = 3,772
• 50% Fib = 3,766
• 61.8% Fib = 3,760
➡️ Golden zone = 3,772–3,760 → price is currently inside this zone, a potential high-probability area for reversal/buy scalps.
⸻
⚖ High-Probability Entries
Buy Setup (preferred if Fib zone holds):
• Entry: 3,766–3,760 (Fib support)
• SL: 3,754 (≈60 pips)
• TP: 3,775 → 3,782 → 3,791
Sell Setup (only on rejection at resistance):
• Entry: 3,779–3,782 rejection
• SL: 3,788 (≈60 pips)
• TP: 3,770 → 3,766 → 3,760
⸻
⚡ Scalping Signals (5M & 15M, ≤60 pips SL)
• Buy scalp: 3,763–3,760 → TP 3,770–3,775 (SL 3,754)
• Sell scalp: 3,779–3,782 → TP 3,770–3,766 (SL 3,788)
⸻
📅 Key Breakout Levels
• Bullish continuation: Break & hold above 3,791 → targets 3,800–3,808.
• Bearish retracement: Break & hold below 3,750 → exposes 3,741–3,731.
⸻
✅ Summary
Gold is currently consolidating inside the Fibonacci golden zone (3,772–3,760). This area is crucial for bulls to defend and attempt another push toward 3,782–3,791. If 3,760–3,754 breaks, expect deeper pullback toward 3,741–3,731. Scalpers can trade both sides of the range with tight stops, but the Fib zone remains the high-probability demand for buys.
— ElDoradoFx PREMIUM 2.0 Team

LETS GOO GOLD FLY 3830 SOON Gold Have A Super Sharp X Setup
Gold Buy Now Hold Till Physcology Level 3830
Support + RBS + Buy Trendline + Sell TL Breakout
Lets gooo
Good Luck Guys !

Warning: Risk of a Price Pullback?Gold continued its upward trend on Tuesday, achieving its sixth consecutive weekly gain and breaking through new highs. The core driver of this significant rally is growing dovish market expectations for further Federal Reserve easing before the end of the year. Although the September rate cut has been priced in by the market, most investors predict two more rate cuts in October and December, providing strong support for gold prices.
From a technical perspective, the daily chart shows that gold is extremely strong, and the MACD indicator confirms the short-term bullish trend, but the indicator has deviated seriously and entered the overbought area, suggesting that there is a greater risk of technical correction in the later period. Focus on the support provided by the MA5 moving average below; a break below could trigger a deeper correction.
Traditionally, caution is advised. Short positions can be taken at highs with a small position. Upper resistance is expected to be in the 3790-3800 range, while lower support lies in the 3750-3735 range.
Trading Strategy:
Short at 3775, add to positions upon a rebound to 3785-3790. Stop loss at 3800. Profit targets 3750-3740-3730.
DeGRAM | GOLD will correct from the $3800📊 Technical Analysis
● XAU/USD surged from the 3715 support, reaching the 3780–3800 resistance zone within a steep rising channel.
● Price is now overextended, with rejection likely near 3800, suggesting a short-term correction back toward 3750–3760.
💡 Fundamental Analysis
● Gold’s recent rally was fueled by safe-haven demand as Fed officials signaled caution on further rate hikes, but stronger U.S. yields still limit upside momentum.
✨ Summary
Gold faces resistance near 3800, with short-term downside risk toward 3750–3760 if rejection confirms.
-------------------
Share your opinion in the comments and support the idea with a like. Thanks for your support!

24/9/68 : XAUUSD ( Europe / London Session )Using it from Europe Session until 7.00PM , I'll new analysis and update at 8.00PM
Resistance
3789-3794
3779-3784
3774
Support
3763
3752-3757
3742-3747
