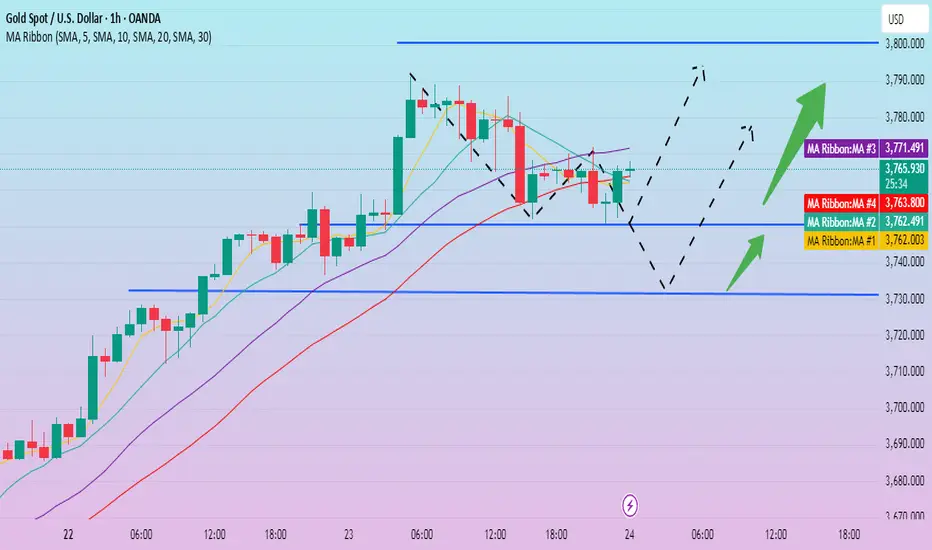
Continued volatility? What to do?Gold surged and then retreated on Tuesday, reaching a high near 3790 before retracing during the US trading session. While the gains were significant, even with the pullback, they haven't wiped out yesterday's gains. Therefore, the current trend isn't weakening, but rather remains strong. The slight pullback is merely accumulating upward momentum, not a top signal.
Gold rebounded after testing 3750 in early Asian trading. Short-term strength remains strong, and the pullback hasn't continued, leaving the overall trend strong. If prices stabilize above 3750 in the short term, there's a high probability of another surge. As long as they don't fall below 3730, long positions are still viable. Currently, there are no valid topping or bearish signals, nor are there any negative news.
Trading strategy:
Go long near 3750, add to your position at 3730, set a stop-loss at 3725, and target profit ranges between 3780-3790-3800.
Xauusdsignal
Gold Sets New Record: Rate Hopes Drive Price HigherHello, traders!
Gold surged to a record high of $3,726.19/oz on September 22, fueled by growing investor expectations for a clearer Fed rate-cutting path. Investors are now betting on two more rate cuts this year with very high probability.
The growth drivers have shifted from being primarily central bank and Asian demand to include strong buying from Western investors, as shown by increased holdings in gold ETFs. Upcoming speeches from Fed officials and the core PCE inflation data this week will be key in determining the market's next direction.
Technical Analysis & Strategy
Gold is in a strong uptrend and is continuously setting new highs. While there was a minor correction, the bullish momentum remains intact. Shorting near resistance levels is highly risky.
Outlook: Continue to prioritize Buy positions if gold holds above $370x.
Resistance: $3785, $3794, $3804
Support: $3774, $3764, $3754
Suggested Trading Strategy:
Buy Scalp: Zone $3765 - $3763, SL $3759
Buy Zone: Zone $3754 - $3752, SL $3744
Sell Zone: Zone $3800 - $3802, SL $3810
The market is highly volatile. Do you think gold can hit the $3,800 mark this week? Share your thoughts! 👇
#Gold #XAUUSD #Fed #GoldAnalysis #TradingView #InterestRates #Inflation #ATH

Gold rebound weak? A sharp correction?Information Summary:
NATO issued a strong warning regarding Russia's violation of Estonian airspace, heightening uncertainty in international relations. Gold, as a non-sovereign, default-free safe-haven asset, attracted significant safe-haven inflows.
US President Trump's statement, stating that Ukraine is expected to retake its former territory with NATO support, and his tough rhetoric regarding the Russia-Ukraine situation further rattled market sentiment. Meanwhile, during the UN General Assembly, he met with Muslim leaders from various countries to discuss the Gaza conflict and other issues, and these developments also caused significant fluctuations in gold prices.
Market Analysis:
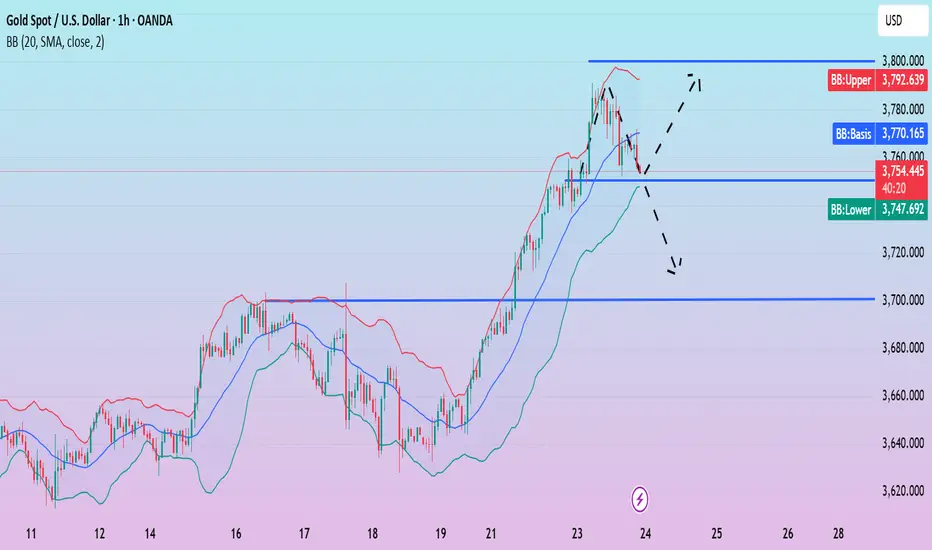
Gold rose and then retreated on Tuesday, closing with a bullish candlestick pattern with an upper shadow. This candlestick pattern reveals two signals. From a bullish perspective, the real body of the bullish candlestick indicates that the overall market still has upward momentum, and the rise and fall have not completely reversed the short-term strong trend. However, the trend indicates resistance near 3790. Selling pressure has significantly increased near this key resistance level, and a brief tussle between bulls and bears has begun in this area.
Quaid believes that the short-term focus should be on market corrections. The current price correction is about to touch the lower track of the Bollinger band. If it stabilizes above 3750 in the short term, the price is expected to hit 3800 again. If the rebound in this correction is weak, the price will most likely retreat and touch 3700.
9/24: Sell at Highs, Watch Resistance at 3769–3773Good morning everyone!
Gold has pulled back into the 3760–3748 zone. Previous short positions delivered solid profits, while the short-term long strategy also yielded small gains. At the moment, price is hovering around a key support area and requires close observation:
If gold holds above 3770, it could still retest 3790–3800.
If support breaks, the next downside targets are 3742–3733/3721.
📌 Trading Outlook:
Bias remains toward selling at higher levels. For conservative traders, patience may offer better risk-reward setups:
Look for short opportunities around 3790 or above 3800.
Watch the 3740–3730 area for potential long entries.
⚠️ If considering longs near the current zone, monitor resistance at 3772 closely. Failure to break above should be a signal to exit quickly.
Remember: the market is always full of opportunities. Stay patient, disciplined, and focus on setups with stronger probability.

XAU/USD: Demand Zone Long Setup After Resistance Rejection ?Technical Analysis Breakdown:
🔹 1. Price Structure:
Strong bullish breakout occurred around 09:00 with a wide-bodied green candle, indicating high buying interest.
Price consolidated in a tight range under resistance (~3,782.996 – 3,784.000), suggesting accumulation or distribution.
Followed by a strong bearish rejection (2 large red candles), confirming a liquidity sweep and rejection from resistance.
🔹 2. Supply & Demand Zones:
Demand Zone: Marked between 3,743.367 and 3,748.000 (highlighted in light blue).
Price previously reacted here and then rallied aggressively—indicating strong buying interest.
Entry Position: Placed slightly above the demand zone, betting on a bounce.
Stop Loss: Below the demand zone (~3,737.837) – to avoid deeper liquidity sweeps.
Take Profit: Near previous resistance/consolidation (~3,759.914).
🔹 3. Candlestick Behavior:
The recent bearish momentum shows a liquidity grab or stop hunt below minor lows before touching the demand zone.
The current candle shows a potential reversal wick, indicating possible buying pressure returning.

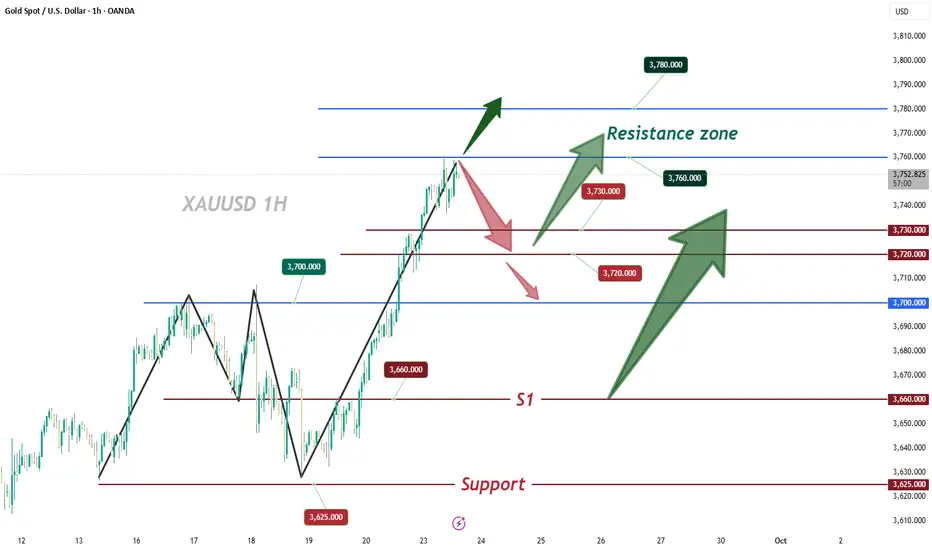
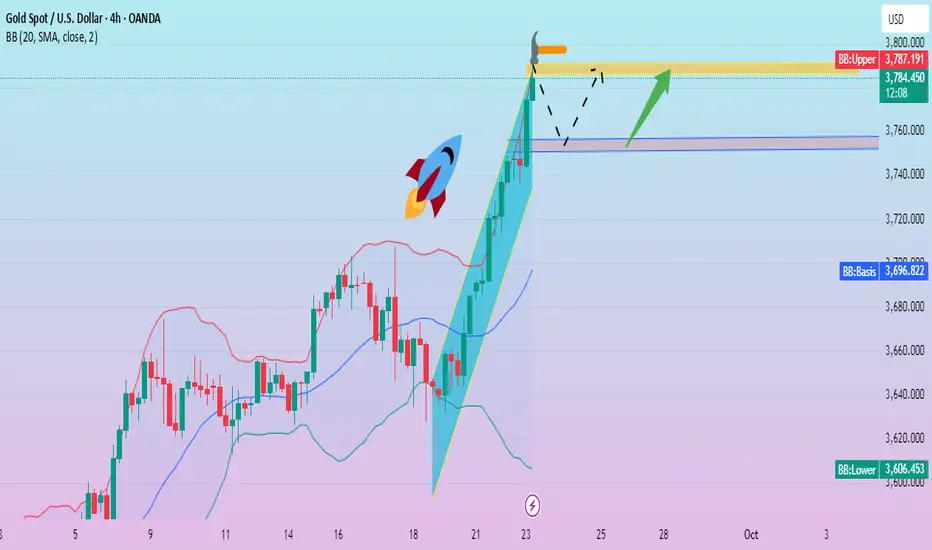
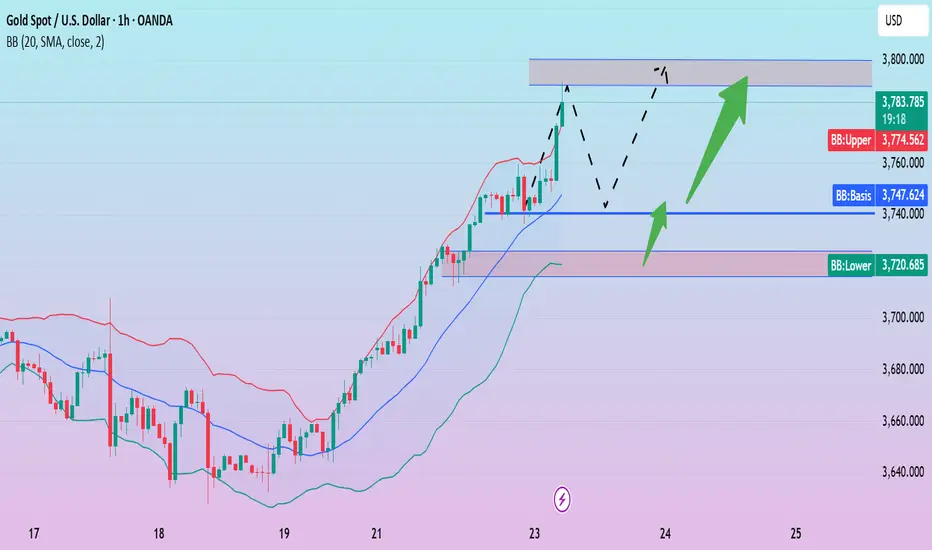
Gold to push for 3800 this weekCurrently, gold has been rising steadily since Monday’s opening 📅, repeatedly setting new all-time highs at any moment 🆙—and it may even make a direct attempt to break through the 3800 level this week. However, we must stay vigilant about potential pullbacks ⚠️ to avoid account losses during such corrections.
Notably, the 3750 resistance level—one that remained unbroken yesterday—was breached with remarkable ease today 📈. Looking ahead, a pullback in gold still demands our attention ⚠️: the probability of it surging directly to around 3780 right now is relatively low. Instead, it is far more likely to pull back further to the 3720-3730 range first 📉, after which it will resume its upward trajectory 🚀
Buy 3720 - 3730
TP 3740 - 3750 - 3760
Accurate signals are updated every day 📈 If you encounter any problems during trading, these signals can serve as your reliable guide 🧭 Feel free to refer to them! I sincerely hope they'll be of great help to you 🌟 👇
Gold is advancing robustlyLooking back at the gold 4H chart, the price is moving steadily higher with limited pullback room—bullish momentum is absolutely strong! Gold has already moved above the 3700 key level, with an intraday high touching 3780. The technical outlook has improved significantly: short-term resistance to the upside lies in the 3800 zone, while the 3730 level has now turned into a support level, followed by the 3700 level below. Gold’s short-term support is relatively solid.
A pullback in this bull market is a buying opportunity—simply continue to enter long positions on dips above 3730.
Buy 3750 - 3760
TP 3770 - 3780 - 3790
SL 3745
Daily-updated accurate signals are at your disposal. If you run into any problems while trading, these signals serve as a reliable reference—don’t hesitate to use them! I truly hope they bring you significant assistance

XAUUSD: Targeting $3600 By End Of The YearGold has successfully bridged the liquidity gap in the daily timeframe, indicating a bullish trend since then. We have an opportune moment to initiate a bullish position within our “drawn” area. However, it is imperative to verify the volume and price dynamics in a shorter timeframe. Upon witnessing robust confirmation, it would be optimal to take any position.
We extend our best wishes for successful trading. It is crucial to adhere to meticulous risk management practices during trading. It is important to note that this analysis does not guarantee price movements in accordance with the provided description.

#XAUUSD: Neutral View On Gold May Go Either Side Gold has rallied to $3700 making it all time high level. However, at this moment gold remain uncertain as it can go either way of the trend. Therefore we have two point of view on current time; firstly since heavily bought, we can see a nice correction taking price to almosr 3550 area which remain crucial. The problem with this approach is we need strong confirmation snd currently we do not have. Second view is that price may continue the bullish approach and may take price to a record high.
Team Setupsfx

ElDoradoFx PREMIUM 2.0 – GOLD ANALYSIS (23/09/2025 – Evening UpdGold is trading around 3,775–3,776, consolidating just below intraday resistance after hitting a session high of 3,791. Momentum is still bullish on higher timeframes, but intraday signals show indecision as price rotates between support and resistance zones.
⸻
🔍 Technical Outlook
Daily (D1):
• Trend remains bullish, holding well above the 21 EMA (3,722) and 50 EMA (3,652).
• Structure: Higher highs and higher lows intact.
• Resistance: 3,786–3,791 zone is key supply.
• Support: 3,752–3,745 intraday demand zone.
1H Chart:
• Price is consolidating under 3,786 resistance.
• EMA cluster at 3,768–3,760 acting as immediate support.
• MACD: Bullish histogram fading – showing slowing momentum.
• RSI hovering ~60, neutral but not overbought.
15M Chart:
• Price is ranging between 3,779–3,770.
• Support at 3,770–3,767 holding so far.
• Repeated rejection at 3,779–3,782 signals short-term supply.
• Structure: Sideways, waiting for breakout.
5M Chart:
• Price action chopping between 3,782 resistance and 3,770–3,767 support.
• MACD flatlining, RSI neutral – confirming range conditions.
⸻
🟡 Fibonacci Golden Zone
Using the latest swing low (3,741) to high (3,791):
• 38.2% Fib = 3,772
• 50% Fib = 3,766
• 61.8% Fib = 3,760
➡️ The golden zone is 3,772–3,760, a high-probability demand zone for bullish continuation if retested.
⸻
⚖ High-Probability Entries
Buy Setup (preferred while above 3,760):
• Entry: 3,772–3,760 (Fib zone)
• SL: 3,754 (≈60 pips from 3,760)
• TP: 3,782 → 3,791 → 3,800
Sell Setup (only if rejection holds at resistance):
• Entry: 3,786–3,791 rejection
• SL: 3,797 (≈60 pips from 3,791)
• TP: 3,772 → 3,766 → 3,760
⸻
⚡ Scalping Opportunities (M5 & M15 focus, ≤60 pips SL)
• Buy scalp: 3,767–3,760 → TP 3,775–3,780 (SL 3,754)
• Sell scalp: 3,786–3,791 → TP 3,775–3,770 (SL 3,797)
⸻
📅 Key Breakout Levels
• Bullish continuation: Break & hold above 3,791 → unlocks 3,800–3,808.
• Bearish retracement: Break & hold below 3,760 → exposes 3,752 → 3,741.
⸻
✅ Summary
Gold is consolidating below 3,791 resistance, with the Fib golden zone (3,772–3,760) acting as intraday demand. Bias remains bullish while above 3,760, but sellers may defend 3,786–3,791. Scalpers can trade between the Fib zone and resistance until a breakout defines the next leg.
— ElDoradoFx PREMIUM 2.0 Team

Gold remains strong. Latest analysis.Gold continued its upward trend, breaking all-time highs several times, reaching as high as 3790.97. It traded around 3780 in early US trading. Following the Federal Reserve's 25 basis point rate cut last week, market expectations of further easing this year, coupled with geopolitical uncertainty, have fueled demand for safe-haven and inflation hedging, pushing gold prices to explore a new equilibrium range.
The 1-hour chart shows that gold prices have recently been rallying around the middle Bollinger Band. Early in the Asian session on Tuesday, the price continued its upward trend, retreating slightly to touch the middle Bollinger Band before stabilizing and continuing its upward trend. It retreated in the European session, but remained stable near the middle Bollinger Band before rebounding to an Asian high of 3759.
Currently, the European session has broken through the highs strongly, and the US session is likely to continue its upward trend. A pullback near the 10-day moving average is expected, and above the middle band, the bullish trend remains. Considering the crossover points, the 3770-3760 area is a key focus. If it stabilizes, the bullish trend will continue, with the profit range focused on 3790-3800. A strong upward breakthrough could potentially reach the 3800 mark. Otherwise, a strong upward breakthrough will likely continue, and a volatile upward trend will likely persist.
Short-term trading strategy:
Go long around 3760-3770, stop loss at 3750, profit range 3790-3800.

How to accurately arrange long and short positions?Gold is currently standing firmly above the 3750 line, with a maximum impact of 3791, just one step away from the 3800 mark. The overall bullish momentum has not weakened. If gold can continue to stabilize above 3750, it means that the 3800 mark will most likely be tested. The short-term market is still in a strong bullish pattern. We are currently focusing on the 3760-3750 support zone. If this area can effectively stabilize, it will be an ideal entry point for short-term bulls and has a strong reference value. From the 4-hour cycle, the effective support below is maintained in the area around 3760-3750, while the upper pressure is at the 3800 mark, which is the key balance point between a strong breakthrough and a technical pullback. In terms of operating strategy, it is still recommended to maintain the idea of "low-long as the main and high-short as the auxiliary". Specifically, if the price falls back to 3750-3760 without breaking through, you can go long with a light position, and target around 3800 first; if the price touches the 3800 area, you can try to go short with a light position, but you must enter and exit quickly and strictly control the stop loss; in the middle position, you should wait and see, watch more and do less, to avoid repeated consumption of funds by range fluctuations. Overall, the current bullish trend of gold still dominates the market, but as the price gradually approaches the integer mark, market volatility may intensify. Short-term operations must be steady and cautious, control the rhythm, wait for key points to enter the market, and respond flexibly. This is the core idea at the current stage.
9/23: Focus on Shorts, Watch Support at 3712–3706Good morning everyone!
Gold extended its bullish momentum yesterday with a one-sided rally. After holding above 3680, price tested 3721 resistance, pulled back to 3712-3706 support without breaking, and then climbed further toward 3750.
📊 Technical Outlook:
30M chart shows bearish divergence, suggesting possible short-term pullback.
1H chart still supports the bullish structure, though momentum is slowing.
Daily close with a strong bullish candle confirms buyers remain in control, but profit-taking and psychological resistance near record highs could weigh on momentum.
📌 Trading Strategy:
Avoid chasing longs near 3750 and above; look for short opportunities in this zone.
Watch support at 3734-3728, with key zones at 3712-3706 / 3685. If support holds, consider long entries on pullbacks.

23/9/68 : XAUUSD ( US Session )Using it from US Session until 11.00AM , I'll new analysis and update at 12.00PM
Resistance
3815-3820
3805-3810
3795-3800
3790
Support
3778
3768-3783
3756-3762
3746-3751

Gold Trade Set Up Sep 23 2025Gold once again has push far above PDH in london session creating yet another ATH. So as long as price stays closed above the 15m swing low and makes HL/HH on the 5m i will look for buys from a 5m OB to take higher
www.tradingview.com

Gold breaks through. Watch for key support levels.Gold continues to strengthen this week, hitting new all-time highs. So far, it has reached around 3791 and is currently fluctuating at a high level.
Looking at the 4-hour chart, the Bollinger Bands continue to open upward, and gold will continue to run on the upper track of the Bollinger Bands in the short term. After a slight pullback, gold continues to strengthen. There may be periods of short-term volatility and pullbacks. A pullback will focus on the strong support at 3755. A small long position is recommended when the price retreats to this area. The profit range is 3775-3790.
XAUUSD 15M ProjectionXAUUSD 15M Projection
Trend will change from FED meeting.
retailer are holding there gold.
once selling will start nobody can sell there gold and drop like blood bath.
Thanks if you like content, follow me.

Gold is going crazy. Will it continue to break through?Gold hit a new all-time high near 3758 on Monday; on Tuesday, prices continued their relentless rise, currently reaching a high near 3791.
From a technical perspective, the Bollinger Bands have opened upward again, and the price is continuing to move within the upper Bollinger Bands, suggesting continued short-term gold gains. Gold is trading upwards, supported by the MA5 moving average. The trend is clear, with minimal room for correction. There's no strong resistance above. The 3780 resistance level I mentioned in the Asian session was strongly broken through in just five hours.
Short-term trading remains bullish, with support below the 1-hour line around 3735, and further retracement focusing on the 3725-3715 area. On the whole, the short-term operation strategy for gold is to mainly go long on pullbacks and short on rebounds. The short-term focus on the upper side is the 3790-3800 resistance, and the short-term focus on the lower side is the 3750-3740 support.
ANFIBO | XAUUSD - next ATH ??? [09.23.2025]Sorry guys, I'm very busy today so I can't share my views in detail. I will share my trading plan first, then update the details later ;)
Here's my OANDA:XAUUSD plan today:
>>> BUY ZONES:
ENTRY: 3715 - 3720
SL: 3710
TP: 3740 - 3760 - 3770 - 3800
>>> SELL ZONES:
ENTRY: 3800 - 3795
SL: 3805
TP: 3760 - 3730
GOODLUCK GUYS!!!

Liquidity Hunt & Bullish Continuation Setup | MMFLOW TRADING📊 Market Context
Gold continues to show impressive bullish momentum, supported by global safe-haven flows amid geopolitical risks and a softer USD backdrop. After breaking through multiple resistance zones, price action is now consolidating near 3760, preparing for the next liquidity sweep. The market narrative is clear: institutional flows and ETF demand are driving momentum, but sharp pullbacks remain possible as liquidity zones above and below get tested.
🔎 Technical Analysis (H1/H4/2H)
Price recently touched 3760, confirming bullish structure.
Short-term support: 3725, acting as CP retest zone.
Stronger support: 3689–3690, overlapping with OBS + FVG low zone.
Resistance targets: 3788 (first liquidity pool) and 3805–3830 (large liquidity area).
Structure remains bullish, but a pullback into demand zones before another leg higher is likely.
🔑 Key Levels
Resistance / Sell Zones: 3760 ➡️ 3788 ➡️ 3805–3830
Support / Buy Zones: 3725 ➡️ 3689–3690
📈 Scenarios & Trading Plan
✅ BUY ZONE 1 (Shallow Pullback): 3725
SL: 3716
TP: 3760 ➡️ 3788 ➡️ 3805 …
✅ BUY ZONE 2 (Deep Liquidity Retest): 3689–3690
SL: 3680
TP: 3725 ➡️ 3760 ➡️ 3788 ➡️ 3830 …
✅ SELL SCALP (Liquidity Trap): Around 3805, only if rejection patterns confirm
SL: 3810
TP: 3775 ➡️ 3760 ➡️ 3740 …
⚠️ Risk Management Notes
Expect liquidity sweeps both above 3788 and below 3725 – don’t chase price mid-range.
Pullbacks are opportunities; stay patient and wait for confirmations.
News-related spikes (Fed or geopolitical) may cause abnormal volatility.
✅ Summary
Gold remains in a clear bullish trend, with 3788–3805 as the next upside magnet. Plan: buy dips at 3725 and 3689–3690, while monitoring for short-term sell traps near 3788–3805. Patience and disciplined execution will be key as liquidity hunts unfold.
📢 Follow MMFLOW TRADING for real-time updates, liquidity-based strategies, and BIGWIN setups on gold!

23/9/68 : XAUUSD ( Europe / London Session )Using it from Europe Session until 7.00PM , I'll new analysis and update at 8.00PM
Resistance
3767-3772
3757-3762
3751
Support
3740
3729-3735
3719-3724

Gold fluctuated slightly. Waiting for an opportunity?Gold fluctuated upward on Monday, stabilized in the Asian session, and saw a sharp rise in the European and American sessions. The market on Monday continued the strong performance of last Friday, and gold performed strongly in the short term.
After recently breaking through the key resistance level of $3,703, gold broke through the previous high and set a historical high of $3,758. The $3,700 integer mark has changed from a resistance level to an important support level. The gold hourly moving average has formed a golden cross upward. The gold bulls are very strong upward. The gold highs are constantly being refreshed. The price pullback is an opportunity to go long.
From the 4-hour chart, the effective support below is maintained at around 3720-3725, and the key pressure above is maintained at 3770-3780. The resistance after breaking through will move up to the 3800 integer mark.
Trading strategy:
Go long around 3725, cover at 3715, stop loss at 3700, profit range 3750-3760-3780.

Gold remains strong. 3800?In Tuesday's Asian session, gold hit around 3758 before retreating and currently fluctuating around 3743. While gold continues to hit new highs, the bullish trend remains. Monday's analysis suggests that after breaking through the resistance level of 3745, the upward trend will reach 3760, a level it has successfully reached.
The current market environment is characterized by geopolitical instability, rising risk aversion for gold, and the impact of the Federal Reserve's interest rate cuts. Therefore, gold is unlikely to experience a significant decline in the short term. Therefore, based on the strength of the trend, it is expected to rise to a high of 3780 in the short term. Further upward movement will only reach the 3800 level.
From a technical perspective, the Bollinger Bands on both the daily and 4-hour charts show strong unilateral strength, with continued upward breakthroughs and minimal corrections. In short-term trading, observe the changes in small cycles. The support point below the hourly line is around 3735. If the adjustment is too strong, it can be seen around 3710 below. In the short term, it is recommended to go long when it falls back to the 3735-3710 range.
