Bullish Trend? Pullbacks as Opportunities?From the daily chart, gold has successfully reversed its previous weakness and firmly established itself above all major moving averages, demonstrating a clear bullish trend. Although gold prices may experience short-term high volatility, any pullbacks are expected to be limited.
Strong support has shifted to around 3700. The market is likely to maintain its upward momentum from this level until it breaks below. The primary upside target is 3745, and a break above this level will target the strong resistance area of 3760.
Gold prices continued to rise in the US market, with no signs of a pullback from the 3734 high. The 1-hour moving average remains bullish. Quaid believes that the current trading strategy remains to follow the market. The primary strategy is to wait for a pullback to around the 3715 support area to look for long opportunities. However, caution is advised regarding the current significant resistance level, as this level could potentially form a top and trigger a technical pullback.
Trading Recommendations:
Short at 3740-3745, stop loss at 3755. Profit range: 3720-3710-3700.
Go long on a pullback to 3710-3715, stop loss at 3700. Profit range: 3730-3750.
Xauusdsignal

The bullish trend remains strong; look for opportunities to buy Gold fluctuated upward today, reaching a new high driven by multiple factors. It was originally expected that gold would retreat to near the inflection point and then rise, but unfortunately the market did not give it an opportunity and the bears had no choice but to stop their losses. From a technical perspective, the gold price stabilized above the MA5 moving average, the hourly moving average spread out upward in a bullish arrangement, and the Bollinger Bands opened upward, indicating that the market bulls have completely dominated. Gold is currently retreating. The top and bottom conversion position below 3710-3700 is being watched in the NY market. If the support level is not broken after a pullback, we can consider going long on gold, with the target at 3730-3750.

Gold Trade Set Up Sep 22 2025www.tradingview.com
Price broke PDH and i created a new ATH so i am overall bullish. It has tested a 1h demand and is respecting it so i will be looking for internal bullish BOS with a retest to target previous highs

Gold Surges on Low Rates & Tensions: Is a New Record Coming?Hello, traders!
Gold started the new week on an impressive note, hitting $3,685 in early Monday trading. The main drivers are the market's continued reaction to the Fed's rate shock and escalating geopolitical events. So, how far will this rally go?
Fundamental Analysis: Why Is Gold Still Soaring?
Although the Fed cut interest rates by 0.25%—the first time in 2025—Chair Jerome Powell maintained a cautious stance, calling it a "risk management cut." This message initially worried the market, but in the long run, lower interest rates are a strong supporting factor for gold.
Lower Rates: They reduce the opportunity cost of holding gold, a non-yielding asset.
Geopolitical Tensions: Conflicts in Ukraine and the Middle East are escalating, boosting safe-haven demand. Ukrainian President Zelensky reported that Russia carried out a major drone and missile attack, reaffirming gold's role as a protective asset against risk.
Technical Analysis: Breaking Resistance, The Uptrend Continues
Gold had a powerful rally at the start of the week, successfully breaking the key resistance zone at $370x. The price is currently hovering around $3720 with a slight correction, but the uptrend remains intact.
Outlook: With the strong upward momentum, short-selling (sell) with a tight stop-loss is extremely risky. We will continue to prioritize long positions (buy) as long as gold holds above the $370x level.
Suggested Trading Strategy (Strict Risk Management):
BUY SCALP
Zone: $3413 - $3711
SL: $3407
TP: $3716 - $3721 - $3726 - $3731 - $3741
BUY ZONE
Zone: $3700 - $3798
SL: $3790
TP: $3708 - $3718 - $3728 - $3738 - $3758
SELL ZONE
Zone: $3734 - $3736
SL: $3744
TP: $3726 - $3716 - $3706 - $3796 - $3779
The market is showing unpredictable volatility. Can gold overcome all barriers and set new records? Share your opinion in the comments below! 👇
#Gold #XAUUSD #Fed #GoldAnalysis #TradingView #FinancialMarkets #TechnicalAnalysis #GoldTrading #USD #Geopolitics

"Bullish Breakout Potential for Gold (XAU/USD) Above Key ?Key Observations:
The price is currently rising and is reaching a key resistance level.
A potential breakout is shown above the resistance at approximately 3,723.
A blue support zone between 3,686 and 3,690 suggests that the price has recently bounced off this level, implying bullish momentum.
The target price shown in the chart (with the green box) is positioned around 3,730, indicating that the trader is expecting further upward movement.
The stop-loss is placed just below the support zone, around 3,672, which suggests that the trader is managing risk.

Gold XAUUSD: Overextension, Pullback, and Key Opportunities📊 Watching Gold (XAUUSD), we’ve seen price make an aggressive push higher, leaving the market looking overextended after such a strong run.
🔎 From here, I’m anticipating a retracement back toward equilibrium ⚖️. In the short term, this sets up the possibility of a counter-trend short opportunity.
📈 Longer-term, my focus remains bullish. I’ll be looking for price to retest key support zones and then confirm strength with a bullish break of market structure. That would offer a high-probability continuation entry 🚀.
⚠️ Disclaimer: This analysis is for educational purposes only and not financial advice. Always trade with proper risk management.

ANFIBO | XAUUSD hits new ATH today [09.22.2025]Hi guys! It's me, Anfibo. My latest plan brought good profit with 100 pips Sell entry 3690 - 3700 and 100 pips sell entry 3720. Today is the beginning of the week, and I will think Gold will move in a parallel sideways range as on the chart I drew.
XAUUSD Analysis – Start of the Week
The new week kicks off with gold OANDA:XAUUSD moving sideways after last week’s strong volatility. The market has yet to make a clear breakout, with most major players still observing and waiting for decisive signals from key U.S. economic data due this week. Therefore, the narrow trading range and sideways structure are currently the “playground” best suited for short-term scalp trades.
🔎 Technical Outlook:
> Key Resistance Levels: 3720, 3725, 3745, 3775
> Key Support Levels: 3670, 3660, 3650.
Here's my OANDA:XAUUSD trading plan today:
>>> SELL SCALP:
ENTRY: 3723 - 3728
SL: 3731
TP: 3700 - 3670
>>> BUY SCALP:
ENTRY: around 3670
SL: 3665
TP: 3720 - 3730 - 3745
The current gold market is better suited for scalping strategies – quick in, quick out around well-defined support and resistance zones.
3720 – 3730 remains a “golden zone” for short-term selling opportunities, while 3660 – 3650 serves as the key support block to keep an eye on.
Only if gold clearly breaks above 3775 or drops below 3650 should we consider shifting to a medium-term trend-following strategy.
Well, HAVE A BEAUTIFUL DAY! :)

What is the current global gold demand?Despite the record high price, the proportion of gold in total global financial assets is only about 2%. According to the World Gold Council, the amount of gold held by ETFs is still much lower than the peak in 2020.
This shows that there is still a lot of room for growth. The attraction of gold comes from its role as a "safe haven" in the context of rising inflation due to increasingly heavy government debt. The US alone has recorded an additional deficit of 2,000 billion USD this year, bringing the total public debt to over 37,000 billion USD.
Not only with USD, gold has also continuously reached peaks when calculated in Canadian dollars, British pounds, euros, Japanese yen and Australian dollars. Gold is currently trading above 5,000 USD/ounce compared to CAD.
The reason lies not only in global public debt, but also because many investors are beginning to worry that the US Federal Reserve (Fed) is losing its independence in monetary policy. Some experts believe that if the Fed cuts interest rates more aggressively in the coming years, especially when President Trump appoints more members to the council, gold will be strongly supported.

Fed Dovish Tone & Geopolitical Tensions Fuel Gold’s Rally🚀 XAUUSD – Daily Trading Plan: | MMFLOW TRADING
📊 Market Context
Gold continues to gain strong support from the Fed’s dovish signals and escalating geopolitical tensions. Meanwhile, the USD is extending its recovery from multi-year lows, which could temporarily limit commodity gains. Positive risk sentiment across financial markets might act as a short-term headwind for XAU/USD ahead of upcoming Fed speeches. However, the long-term bullish trend has returned, and gold looks poised to challenge new all-time highs in the near term.
🔎 Technical Analysis (H1/H4)
Price has broken the descending trendline, confirming that the uptrend is back in play.
Short-term support: 3686–3684, holding above this level keeps the bullish structure intact.
Next support: 3670–3668, aligned with CP and liquidity zones on the chart.
Key resistance: 3720–3722, a critical reaction area for potential profit-taking or liquidity sweeps.
🔑 Key Levels
Resistance: 3707 ➡️ 3720
Support: 3685 ➡️ 3669 ➡️ 3658
📈 Scenarios & Trading Plan
BUY ZONE 1: 3686–3684
SL: 3680
TP: 3690 ➡️ 3695 ➡️ 3700 ➡️ 3705 ➡️ 3710 ➡️ 3720 ➡️ ???
BUY ZONE 2: 3670–3668
SL: 3664
TP: 3675 ➡️ 3680 ➡️ 3690 ➡️ 3700 ➡️ ???
SELL ZONE (Watch for Liquidity Trap): 3720–3722
SL: 3726
TP: 3715 ➡️ 3710 ➡️ 3705 ➡️ 3700 ➡️ ???
⚠️ Risk Management Notes
Be cautious of liquidity sweeps around 3720–3722 — price could fake a breakout before reversing lower.
Enter longs only after price action confirmation at support zones; avoid chasing price mid-range.
Adjust position sizing carefully, considering potential volatility from Fed speeches and geopolitical headlines.
Summary
Gold’s long-term uptrend is back, supported by dovish Fed signals and rising global tensions. The strategy prioritizes buying dips at 3686–3684 and 3670–3668 aiming for 3705–3720, while short-term selling at 3720–3722 remains valid if rejection signals appear.
For more timely updates and refined setups, consider following the MMFLOW Trading profile on TradingView to stay aligned with evolving market conditions.

XAU/USD Bullish Channel Breakout Setup – Buy from Support 3685, Chart Analysis
Trend & Structure
Price is moving inside an ascending channel (highlighted in red and blue trendlines).
Currently, the market is near the upper boundary of the channel, showing bullish momentum.
A support level is marked around 3685–3690, where the price has previously respected.
Trade Setup (Long Position)
Entry Point: 3685.79
Stop Loss: 3671.88 (below support, giving space in case of a false breakout).
Target Point: 3745.80
Risk-to-Reward Ratio (RRR)
Risk: ~14 points (3685 → 3671).
Reward: ~60 points (3685 → 3745).
RRR ≈ 1:4.3, which is very favorable.
Expected Price Action
Chart shows a possible retest of support (3685) before bouncing upward.
If the support holds, price is expected to rally toward 3745 resistance/target zone.
If the support breaks, SL will protect from further downside.
📊 Summary
Bias: Bullish continuation.
Reason: Price respecting ascending channel + strong support level + bullish structure.
Setup: Buy near 3685 with SL at 3671 and TP at 3745 (RRR > 1:4).
⚠️ Note: If price closes strongly below 3680 (support), this setup becomes invalid.

Gold Price Outlook – Trade Setup📊 Technical Structure
Gold (XAU/USD) is trading near $3,693, bouncing from the support zone at $3,688–$3,685. The chart highlights a bullish continuation setup, with price action aiming towards the resistance zone $3,703–$3,707. The strong rebound from support underlines sustained buyer interest, while momentum remains positive above $3,685.
🎯 Trade Setup
Entry: $3,688 – $3,685 (near support rebound)
Stop Loss: $3,684 (below support)
Take Profit: $3,703 / $3,707 (resistance zone)
Risk/Reward: ~1 : 4.98
🗝️ Key Technical Levels
Resistance Zone: $3,703 – $3,707
Support Zone: $3,688 – $3,685
Major Resistance Above: $3,716 all-time high
Key Support Below: $3,672
🌐 Macro Background
Gold remains supported after the Fed’s recent 25 bps rate cut, its first of 2025, which reflects rising concerns about labour market softness. While Fed Chair Powell stressed a cautious “meeting-by-meeting” approach to further easing, markets still expect additional cuts this year, reducing the opportunity cost of holding non-yielding assets like gold. Meanwhile, geopolitical tensions—ranging from Russia’s intensified military actions in Ukraine to persistent conflicts in the Middle East—continue to bolster gold’s safe-haven appeal. However, traders remain attentive to upcoming Fedspeak for fresh signals on policy direction, which could add volatility.
📌 Trade Summary
The technical setup favours a long entry around $3,685–$3,688, targeting the $3,703–$3,707 resistance area. The bias stays bullish above $3,685, but a break below could signal a deeper retracement towards $3,672.
⚠️ Disclaimer
This analysis is for reference only and does not constitute trading advice. Trading involves significant risk, and proper risk management is essential.

9/ 22: Trade Within 3718–3668 Range, Watch Support Near 3666Good morning everyone!
Following last week’s rate decision, gold retested support around 3630 and confirmed the level before reclaiming 3658 resistance. This week’s opening saw prices rally above 3690, approaching the 3700 psychological level.
⚠️ Key Levels to Watch:
If price holds above 3666 support, bulls may attempt another test of 3700, with potential to extend into the 3706–3712/3721 resistance zone. Long positions should manage risk carefully here and avoid chasing at highs.
If price breaks below 3666, monitor the 2H chart for possible signs of trend reversal.
📌 Trading Outlook:
Focus on the 3718–3668 range for intraday opportunities.
Near or above 3700, consider selling opportunities.
On a pullback below 3670, look for buying setups.

XAUUSD Week ahead analysis GOLD With FOMOC had a significant rejection to the daily 10ema which is complete break of strcutre of the daily trend. As higher timeframe monthly and weekly price is significantly bullish, at the endo the week see XAUUSD has rejected with a stong momentum and may continue to rise up to potentially all time high.
More in depth analysis has shown in this video

Gold Forecast for Next WeekGold prices are currently hovering around the 3684 level and have generally been trading within a high-range consolidation zone. Focus on the resistance zone between 3700 and 3710.A breakout above this level is expected to open up room for a new round of upward movement.
Next week, attention should be paid to the following scenario: if gold prices retrace to around 3660 and stabilize there, and a bottoming pattern forms on smaller timeframes, consider going long with a light position. Set TP 3710 and 3720, with a SL 3650.Currently, gold prices are in a phase of bull-bear rivalry, and the 3680 area is crucial as a central price level. From a personal perspective, short-term operations should focus on buying low and selling high within the 3630 – 3700 range. Medium and long-term investors may wait for a clear directional signal before making positioning decisions.
Daily-updated accurate signals are at your disposal. If you run into any problems while trading, these signals serve as a reliable reference—don’t hesitate to use them! I truly hope they bring you significant assistance
GOLD INTRESTED NEXT WEEK IN BULLISH OR BEARISH ? Obviously Bullish 📌
Gold Buy Zones
OB+ 3622 Buying Area To Hold For Much Profitsss
Targets 100 Pips
Targets 500 Pips
Good Luck With Your Trading 🤞

Gold has returned to its upward trendCurrently, the bulls in the gold market have the upper hand. The recent short - term pullback in gold prices is merely an adjustment and does not signal a real trend reversal. After gold broke through the short - term downward trend line on the chart, it rebounded upwards again. As a result, the 3660 level has now transformed into a support level. Any retracement of gold to above 3660 presents an opportunity to go long on dips.
Given that the gold bulls have managed to reverse the situation after multiple downward probes and the price has ultimately continued to rise, it indicates that the strength of the gold bulls is more dominant. Gold has returned to its upward trend, and the short - term adjustment may have ended. Therefore, on any retracement, it is still an opportunity to go long along the trend.

Gold Forecast: Liquidity Zones Mapped | Bullish or Bearish ReverGoldRush_Traders institutional forecast.
Price closed at 3684.975, compressing under ATH (3707).
Stacked supply zones remain valid between 3707 and 3686 — each serving a different purpose: sweep trap, blow-off top risk, and rejection base.
🔺**Bullish Path:**
• Hold 3665–3672 or sweep 3638
• Break above 3695 → 3707
• Clean ATH break = 3720–3732 possible
🔻 **Bearish Path:**
• Fail at 3686–3700 zone
• Drop to 3665 → 3638
• Break of 3628 = opens flush to 3605 or 3582
⚠️ Zones are stacked with no gaps — each has distinct algorithmic purpose.
This is a **provisional forecast** pending any weekend news shifts.
🔱 Liquidity-based | ICT/SMC inspired

Gold Analysis and HighlightsHi Traders
The market is expected to start the week with an upward move toward the resistance zones at 86 (buyers’ TP, which hasn’t been touched yet), resistance at 3688, and the 1H breaker block. Upon reaching these areas, I expect the first pullback toward the broken 15-minute equilibrium candle (zone 65.72 with 69 as the midpoint). If this zone holds as support, the market could target 2703 (hunt line that hasn’t had its pullback yet) before moving back toward lower liquidity points such as 3639 (sellers’ TP is positioned below – liquidity hunt) and 3626 liquidity, with support at 3623–3618 below it. From there, the market will decide its direction. If the 1H closes below this level, we’ll likely see a correction; otherwise, with just a shadow wick, it could still take out the daily liquidity above the high wick again

Weekly Market Review For GoldGold has recently been in a high-level consolidation phase. After a consecutive pullback on the daily chart, it turned bullish on Friday, indicating significant support at the lower end. The current key pivot levels lie at the resistance level around 3700 and the support level near 3620; the wide trading range has increased operational difficulty, requiring patience to wait for opportunities.
Technically, the 4-hour chart has broken above the short-term downtrend line, with the 3660 level shifting from resistance to a key support. The short-term trend leans bullish, so strategically, one can look to enter long positions within the 3650–3660 range when opportunities arise.
In the medium to long term, while the weekly chart deviates from the moving average and needs time for consolidation, the underlying logic of the fundamentals remains solid. Although the market has priced in the Fed’s first interest rate cut, the probability of further rate cuts in October and December remains high. The subsequent expectation-driven rally will continue to provide support for gold prices. With the core of the long-term uptrend support gradually moving higher, there are insufficient conditions for a sharp decline, and the overall trend will remain in a consolidative upward pattern.

**Gold (XAU/USD) 30M – Bullish Breakout with OB Zone Retest TowaStructure
Price was moving inside a descending channel (marked in red and blue).
Recently, price broke out of the channel to the upside, showing potential bullish momentum.
2. Key Levels
OB Zone (Order Block): Around 3645 – 3632, marked as the demand area where buyers may step in if price retests.
Target Point: 3707, which is the projected bullish target after breakout.
3. Trade Idea (Marked on Chart)
The plan suggests price may retest the OB Zone before resuming its bullish push.
If OB zone holds, a strong move upward toward 3707 is expected.
4. Risk/Reward
Stop-loss appears just below 3632 (OB zone low).
Take-profit at 3707.
This gives a favorable risk-to-reward setup.
5. Market Sentiment
Breakout from the bearish channel → bullish signal.
OB zone = possible pullback entry point.
If price fails OB zone support and closes below 3630, bullish idea becomes invalid.
✅ Summary: The chart shows a potential bullish reversal on Gold. The strategy is to wait for a pullback into the OB Zone (3645–3632) and then target 3707. If the OB zone breaks, expect further downside.

GOLD Resistance Ahead!
HI,Traders !
#GOLD keeps growing
But a strong horizontal
Resistance of 3698.54
Is ahead so after the
Retest we will be expecting
A local bearish move down !
Comment and subscribe to help us grow !

Gold - Here we have the textbook breakout!📖Gold ( TVC:GOLD ) currently breaks out:
🔎Analysis summary:
After we saw Gold rejecting the previous all time high multiple times over the past couple of months, we are now witnessing a bullish breakout. If this breakout is confirmed in the near future, Gold will head for another parabolic rally higher, repeating the 2011 blow off top.
📝Levels to watch:
$3.500
SwingTraderPhil
SwingTrading.Simplified. | Investing.Simplified. | #LONGTERMVISION

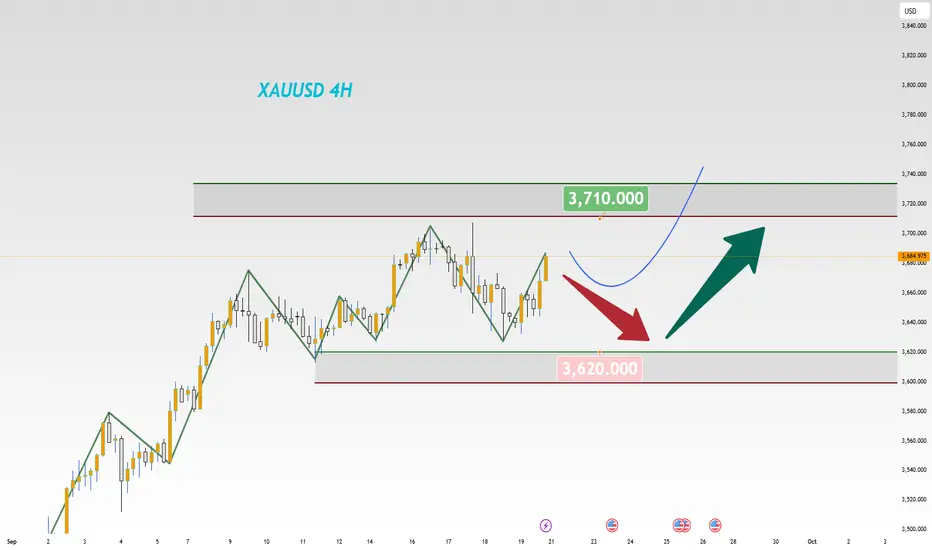
Today's Gold Trading Recommendation From the 4H chart analysis, the effective support level remains around the 3620, a key defensive support zone to focus on currently. If this level is breached further, the bull-bear dynamic may shift in the future. On the upside, the key resistance lies in the 3700-3710 range.
In terms of trading operations, plan long and short positions within this range. For prices in the middle of this interval, it is advisable to watch more, trade less, avoid chasing trades recklessly and wait patiently for entries at key levels.
Buy 3630 - 3640
TP 3650 - 3660 - 3670
Daily-updated accurate signals are at your disposal. If you run into any problems while trading, these signals serve as a reliable reference—don’t hesitate to use them! I truly hope they bring you significant assistance
