Brief Review Yesterday, gold rallied before pulling back, fluctuating after hitting a new all-time high, as the market turned cautious ahead of the Fed policy decision. For the day, the probability of range-bound consolidation or a technical correction is high; focus on the support level of 3650-3635 and resistance level at 3710,with the short-term overbought pattern needing to be repaired.
Key attention should be paid to the interpretation of the Fed's dot plot, Powell's speech and the trend of the U.S. Dollar Index. Powell described the 25% rate cut as a "risk-management cut," aimed at addressing downside risks in the labor market. He emphasized that future policies will be "highly data-dependent" and rate cuts will be gradual and cautious.
Employment and inflation data are critical: Weak data will strengthen rate-cut expectations, boosting gold; resurgent inflation will dampen such expectations, weighing on gold.
Daily-updated accurate signals are at your disposal. If you run into any problems while trading, these signals serve as a reliable reference—don’t hesitate to use them! I truly hope they bring you significant assistance
Xauusdsignal

Bullish Breakout Trade Setup on XAU/USD – Targeting 3,707 After Chart Components and Analysis
1. Descending Channel
The price was previously moving within a clearly defined downtrend channel (marked in red with blue borders).
The lower and upper bounds are acting as dynamic support and resistance levels.
2. Breakout Zone
The price appears to have broken out of the descending channel to the upside, or is attempting to break out.
The breakout suggests a potential reversal or bullish momentum.
📈 Trade Setup Details
Element Level Description
Entry Point 3,654.27 Suggested level to enter a long position
Stop Loss 3,643.58 Risk management level below recent support
Target Point 3,707.38 Take profit target at the next resistance zone
Current Price 3,662.37 Price at the time of chart capture
📊 Risk-to-Reward Ratio (RRR)
Entry: 3,654.27
Stop Loss: 3,643.58 → ~10.69 points risk
Target: 3,707.38 → ~53.11 points reward
➡️ Risk-to-Reward Ratio ≈ 1:5, which is excellent. It suggests a well-planned trade with high reward potential relative to the risk.
📉 Price Action Forecast
The black zigzag line suggests expected short-term price retracement before moving up.
This could be a bullish flag pattern or a retest of the breakout zone before continuation upward.
✅ Bullish Indicators
Channel breakout.
High RRR.
Structured trade setup with clearly defined stop loss and target.
⚠️ Risks & Considerations
False breakout: Wait for confirmation (candle close outside the channel).
Market volatility: Economic news could affect Gold prices.
Retest failure: If price fails to hold above entry zone, trade invalidates.
🧠 Conclusion
This is a bullish breakout trade with a strong risk-to-reward profile. The trade logic hinges on the assumption that Gold has ended its correction (downtrend channel) and is now beginning a new upward leg. If the price successfully holds above the breakout level and continues upward, the target around 3,707 is realistic.

XAUUSD Reversal Signs Grow – Bears Eye 3620/3570In yesterday’s analysis, I pointed out that while OANDA:XAUUSD remains technically bullish, the signs of a potential reversal were already piling up.
That view played out quickly: after spiking above 3700 on the Fed’s decision — which triggered my sell orders — gold reversed sharply, dropping all the way to a local bottom near 3645.
The market then staged a natural rebound after such a violent sell-off, and at the time of writing, price is consolidating around 3655. Interestingly, this was last week’s resistance, now acting as short-term support.
Looking ahead, I believe the correction of the nearly 4,000-pip rally in less than a month is far from over. A fresh drop could be next.
For the bears, the key levels to watch are:
• 3620 – the first checkpoint for potential downside continuation
• 3560-3670 – a stronger support zone I’ve highlighted before, aligning with the 38% Fibonacci retracement of the latest rally
A move towards these levels would still be a healthy correction within the broader bullish context — not at all an out-of-the-question scenario. 🚀

[Update] ANFIBO | XAUUSD ON 09.17.2025 HIT 600 PIPSAwesome, this is a BIG PROFIT for those who followed and paid attention to my Plan. Resistance level 3705 gave us 6OO pips and could have been more. Congratulations everyone and good luck!

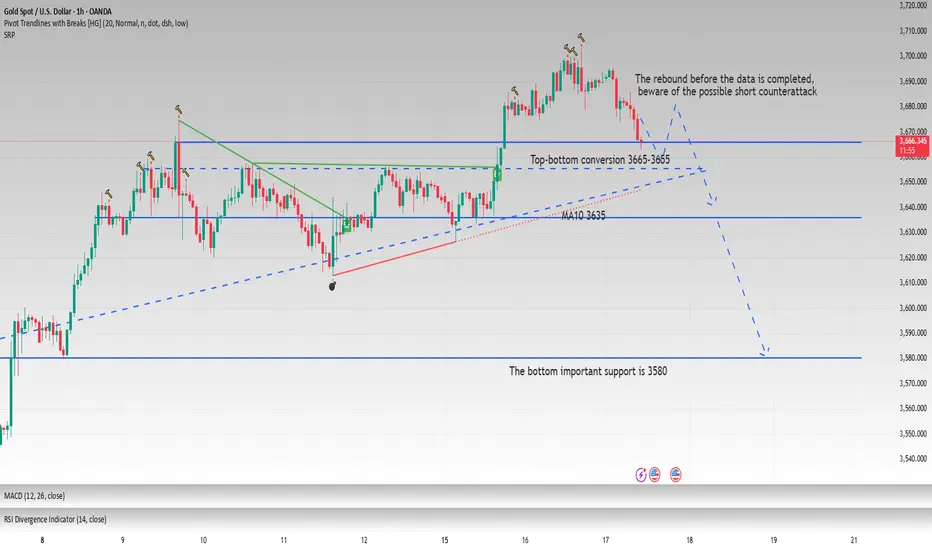
Go long before the data,be wary of a short-selling counterattackYesterday, gold retreated slightly in the Asian session, continuing the strong bull pattern. We originally expected to wait for gold to retreat to the support level of 3675-3665 to go long on gold, but the market always only gives us unattainable points. In the evening, gold rebounded directly to around 3703, which is in line with my previous judgment that gold will touch 3700 after stabilizing above 3665. As gold hit a new high and the Fed was about to cut interest rates, some buyers on the upper side chose to take profits, which gave us another opportunity to retreat to the ideal point. We also successfully seized the opportunity to go long on gold. This morning, gold rebounded again to around 3695, and the long positions we held also made a wave of profits.
Judging from the current market conditions, yesterday's daily line closed with a positive sign, and 3703 became the short-term high point. The lower moving averages MA5 and MA10 in the daily chart are around 3665 and 3635 respectively, which is exactly the middle track position of the Bollinger band. Only when it effectively falls below this point, will gold usher in a trend reversal in the short term. 3665 is the key position for the top and bottom conversion, and the market's enthusiasm for a 50 basis point interest rate cut remains unabated. If gold falls back to 3665-3655 again in the European session without breaking, then gold will rebound. Therefore, before the data is released, I choose to go long on gold again and expect a rebound, with the short-term target at 3685-3705. Bros can gradually reduce their positions during the rebound or take profits and exit at appropriate points according to their own account conditions.
With the meeting coming, will gold prices soar or plummet?Technical analysis of gold: Judging from the current trend, gold is approaching the 3700 mark. Bulls are surrounding it but not attacking, waiting for guidance from the Federal Reserve's interest rate decision. Overall, gold has risen by nearly $400 since it rose from 3311. For now, it is still in a bullish trend. Don't easily say it has reached the top before the trend reverses. From a technical point of view, the intraday support point is reflected in the daily cycle. On the unilateral moving average of the H4 cycle, the lower support is in the 3660-3650 area. You can just focus on these two points and go long. In principle, we don’t guess the top of the upper space, but the visible target is expected to be around 3710-3720. If it continues to rise, it may even reach 3730. After a phased rise during the U.S. trading session, we will see whether we can keep long positions and wait for the Federal Reserve's interest rate decision based on actual conditions. The Federal Reserve will definitely cut interest rates this time, but the first rate cut will not be a large-scale release of money. It is expected to cut interest rates by 25 basis points. The market performance is to sell expectations and buy facts. The current rise in gold from the end of August to September has achieved expectations. Therefore, after the actual confirmation of the rate cut, the market is expected to move in the opposite direction because the expectations have been fulfilled, and the historical performance is the same. To sum up the above: for the lower support, first pay attention to the area around 3660, and continue to look up to the 3680-3690 area. If the support is broken strongly, you can participate in long positions in the 3630-3620 area. At present, pay attention to the area around 3685-3695 in the short term and try to short. On the whole, the short-term strategy for gold today is still to arrange long positions on dips, supplemented by light positions in short positions when it rebounds to key resistance levels. The short-term focus on the upper side is the 3700-3720 line of resistance, and the short-term focus on the lower side is the 3660-3650 line of support.

Gold Next levelsThis chart analysis for XAUUSD (Gold vs USD, 1H timeframe) shows that price is currently holding above a rising trendline, indicating bullish momentum. The nearest support zone is around 3620, where price has already bounced. If the bullish structure continues, the upside targets are:
Target 1: 3657
Target 2: 3673
Target 3 / New High Zone: 3708
As long as price stays above the trendline and 3620 support, the outlook remains bullish with potential continuation towards new highs.

Don’t blindly shortFrom the 4-hour chart analysis, the support level remains solid. Today if prices pull back, stick to this level for bullish trades.
As we mentioned earlier, it is advisable not to blindly follow short positions; wait for the Fed to confirm the interest rate cut.
Daily-updated accurate signals are at your disposal. If you run into any problems while trading, these signals serve as a reliable reference—don’t hesitate to use them! I truly hope they bring you significant assistance

FOMC GOLD UPDATE !Gold Structure Buying In H1
Buy From FVG
Buy From Order Block
Buy From Breaker Block
Buy From MSS FVG
Follow Us For More Trades

ANFIBO | XAUUSD on 09.17.2025 and is this a major breakthrough?Here's Anfibo. With my yesterday's plan, our sell OANDA:XAUUSD order reached more than 200 pips, the buy order was 30 pips short of matching the entry and missed 150 pips short. But that's okay, I have a new plan today for everyone to follow:
💚 SUPPORT ZONES: 3676 - 3660
❤️ RESISTANCE ZONES: 3694 - 3700 - 3705 - 3719 - 3745
✅ BUY SCALP: 3675 - 3677, SL 3674, TP 3694 - 3700 - 3719
❌ SELL SCALP: 3719 - 3721, SL 3723, TP 3700 - 3675 - 3660
- - - - - - - - - - - - -
✅ SWING BUY: 3550 - 3560, SL 3540, TP 3625 - 3675 - 3700 - OPEN
❌ SWING SELL: 3790 - 3801, SL 2820, TP 3700 - 3570 - 3450 - OPEN
Hope is right lol! xoxo

17/9/68 : XAUUSD ( US Session )Using it from US Session until 11.00AM , I'll new analysis and update at 12.00PM
Resistance
3697-3703
3687-3692
3677-3682
3671
Support
3661
3651-3656
3640-3646
3630-3635

Don’t fight the market, act when the time is right!Driven by rising expectations of a Federal Reserve rate cut and a weakening US dollar, gold prices continued to climb this week, reaching a historic high of $3,700 on Tuesday. Market expectations are that the Fed will announce a 25 basis point rate cut in its upcoming meeting. If Chairman Powell further emphasizes concerns about the job market and confirms a path of three rate cuts this year in a subsequent press conference, gold prices are expected to gain renewed upward momentum.
From a technical perspective, the hourly chart shows solid support in the 3665-3660 range. If gold prices hold this level before the European session, it will provide a strong defensive foundation for bulls and can also be considered a useful reference area for short-term long positions. Once the price re-establishes itself at the 3700 level, it is expected to further challenge the 3710-3720 resistance level. A breakout with strong volume could open up further upside potential, continuing the bullish trend.
Prior to the Federal Reserve's interest rate decision, the market is likely to remain volatile at high levels, accumulating momentum for major news releases. We recommend primarily buying on dips. The current bull-bear watershed is 3650; if this level falls, be wary of the risk of a further correction.

Gold (XAUUSD) 1D TF Symmetrical Triangle BreakoutOANDA:XAUUSD
Symmetrical triangle consolidation (May–Aug 2025). Breakout confirmed in early September with a strong vertical rally. Volume/price action suggests a valid breakout, not a fakeout.
Current Price: $3,635
ATH at $3,674
📌 Target Levels (charted white lines + structure)
1️⃣ $3,605 → Already tested/holding as immediate breakout validation.
This is acting as the first resistance → now turned support.
2️⃣ $3,518 → Previous consolidation resistance.
If price pulls back, this is the first major retest zone.
A healthy retracement could wick into this area before resuming trend.
3️⃣ $3,428 → Secondary support and former supply zone.
This is deeper correction territory.
Break below this weakens momentum but doesn’t kill the bullish structure.
?️ $3,377 → The “?” zone is the triangle apex retest (classic in TA).
If gold corrects sharply, this is the line in the sand where buyers MUST defend.
Losing this would suggest a probable failed breakout and open more downside.
🎯 Forward Outlook
Bullish Path: As long as price stays above $3,518– or a retest at $3,428 / $3,377 continuation toward $3,700+ and eventually $4,000 is very much on the table.
📉 Correction Path: A dip to $3,428–$3,518 would be a healthy reset after the parabolic move.
Invalidation: A daily close below $3,377 would put the breakout at risk.
Gold broke out of its triangle with power. Now, $3,605 is the “make or break” line. Hold above it, and bulls keep control with eyes on $3,700–$4,000. 👀
Lose $3,377, and the breakout fizzles into deeper correction.
What do you think! 💡 let me know your view on this idea ?
Always DYOR,
Trade Safely,
See you on the other side,
-Jova

17/9/68 : XAUUSD ( Europe / London Session )Using it from Europe Session until 7.00PM , I'll new analysis and update at 8.00PM
Resistance
3703-3708
3691-3697
3686
Support
3676
3665-3670
3654-3660

Fed Cuts Could Ignite a Breakout Above $3,700?📊 Technical Structure
Gold (XAU/USD) is trading near $3,682 after bouncing from the support zone at $3,678 – $3,679. The chart highlights a bullish setup, with potential continuation towards the resistance zone $3,691 – $3,695. The short-term trendline break also supports renewed upside momentum, while buyers remain in control above the support base.
🎯 Trade Setup
Entry: $3,678 – $3,679 (near support zone)
Stop Loss: $3,677 (below support)
Take Profit: $3,691 / $3,695 (resistance zone)
Risk/Reward: ~1 : 7.17
🗝️ Key Technical Levels
Resistance Zone: $3,691 – $3,695
Support Zone: $3,678 – $3,679
Major Resistance Above: $3,700 psychological barrier
Key Support Below: $3,674
🌐 Macro Background
Gold is firming up as markets await the FOMC decision, with traders widely expecting a 25 bps Fed rate cut—the first in 2025. The prospect of further cuts later this year supports gold as a non-yielding asset. However, easing US-China trade tensions and improved risk sentiment could limit haven flows in the short run.
📌 Trade Summary
The technical setup favours a long entry near $3,679, targeting the $3,691–$3,695 resistance area. The bias remains bullish while gold holds above $3,678 support. Watch for volatility around the Fed decision later today.
⚠️ Disclaimer
This analysis is for reference only and does not constitute trading advice. Trading involves significant risk, and proper risk management is essential.

Gold Bulls Walking on Thin Ice1. Yesterday’s action
In yesterday’s analysis I said that although the chart looks bullish, Gold bulls should be very careful. After all, price had already climbed 4,000 pips in less than a month, and such complacency usually doesn’t end well.
During yesterday’s session, XAUUSD spiked above 3700, quickly reversed, and touched the newly formed support at 3675. From there, price attempted another push higher. Now we are once again back at support.
2. Key question
Will the 3670 zone hold, or are bulls about to lose control of the market?
3. Why caution is needed
• The chart is still bullish overall, but the structure is becoming increasingly concerning.
• If bulls lose the 3670 zone, I don’t expect a quick rebound from 3650.
• Instead, the market is more likely to continue lower, with at least a move toward 3620.
4. Trading plan
• From my perspective, buying here is very risky, even riskier than selling.
• I remain out of the market, waiting for a GOOD entry to sell.
• My target is a 700–1000 pip as usual, which I believe will come to the downside, not the upside.
5. Conclusion
Gold’s chart may still look bullish, but risk is shifting quickly. Chasing longs here could be dangerous — patience and discipline are key until the right sell opportunity appears 🚀

9/17: Ahead of Rate Decision, Trade Within 3668–3706 RangeGood morning, everyone!
Yesterday, after breaking above 3682, the price reached the 3692–3702 area before pulling back. Those of you who carefully followed the strategy should have caught this move.
At the moment, the price is near support. Ahead of the interest rate decision, the main support lies around 3670–3658, while resistance is in the 3700–3706/3712 area. Trading can be focused within the 3706–3668 range.
The key today is the interest rate decision. If the price falls before the news, then buying opportunities may arise during the announcement. If the price rises beforehand, look for selling opportunities after the news.
I’ve marked today’s intraday trading range on the chart for reference. You can plan trades based on the price area. If anything is unclear, feel free to leave me a message.

GOLD READY TO FALL ? Gold Prediction
Gold Buy From Order Block / Demand Zone
It Will Sweep The Liquidity And Then Go Long With High Probability Setup

ANFIBO | XAUUSD got ATH on 09.16.2025 and what?Gold has made a new breakout by breaking through the sizeway zone and rising to a new ATH. The plan is that we need to pay attention to the price zone around the 3700 resistance. Today's plan is as follows:
💚 SUPPORT ZONES: 3675 - 3655
❤️ RESISTANCE ZONES: 3700 - 3705 - 3745
✅ BUY SCALP: around 3675, SL 3670, TP 3700 - 3745
❌ SELL SCALP: 3700 - 3705, SL 3710, TP 3675 - 3655
✅ SWING BUY: 3550 - 3560, SL 3540, TP 3625 - 3675 - 3700 - OPEN
❌ SWING SELL: 3790 - 3801, SL 2820, TP 3700 - 3570 - 3450 - OPEN
Hope is right!

The opportunity is right in front of you, don’t miss it!Yesterday, the technical analysis of gold showed a rapid downward retreat in the Asian session, breaking through the 3630 mark and stabilizing and rebounding. It fluctuated and consolidated around the 3630 mark in the European and US sessions, and finally ushered in a strong rise by bulls. The price of gold accelerated to break through and stand above the 3670 mark to set a new historical high. The gold bulls rose as expected, and there are still new highs above, so we are patiently waiting for gold to continue to rise. When it falls back, we will continue to look for opportunities to enter the market and go long. Yesterday, we responded flexibly around the key points, and made precise arrangements with two-way thinking to achieve a double kill of long and short, a steady harvest, and perfectly reach our goals. Today we continue to wait for further declines. After all, all indicators are bullish. Don’t guess the top if the bulls are strong. If the Federal Reserve’s interest rate decision is on Thursday, then the line around 3700 will also be within reach. At present, don’t blindly chase the longs above the 3680 line. If your current trading is not ideal, I hope I can help you avoid investment pitfalls. Welcome to communicate with us!
From the 4-hour analysis, the support below is around 3670-3360. If it pulls back to this position, the main bullish trend will remain unchanged. The short-term bullish strong dividing line is 3650. As long as the daily closing level does not fall below this position, any pullback is an opportunity to go long, and the main tone of participating in the trend will remain unchanged. I will provide you with the specific operation strategies at the bottom, please pay attention to them in time.
Gold operation strategy: Go long when gold falls back to around 3675-3360, target 3690-3695. If it breaks, look at the 3700 line.

XAUUSD – Bullish Bias Targeting Buy-Side LiquidityOn the 1H timeframe, my perspective on Gold (XAUUSD) remains bullish, with the main target being the buy-side liquidity above current price.
Price has recently formed a bullish Fair Value Gap (FVG), which may serve as support and a potential launch point for further upside. If price holds here, we could see continuation toward higher levels. For entry, I’ll be waiting for lower timeframe reaction and confirmation.
However, it’s also important to note the sell-side liquidity resting just below the FVG. There is a possibility that price may first sweep this liquidity, tap into the underlying bullish order block, and then begin the upward move.
For this reason, I am watching two key areas:
1️⃣ The current bullish FVG as initial support.
2️⃣ The deeper bullish order block, should liquidity below be cleared.
In both cases, my bias remains bullish, but execution will depend on LTF confirmation at these zones.
💌It is my honor to share your comments with me💌
🔎 DYOR
💡Wait for the update!

16/9/68 : XAUUSD ( US Session )Using it from US Session until 11.00AM , I'll new analysis and update at 12.00PM
Resistance
3719-3724
3707-3713
3702
Support
3691
3681-3686
3671-3676

Gold Trade Set Up Sep 16 2025www.tradingview.com
Gold has broke PDH and has came in a prime price of 3700 where a lot of traders will try to short so if we see price close under this current key zone with a retest to a 5m OB/supply i will look for sells down to the next key zone or 1h FVG
