XAUUSD Looks Ready for a Big MoveHey everyone, Ken here!
Looking at the XAUUSD chart today, I see a lot of interesting things. The price isn’t rushing upward, but moving step by step – almost like buyers are slowly taking control.
Personally, I won’t jump in just yet. I’d like to see a clear rejection first. If that scenario plays out, my target would be around 3,683 .
What really matters here isn’t just the number, but patience. I’ll wait for price to return to the marked level, then watch volume and candlestick patterns for confirmation.
What about you? Do you think this setup makes sense? Share your thoughts in the comments!
Xauusdsignal

Fed rate cut undecided,small trades recommended.At present, it is in a range-bound oscillation between 3626 and 3646. There will not be much volatility before the Fed decides to cut interest rates. It is recommended to conduct relatively small transactions as much as possible to avoid losses due to the other non-official news background about the policy
Buy 3625 - 3635
TP 3645 - 3655 - 3675

15/9/68 : XAUUSD ( Europe / London Session )Using it from Europe Session until 7.00PM , I'll new analysis and update at 8.00PM
Resistance
3666-3671
3656-3661
3651
Support
3641
3631-3636
3620-3626

3655-3625 oscillation structure, sell high and buy low#XAUUSD OANDA:XAUUSD
Over the weekend, I reminded everyone to pay attention to a hidden piece of news.💻
China and the United States are currently holding their fourth round of talks in Spain on economic and trade issues, which involves tariffs. The outcome of the game between the two major powers will also affect the trend of gold. 📊The two sides are still negotiating, so please continue to pay attention.👀
Gold continued to fluctuate in the box at the opening today, fell slightly during the day and rebounded after testing the support below again. 🌈The short-term upward pressure still remains at 3655-3665. 📉I have repeatedly emphasized that only by breaking through and stabilizing above can gold continue to open up upward space. If it is difficult to break through during the day, gold will continue to fluctuate and pull back.
The price of gold is still in an upward channel. The correction range of gold at high levels is limited. The short-term support below is 3635-3625.🥅 Before it effectively falls below the support, it is difficult for gold to change the volatile pattern. However, if the price breaks below support and breaks the box structure, it is very likely to test the 3600 mark, or even the important support level of 3580.🐻
If the 3655-3625 box is not broken during the day, the buy low-sell high strategy will be maintained. 📊If it falls back to 3635-3625, you can continue to go long on gold, with the target at 3655-3665. If the upper resistance is touched, you can short gold with a light position.

ANFIBO | XAUUSD Plan [15.10.2025 - 19.10.2025]Here is my XAUUSD plan for next week:
💚 SUPPORT ZONES : 3625 - 3595 - 3580 - 3575
❤️ RESISTANCE ZONES : 3665 - 3670 - 3700
✅ BUY SCALP : around 3595, SL 3580, TP 3625 - 3645 - 3670
❌ SELL SCALP :
(1) 3673 - 3675, SL 3678, TP 3645 - 3600
(2) 3700 - 3705, SL 3710, TP 3675 - 3610
✅ SWING BUY : 3550 - 3560, SL 3540, TP 3625 - 3675 - 3700 - OPEN
❌ SWING SELL : 3790 - 3801, SL 2820, TP 3700 - 3570 - 3450 - OPEN
Enjoy it guys! 😊

Gold (XAU/USD) Forex SignalGold (XAU/USD) has been showing strong bullish momentum recently, but the latest Zig Zag pattern and RSI (Relative Strength Index) suggest a potential correction in the short term. Let’s analyze and provide a clear forex trading signal.
Market Overview
| Pair | Gold (XAU/USD) |
| -------------- | ------------------------------- |
| Current Price | \$3,680.7 |
| Trend | Bullish with minor pullback |
| Key Indicators | Zig Zag (5,10), RSI (14, close) |
| Volatility | High |
| Market Session | US Session |
Technical Analysis
Zig Zag Indicator: The last leg shows a peak around **\$3,679.3** followed by a small correction, signaling possible short-term weakness.
RSI (14): Currently near the **55 level**, coming down from overbought territory (>70). This indicates the bullish rally may be slowing, and sellers could test the downside.
Support Levels: \$3,650 – \$3,620
Resistance Levels: \$3,720 – \$3,750
Gold Trading Signal (September 14, 2025)
| Signal Type | Sell (Short-term) |
| ------------- | --------------------- |
| Entry Zone | \$3,680 – \$3,690 |
| Stop Loss | \$3,720 |
| Take Profit 1 | \$3,650 |
| Take Profit 2 | \$3,620 |
Analysis: Since RSI has cooled off from overbought levels and Zig Zag shows a minor top formation, a short-term selling opportunity is expected. However, the long-term trend remains bullish, so aggressive traders may wait for dips to re-enter long positions.
Alternate Scenario
If gold breaks above \$3,720, the bearish setup becomes invalid, and bulls may drive the price toward \$3,750 – \$3,800.
FAQs on Gold Forex Signals
Q1: Is gold still a good buy in September 2025?
Yes, gold remains in a long-term uptrend, but short-term pullbacks are expected.
Q2: What is the best strategy for XAU/USD now?
Swing traders can short near resistance with tight SL, while long-term investors can buy on dips.
Q3: Which indicators are most useful for gold trading?
RSI, Zig Zag, Moving Averages, and Fibonacci retracements work well with gold volatility.
Conclusion
Gold (XAU/USD) is consolidating after a strong bullish move. Short-term traders can look for sell opportunities near \$3,680 with targets at \$3,650 – \$3,620, while long-term traders should stay bullish and buy dips.

Gold Nears All-Time High: Fed Cut Hype Fuels Trade Setups!Hello traders! Gold (XAU/USD) rose 0.4% on Friday (12/09/2025), closing at $3,648.55/oz, near its all-time high of $3,673.95/oz (09/09). Up 1.7% this week, marking its fourth consecutive weekly gain, gold is driven by a weakening US labor market, reinforcing expectations for the Fed’s first rate cut of 2025 on 17/09. Yesterday’s CPI and Jobless Claims showed inflation rising at its fastest in 7 months, but weak labor data dominates rate cut bets. Let’s analyze today’s market and find trade setups! 💰
Fundamental Analysis: Gold Thrives in Low-Rate Environment 🌟
Rate Cut Expectations: Weak US labor data (surging jobless claims, 911,000 jobs revised down) and prior weak PPI push markets to 100% odds of a 0.25% Fed rate cut, with lower odds for 0.5% (CME FedWatch). Low rates ease pressure on USD and Treasuries, boosting non-yielding gold.
Global Support: Gold’s 39% YTD surge is fueled by a weak USD, China’s 10-month gold buying streak, and global uncertainty. China’s move to simplify gold import regulations signals rising demand.
Key Focus: CPI (11/09) showed rising inflation, but labor weakness prioritizes Fed easing. Barring shocks (e.g., Trump tariffs), gold won’t drop sharply—dips are buying opportunities!
Technical Analysis: Consolidation Near Highs – Favor Buying Dips 📉
Gold is consolidating around the Fibonacci 2.618 (3650), with wide sideways action on the weekly chart, closing below 3650 as expected. It’s unclear if a deeper correction looms or if the uptrend continues, but liquidity zones at 359x and 354x are prime for buying, while round levels like 370x are ideal for selling if the rally persists. Watch volume for reversal or rejection signals.
Resistance: 3655 - 3684 - 3694 - 3704
Support: 3621 - 3595 - 3582 - 3559 - 3545
Trade Setups (Tight RR):
Buy Zone: 3582 - 3580 (SL: 3572; TP: 3590 - 3600 - 3610 - 3640) – Long-term buy on deep dips.
Buy Zone: 3546 - 3544 (SL: 3536; TP: 3554 - 3564 - 3574 - 3594) – Buy at strong support.
Sell Zone: 3703 - 3705 (SL: 3713; TP: 3695 - 3685 - 3675 - 3665) – Sell at round levels if rally continues.
Gold is consolidating near highs—watch for liquidity traps! Above 3621, bulls target new highs; below, test 359x/354x. Manage risk tightly ahead of Fed volatility! Will you buy dips or sell highs? Share your strategies below! 👇
#Gold #XAUUSD #Fed #CPI #TradingView #MarketUpdate #Forex #Investing #TechnicalAnalysis #GoldTrading #Finance #USInflation #RateCuts #CentralBanks

A brief discussion on analysis and next week's trendGood weekend, is everyone having a good day today? Did you get together with family and friends? Regardless, I hope everyone enjoyed themselves.
Let me briefly tell you about our situation this week and my views on the gold trend next week. Gold maintained high-level fluctuations overall this week. Although it is still in an upward channel, it can be clearly seen from the daily chart that the upward momentum has slowed down compared with the continuous rise in the previous two weeks. Another intuitive feeling is that the current space below is much larger than the space above.
On Thursday and Friday, I repeatedly emphasized that only if gold breaks above 3660 can it continue to rise and reach the short-term high of 3675, or even a new high of 3690-3700. Considering that some friends find it difficult to distinguish between a genuine breakout and a false breakout, I suggested that the short-term resistance level of 3655-3665 be observed. Here I share a small piece of knowledge for your reference. In the face of a possible spike in the market, 80% of fluctuations are within the range of approximately $5-10. If you are unsure whether a resistance level has been effectively broken or a support level has been broken in the short term, you might as well leave yourself some room for maneuver and use a combination of small and large cycles to make judgments to avoid being distracted by false fluctuations.
Therefore, next week we can still consider focusing on the upper resistance range of 3655-3665. If the candlestick chart entity stands firmly above the resistance area, then the market will be as we expected, and the upper space is expected to be further opened in the short term.
From the news perspective, the first is an invisible piece of news that China and the United States will hold their fourth meeting, which will involve issues such as tariffs. If the two sides reach an agreement or move in a good direction this time, it may cool down the risk aversion sentiment and gold may fall. Secondly, Trump and Fed Governor Tim Cook are currently in legal proceedings. If Trump wins the case, will it reignite concerns about the independence of the Federal Reserve and thus interfere with gold prices?
Finally, the most important thing is the Fed's clear interest rate cut basis point. The current market generally expects a 25 basis point rate cut. Whether the "buy expectations and sell facts" strategy we have always emphasized can be fulfilled and trigger a drop in gold prices depends on Powell's speech attitude. If his stance this time leans towards the hawks, then the market trend will most likely be in line with our expectations.
Overall, we need to be more cautious when going long on gold next week and not be too greedy for profits. There is limited upward space in the short term. Focus on the breakthrough of the 3655-3665 resistance and beware of the impact of news. At present, everything is just analysis. Specific operations can wait for Monday’s trading strategy. Finally, I wish you all a happy weekend!

Gold Dips Pre-CPI: Fed Cut Hype Fuels Buying Opportunities!Hello traders! Gold (XAU/USD) is slightly down today (11/09/2025) after yesterday’s weak PPI report—US wholesale inflation fell more than expected, boosting bets for a Fed rate cut next week to 100% for 0.25%, with growing odds for 0.5% (CME FedWatch). Tonight’s CPI and Jobless Claims at 19:30 ET will clarify inflation and labor trends, shaping the Fed’s exact cut. Gold won’t drop sharply unless hit by a shock like Trump tariffs—dips are buying opportunities! Let’s analyze today’s market and find trade setups! 💰
Fundamental Analysis: Gold Shines Bright 🌟
The weak PPI fuels rate cut expectations, easing pressure on USD and Treasuries, making non-yielding gold more attractive. With a 38% YTD surge (after 27% in 2024), gold is supported by a weak USD, China’s 10-month buying streak, and global uncertainty. CPI (11/09) will guide Fed policy—low inflation could push gold to new highs; high readings may trigger short-term dips. Keep RR tight!
Technical Analysis: Consolidation Pre-CPI – Favor Buying 📉
Gold rose in Asia but hit resistance at 364x OB, dropping to 362x with liquidity sweeps—set SLs carefully! The 362x zone is key; a break below could target 361x or 3600. The bullish trend remains strong—prioritize buying dips unless major resistance fails.
Resistance: 3640 - 3648 - 3659 - 3674
Support: 3621 - 3615 - 3607 - 3600
Trade Setups:
Sell Scalp: 3640 - 3642 (SL: 3646; TP: 3637 - 3632 - 3627)
Sell Zone: 3648 - 3650 (SL: 3658; TP: 3640 - 3630 - 3620)
Buy Scalp: 3617 - 3615 (SL: 3611; TP: 3620 - 3625 - 3630)
Buy Zone: 3601 - 3599 (SL: 3591; TP: 3611 - 3621 - 3631)
Gold is consolidating pre-CPI—watch for liquidity traps! Above 362x, bulls aim for new highs; below, test lower supports. Manage risk tightly before CPI volatility! Will you buy dips or sell highs? Share your strategies below! 👇
#Gold #XAUUSD #Fed #CPI #TradingView #MarketUpdate #Forex #Investing #TechnicalAnalysis #GoldTrading #Finance #USInflation

Gold - This pattern just repeats!🚑Gold ( TVC:GOLD ) shifts bearish soon:
🔎Analysis summary:
With the previous 10 year bullish cycle, Gold perfectly followed market structure. With this 10 year cycle, Gold is still perfectly respecting market structure. Overall, it becomes more and more likely that Gold creates a top formation with a bearish correction following soon.
📝Levels to watch:
$3,500
SwingTraderPhil
SwingTrading.Simplified. | Investing.Simplified. | #LONGTERMVISION

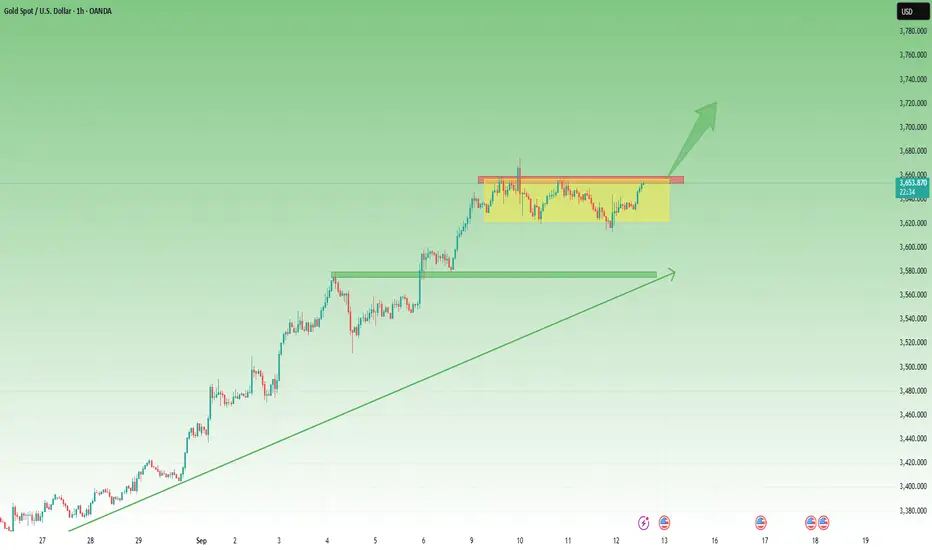
XAUUSD Scalp Buy @ 3643XAUUSD Scalp Buy @ 3643
XAUUSD – Scalp Buy Setup at 3643 | Intraday Momentum Play
Gold is showing bullish momentum on lower timeframes, bouncing off minor support at 3643. Price action confirms buyer interest, with indicators flashing short-term upside potential. This scalp setup is designed for fast execution and tight risk control.
📌 Trade Parameters
- Entry: 3643
- Stop Loss: 3637.5 (below recent wick)
- Take Profit: 3652 / 3655
- Risk/Reward: ~1.5–2:1
📊 Technical Confluence
- Price above 55-MA channel on M1/M5 charts
- Heiken Ashi candles turning green (trend confirmation)
- RSI climbing from mid-zone, showing momentum
- MACD crossover on 5M chart
- Volume spike on bullish candles
💬 Scalper’s Narrative
Gold is reacting positively to intraday support, with buyers stepping in around 3643. If price holds above 3645, expect a quick push toward 3652–3655. This scalp setup favors fast execution during active sessions. Avoid trading inside the MA channel—wait for breakout confirmation.
Setup remains valid unless price breaks below 3637.5 with volume. Align with higher timeframe bias: scalp buys only if price is above the 200-MA

Bulls and Bears Poised to StrikeGold is currently fluctuating in a narrow range around 3635-3655, with no clear signs of a breakthrough. However, judging from the current structure, gold has been showing an overall volatile upward trend since it rebounded near 3615.
What needs to be paid close attention to at present is the support performance near 3635. If gold can stand firmly above 3635, it will perfectly maintain the volatile upward structure and provide the prerequisite for breaking through the short-term resistance area of 3655-3665. Once gold uses this as a basis and breaks through the 3655-3665 area, then gold is expected to set a new high again, and even hit the area near 3700.
Since the bulls are still in an advantageous position and the overall structure of the market is oscillating upward, we have no reason not to execute long trades based on the long structure. Therefore, I think that in short-term trading, we can consider going moderately long on gold in the 3640-3630 area.

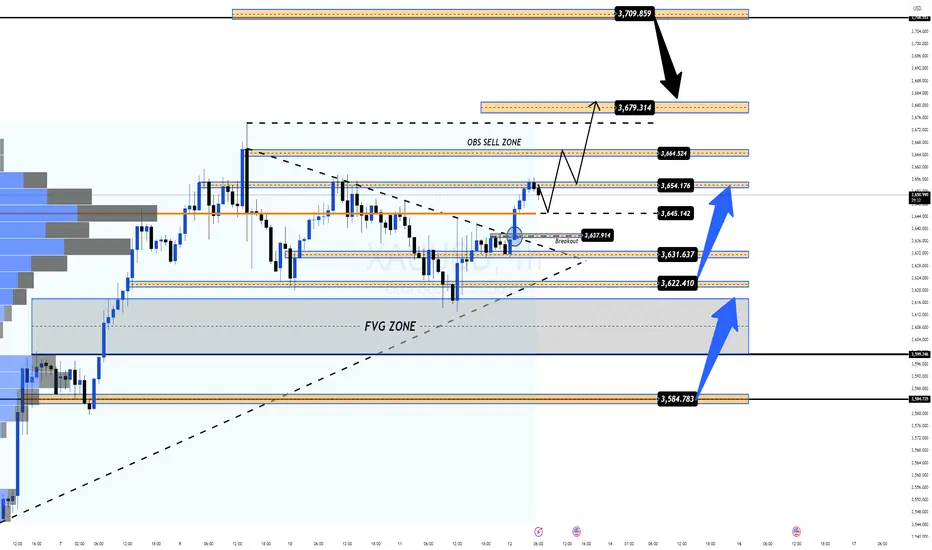
Breakout Confirmed, Macro Drivers & Key Liquidity Zones 🚀 XAUUSD | MMFLOW TRADING
📊 Market Context & Macro View
Gold (XAUUSD) has confirmed a breakout above its short-term descending trendline, signalling renewed bullish momentum after several sessions of compression. This move comes as traders price in slowing US inflation and increasing confidence that the Federal Reserve could pause or even ease monetary policy in the coming months.
🔹 Macro Drivers Supporting Gold:
US CPI & PPI softness → Indicates cooling inflation, reinforcing expectations for stable or lower rates.
Treasury yields steady, while a weaker USD provides an additional tailwind for gold prices.
Geopolitical tensions and central bank accumulation continue to underpin long-term bullish sentiment.
⚠ Risk: Liquidity sweeps remain a possibility ahead of next week’s Fed meeting—watch for false breakouts and sharp reversals.
🔑 Key Technical Levels (H1)
Immediate Resistance: 3,654.17 (React Zone FIB)
OBS Sell Zone: 3,664.52
Upper Liquidity Target: 3,679.31
Major Sell Liquidity: 3,709.85
Supports / Buy Liquidity Zones:
• 3,637.91 – Breakout Retest
• 3,631.63 – CP Support
• 3,622.41 – Deeper Liquidity Layer
• 3,584.78 – END Liquidity BUY ZONE
📈 Scenario & Outlook
London Session: Expect a retest of breakout zones (3,638–3,632) for liquidity collection before another potential leg higher.
A clean break through 3,654 → 3,664 could trigger fresh buying momentum toward 3,679–3,709.
Failure to hold 3,622 would expose deeper support at 3,584 as the next key level.
📌 Trading Plan
🔵 BUY ZONE 1: 3,635 – 3,633
SL: 3,629
TP: 3,640 → 3,645 → 3,650 → 3,660 → 3,670 → ???
🔵 BUY ZONE 2: 3,621 – 3,619
SL: 3,615
TP: 3,625 → 3,630 → 3,635 → 3,640 → 3,650 → 3,660 → ???
🔴 SELL ZONE: 3,708 – 3,710
SL: 3,715
TP: 3,704 → 3,700 → 3,695 → 3,690 → 3,680 → ???
🔴 SELL SCALP: 3,679 – 3,681
SL: 3,685
TP: 3,675 → 3,670 → 3,665 → 3,660 → ???
✅ Summary
Gold is holding its breakout above key levels, supported by softer US inflation data and a weaker USD. Liquidity sweeps may occur in the near term, but the broader trend remains bullish as long as 3,622 holds.
👉 Follow MMFLOW TRADING for real-time updates, liquidity scenarios, and BIGWIN trade setups as gold reacts to macro drivers and critical technical zones.
XAUUSD Trading Recap and RecommendationYesterday, we successfully went long at a low level, entering the market within the 3,600-3,620 range. Today, when the price moved up to 3,650, we executed the TP as planned and secured profits smoothly.
Today's Trading Advice: Buy on Pullbacks
Buy 3630 - 3640
TP 3650 - 3660 - 3670
Daily-updated accurate signals are at your disposal. If you run into any problems while trading, these signals serve as a reliable reference—don’t hesitate to use them! I truly hope they bring you significant assistance

Gold Trade Set Up Sep 12 2025www.tradingview.com
Gold is making HH/HL on the 1h but is trading in between two key levels, so i want to see a break close and retest of into a OB or supply/demand to get a clear direction

Gold SeLL NOW XAUUSD SELL @ 3650.5–3655.5
XAUUSD – Bearish Setup at 3650.5–3655.5 | Reversal Zone Play
Gold has entered a high-probability reversal zone between 3650.5–3655.5, aligning with the recent all-time high rejection zone and momentum exhaustion. Price action shows signs of a liquidity grab, followed by bearish divergence and fading volume—ideal conditions for a tactical short.
📌 Trade Parameters
- Entry Zone: 3650.5–3655.5
- Stop Loss: 3657.5 (above liquidity wick)
- Take Profit: 3646 (first support zone)
- Risk/Reward: ~3:1
📊 Technical Confluence
- Rejection from ATH PRZ (Potential Reversal Zone)
- Bearish divergence on RSI
- MACD histogram fading after parabolic move
- Volume drop on bullish candles
- Intraday structure shifting to lower highs
💬 Trade Narrative
Gold surged into the 3650+ zone but failed to hold, suggesting a false breakout and liquidity sweep. This setup targets a retracement toward 3646, with tight risk above 3657.5. If price breaks below 3649, expect acceleration toward deeper support zones.
Fundamentals remain volatile with CPI data and Fed rate expectations in play. This trade favors short-term tactical execution with disciplined risk control.
📣 Trader’s Note:
Watch for confirmation on lower timeframes (15M/1H). If price breaks below 3649 with volume, consider scaling in or trailing stop. Setup invalidated if bulls reclaim 3658+ with strength.

12/9/68 : XAUUSD ( US Session )Using it from US Session until 11.00AM , I'll new analysis and update at 12.00PM
Resistance
3667-3672
3657-3662
3652
Support
3641
3631-3636
3620-3626

3655 accurately shorted gold to seize the opportunity of declineGold fluctuated higher today, rising from 3630 all the way to 3657. However, after encountering resistance at this level during the European session, it ultimately retreated. The overall trend remains consistent with our previous analysis and strategy. Today's strategy is to short on rebounds around 3655, watching for pullbacks. The current low has been around 3637, resulting in a small short-term gain of approximately 150 pips. Congratulations to those who followed this strategy for a solid win! For those who are short-term traders, it's recommended to lock in profits or lower your stop-loss to avoid profit taking. For those holding medium-term positions, manage your positions appropriately and patiently await the next wave of opportunities. Following the trend and executing your plan are the keys to stable profits in the market.

European session sees retracement, US session hits new highGood morning, everyone. Although gold has rebounded at present, it has not effectively broken through and stabilized above the short-term resistance of 3655-3660. In the short term, this resistance range still exerts a certain pressure on the gold price, but this does not mean that we give up the judgment that gold may reach a new high.
First of all, looking at the daily gold chart, we can find that yesterday's daily line closed with a negative line, but gold did not fall but rebounded and rose. This is not only the impact of data, but also shows that the buying funds in the current market are very strong. As I told you before, big changes in the market will only occur after the Fed's interest rate cut basis point is clear next week.
But at the same time, brothers need to be clear that we should be alert to the false break of gold. Therefore, we can give a floating space of about $5, relying on 3655-3665 to see the short-term suppression. It may fall back when encountering resistance here in the European session. You can try to short with a light position. The short-term support should focus on 3645-3635 below. If it falls back and the support is not broken, gold will continue to rise. In particular, be alert that gold in the US market may rebound to a new high based on the support level. If the European session directly returns to the lower support, we can go long on gold first.

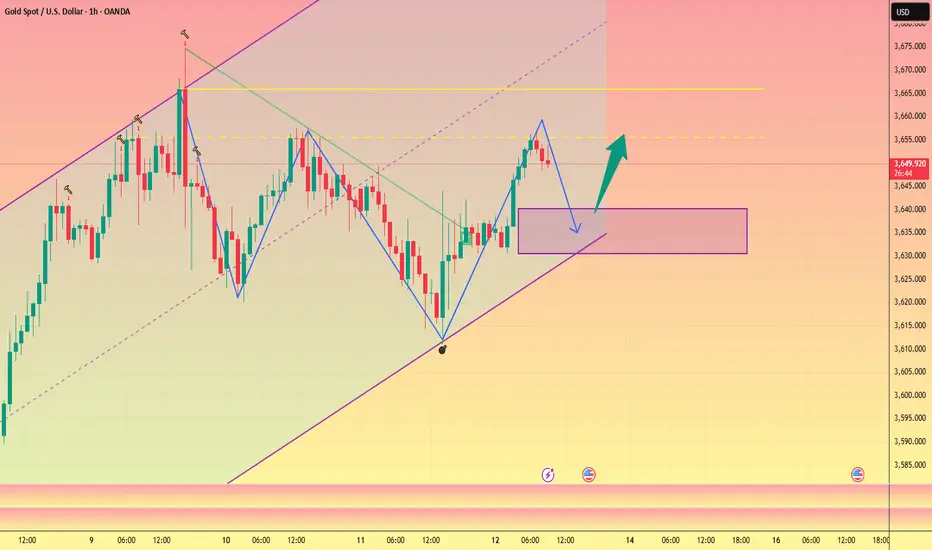
Gold Analysis – Is the Correction Over?Yesterday I maintained my bias that OANDA:XAUUSD correction could extend lower, with 3570 as the focus for the next swing low. I even sold rallies above 3640 zone with that scenario in mind.
However, after the CPI release, Gold dipped to 3620 zone but quickly recovered. That prompted me to lock in a modest 100 pips gain rather than fight the market.
A wise move in hindsight, since Gold is now back testing the 3650+ resistance zone.
So, is the correction finished?
➡️ Most probably, yes.
Here’s why:
• Bulls are defending the 3620 zone, stepping in strongly on dips.
• The chart is shaping into a rectangle, typically a continuation pattern, which suggests consolidation before trend resumption.
• Momentum is aligning again with the broader bullish trend.
Trading Plan:
• As long as 3620 holds, my strategy shifts to buying dips instead of selling rallies.
• A break above 3660 would open the path for continuation, with 3700 as the next bullish milestone.
The market has spoken – the correction seems to be losing steam, and the trend is ready to reassert itself. 🚀
Quiet Storm:Bulls vs Bears in Waiting!Under the influence of CPI and initial jobless claims data, gold rose directly to the area around 3644. The short-term rise seems exaggerated, but it did not stand firmly above 3650, and even failed to reach the intraday high of 3649. The release of bullish momentum was relatively convergent; it can be clearly seen from the short-term candlestick chart that gold showed long upper shadows many times in the short term, and the trajectory and structure began to shift downward, and tested support downward many times, which also proved that the short-selling force was gradually recovering after being suppressed.
However, gold rebounded after touching the 3620-3610 support area several times during the retracement. Although the bullish momentum has declined in the short term, the bullish structure has not been completely destroyed, so the overall structure is still controlled by the bulls, and the bullish force still has enough strength to support gold.
Overall, as the bulls become more cautious and the bears gradually recover, gold is expected to maintain high-level fluctuations in the short term, and the fluctuation range is likely to remain in the 3655-3615 area. Therefore, for short-term trading, we can strictly stick to the trading points and execute high-selling and low-buying transactions within the area.

Wait for new highs and go long on pullbacksA good day starts with profits, now let's analyze the trend of gold today.📊
Gold is currently consolidating around 3650, with 3655-3665 forming short-term resistance above. The 4H MACD indicator is correcting a top divergence. Having first touched this resistance level in the European session, gold may experience a pullback. 📉As the price of gold continues to rise, the short-term support also moves up. Pay attention to the short-term support area formed by 3640-3630. 🌈If gold retraces support and then rebounds above this resistance level, it could first reach 3675, or even reach a new high of 3690-3700, as we anticipated yesterday.🚀
Intraday operations are mainly long at low levels, supplemented by short at high levels, and participate in trading in key ranges.
Gold Set to Extend Gains as Fed Rate Cuts Loom📊 Market Developments:
Gold is supported by expectations that the Federal Reserve will cut interest rates, lowering the opportunity cost of holding bullion.
Recent U.S. labor market data showed weakness, with higher jobless claims and downward revisions in nonfarm payrolls.
CPI inflation remains elevated, while PPI softened slightly, reinforcing bets on policy easing.
A weaker U.S. dollar and lower Treasury yields further boost gold’s appeal.
📉 Technical Analysis:
• Key Resistance: $3,670 – $3,674, with further upside potential toward $3,700–$3,730.
• Nearest Support: $3,600; if broken, next levels at $3,561–$3,536.
• EMA: Price is trading above EMA50 and EMA200, keeping the bullish structure intact.
• Candlestick / Momentum: RSI remains elevated, showing strong upward momentum though slightly overbought; dips are being bought quickly.
📌 Outlook:
Gold may continue to rise in the short term if Fed maintains a dovish stance and U.S. data remain soft.
However, stronger-than-expected inflation or hawkish Fed signals could trigger a pullback toward $3,600 or lower.
________________________________________
💡 Suggested Trading Strategy:
• SELL XAU/USD: $3,682 – $3,685
🎯 TP: 40 / 80 / 200 pips
❌ SL: $3688
• BUY XAU/USD: $3,617 – $3,620
🎯 TP: 40 / 80 / 200 pips
❌ SL: $3614
