Gold Price Analysis (XAU/USD): Key Levels and Market OutlookThe price of Gold (XAU/USD) has shown strong upward momentum in recent sessions, crossing above the $3,600 mark and briefly touching the $3,674 level, which represents a strong bullish push supported by significant trading volume (over 581K at that peak).
Current Market Overview
Current Price: $3,646.74 (as of the latest 4H candle)
Resistance Level: $3,674 (recent swing high)
Support Level: $3,640 (recent pullback low)
RSI Indicator: Around mid-range (60), showing neither overbought nor oversold conditions.
The Zig Zag indicator highlights the recent correction after reaching $3,674, where the price retraced slightly to $3,640 before consolidating. The market now trades sideways between these two levels, indicating a short-term indecision.
1. Resistance Zone:
Gold needs to break and sustain above $3,674 to confirm the continuation of the bullish trend. If this happens, the next target could be around $3,700 – $3,750.
2. Support Zone:
On the downside, if the price fails to hold the $3,640 level, a deeper correction towards $3,600 – $3,550 cannot be ruled out.
3. Momentum Indicators:
The RSI is currently neutral, suggesting room for both upside and downside moves. Traders should watch for RSI crossing above 70 (bullish continuation) or dropping below 50 (bearish pressure).
Trading Strategy
Bullish Bias: If Gold holds above $3,640 and breaks $3,674, traders may look for long positions targeting $3,700 and above.
Bearish Bias: A break below $3,640 could trigger short positions, with downside targets near $3,600 and $3,550.
Conclusion
Gold remains in a bullish structure but faces short-term resistance at $3,674. Traders should watch closely for a breakout or breakdown from this consolidation range to determine the next major move.
Xauusdsignal

Gold Trade Set Up Sep 10 2025OANDA:XAUUSD
www.tradingview.com
Price is currently making LH/LL on the 1h so id want to see how price reacts at the current key level. If it hold and can make internal structure on the 5m i will look for buys back to PDH but if price closes under the key level on the 15m and retest it i will look for sells towards 4h FVG

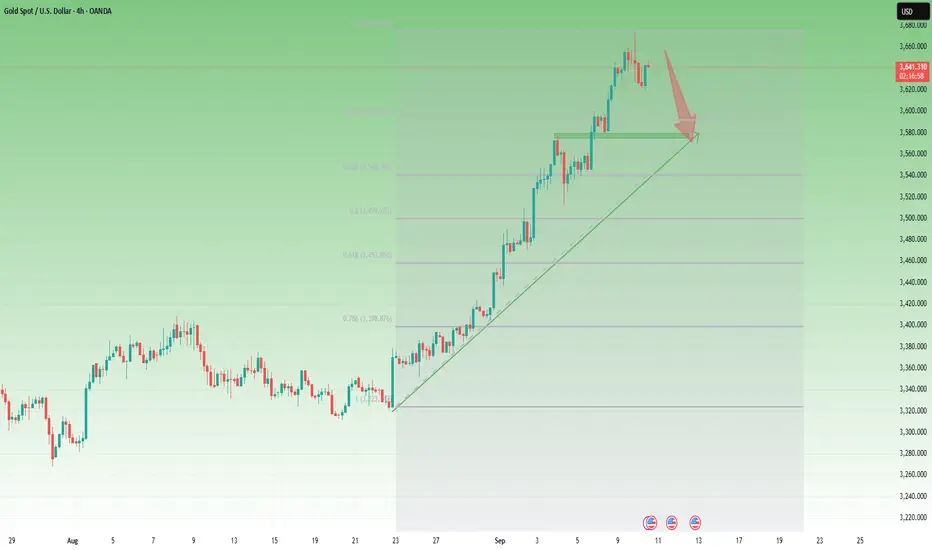
Gold Analysis – Correction Not Yet Over (IMO)Yesterday, after printing a new ATH at 3674, Gold sold off aggressively and overnight reached a low of 3620.
Now the key question: Is Gold done correcting?
👉 My answer: Not yet.
Here’s why:
1. The 550 pip drop from the top is barely scratching the surface compared to the 3500 pip rally in the last two weeks.
2. Yesterday’s daily candle is a bearish pin bar. While this pattern is weaker in strong uptrends, it can still trigger continuation.
3. Structurally, the market looks like it’s forming an ABC correction. The current rebound may be wave B, with wave C expected to target the 3570 zone.
4. Confluence supports act like magnets once corrections begin. The zone I’m watching aligns with the 23% Fibonacci retracement, which fits perfectly with the correction scenario.
📌 Trading Plan:
As long as 3675 holds, I remain bearish in the short term. The best strategy is to sell rallies against the ATH, targeting deeper retracement levels.
DeGRAM | GOLD rebounded from the support area📊 Technical Analysis
● XAU/USD staged a bullish takeover at 3,636 support, reclaiming the mid-range and establishing a higher low.
● Price is now pressing 3,650, with projections showing a push toward 3,654 before testing the 3,668–3,672 resistance area.
💡 Fundamental Analysis
● Gold demand is underpinned by cautious sentiment ahead of US CPI, while weaker dollar flows and ongoing geopolitical tensions enhance safe-haven appeal.
✨ Summary
Bullish above 3,646; targets 3,654 → 3,668. Invalidation on a close below 3,636.
-------------------
Share your opinion in the comments and support the idea with a like. Thanks for your support!

Pay attention to 3655,there will be callback if it doesn't break#XAUUSD OANDA:XAUUSD
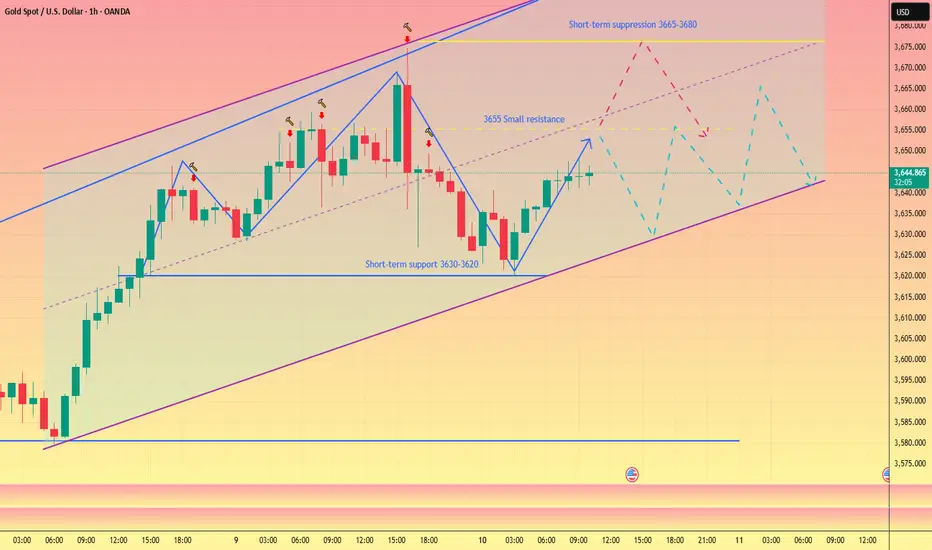
Gold tested the support level of 3630-3620 and stabilized before rebounding again, which is consistent with my previous judgment that gold must experience a correction if it wants to rise again.📉
In the short term, the market focus is still on the basis points of the Federal Reserve's interest rate cut to be announced next week. 💻Therefore, before clear data is released, the market is unlikely to experience significant fluctuations.📊
Although gold is currently fluctuating sideways around 3645,⚖️ in the short term, we should pay attention to the hourly moving average, which tends to stick together and move upward. 🌈Therefore, if gold falls back again in the short term to test the support level of 3630-3620 below, we can still consider going long. 🚀
On the upside, the first thing to watch is whether gold can effectively break through 3655. If it can effectively break through, it is expected to continue to test the short-term resistance range of 3665-3680. 📈Conversely, a failure to break above 3655 could lead to consolidation within a range.🐻
ANFIBO | I think XAUUSD on 09.10.2025 ???Trend is friend. Gold price today is still holding on the uptrend line and has not broken out yet. Today we only need to pay attention to the following important resistance and support zones:
>> SELL SCALP: 3700 - 3710, SL 3720, TP 3600 - 3570
>> BUY SCALP: 3620 - 3625, SL 3615, TP 3645 - 3700
>>> SWING BUY: 3560 - 3570, SL 3550, TP 3620 - 3675 - 3700 - OPEN
>>> SWING SELL: 3790 - 3801, SL 2820, TP 3700 - 3570 - 3450 - OPEN
Good luck guys!!!

10/9/68 : XAUUSD ( Europe / London Session )Using it from Europe Session until 7.00PM , I'll new analysis and update at 8.00PM
Resistance
3664-3669
3654-3659
3649
Support
3638
3628-3633
3617-3622

ANFIBO | I think XAUUSD on 09.09.2025 ???Currently, gold is moving within a clearly defined upward trend channel. Our strategy for today should focus on monitoring key resistance and support zones in order to identify potential entry points for both scalp trades and swing trades. The levels I consider noteworthy are as follows:
>> SELL SCALP: 3650 - 3660, SL 3670, TP 3600
>> BUY SCALP: 3598 - 3603, SL 3595, TP 3680 - 3690
>>> SWING BUY: 3560 - 3570, SL 3550, TP 3680 - 3690 - OPEN
>>> SWING SELL: 3790 - 3801, SL 2820, TP 3680 - 3570 - 3450 - OPEN
Have fun!!!

Gold - Buy or Sell this week??? (08-12/09)With the sustained accumulation over the past five months, gold has experienced a strong breakout from the $3,300 sideways range and reached a new all-time high around $3,600. The upward trend is clearly established. Therefore, we can consider buying and selling at the following price levels:
>>> SELL ZONE: 3684 - 3679
SL: 3689
TP: 3618 - 3596 - 3578 - 3565 - 3515
>>> BUY ZONE: 3560 - 3570
SL: 3550
TP: 3618 - 3678
Have a good day. Good luck buddies! :)

Gold Breaks $3,600/oz: Fed Rate Cut Hype & Trading Setups!Hello traders! Gold (XAU/USD) soared past $3,600/oz for the first time on Monday (08/09/2025), hitting a new all-time high as weak US jobs data cemented expectations for a Fed rate cut next week. With a 38% YTD surge following a 27% rally in 2024, gold’s unstoppable—driven by a weak USD, central bank buying, easing policies, and global uncertainty. Let’s break down today’s (09/09/2025) market and uncover trading setups! 💰
Fundamental Analysis: Why Gold’s Rally Keeps Charging? 🌟
Historic Surge: Weak US jobs data (August growth slowed, unemployment at 4.3%) has markets pricing in an 88% chance of a 0.25% rate cut and 12% for 0.5% in September, per CME FedWatch. Low rates make non-yielding gold shine! 📈
Expert Insight: Peter Grant from Zaner Metals predicts gold could hit $3,700–$3,730/oz short-term, with short pullbacks as buying opportunities. Ongoing labor market weakness and Fed easing into 2026 provide solid support.
Global Drivers: China’s central bank extended its gold-buying streak to 10 months in August. A falling USD and 10-year Treasury yields near a 5-month low boost gold’s allure.
Key Data Ahead: Watch US PPI (10/09) and CPI (11/09) for more Fed policy clues. Geopolitical and tariff tensions further fuel gold’s safe-haven appeal.
Gold’s red-hot—can it conquer new highs?
Technical Analysis: Breakout Mode with Traps—Prioritize BUY! 📉
Gold’s relentless rally smashed through 3600, showing no signs of slowing. Keep an eye on the Fibo 2.618 level at 3685 as a potential pause point. Strong bullish momentum favors BUY setups, but beware of FVG traps from rapid surges. Focus on 3641: a break below could trigger a pullback to 3600, while holding above keeps bulls in charge, targeting 3685.
Key Resistance: 3663 - 3673 - 3685 - 3690
Key Support: 3641 - 3629 - 3596 - 3581
Trading Opportunities:
Sell Scalp: 3673 - 3675
SL: 3679
TP: 3670 - 3665 - 3660 - 3655
Sell Zone: 3684 - 3686
SL: 3694
TP: 3676 - 3666 - 3656 - 3646 - Open
Buy Scalp: 3641 - 3639
SL: 3635
TP: 3644 - 3649 - 3654 - 3659
Buy Zone: 3605 - 3603
SL: 3595
TP: 3613 - 3623 - 3633 - 3643 - Open
Gold’s in breakout territory, but traps are lurking—wait for confirmations at key levels! If supports hold, bulls could charge to 3685. 📊💡
#Gold #XAUUSD #Fed #USJobs #TradingView #MarketUpdate #Forex #Investing #TechnicalAnalysis #GoldTrading #Finance #Crypto #CentralBanks
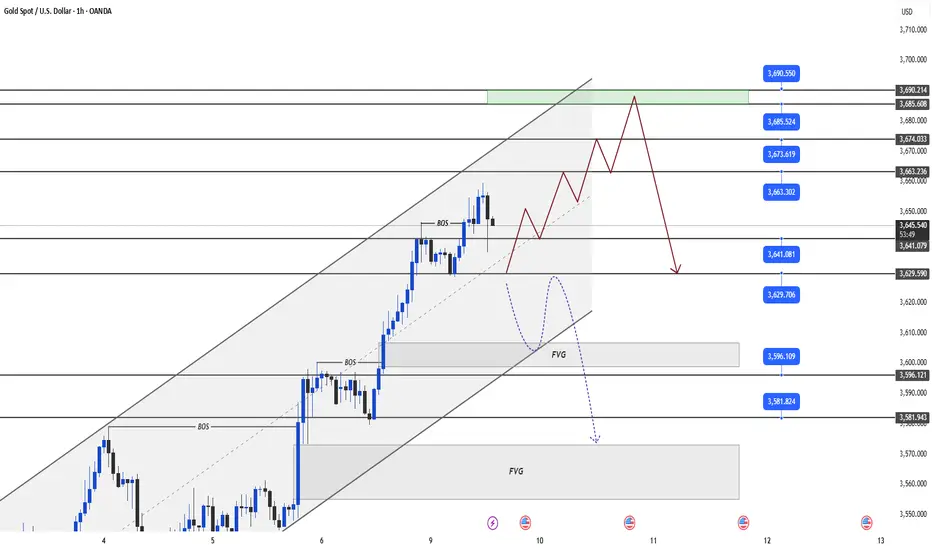
Gold Trade Set UpOANDA:XAUUSD
www.tradingview.com
price broke structure on the 30m and 15m to, retested the zone and pushing bearish. So i am targeting 4h FVG or lower key zone

9/10: Watch Support Around 3600Good morning everyone!
🔹 Key Support Levels
30M Chart: 3628 / 3614–3600
1H Chart: 3623 / 3608–3598
2H Chart: 3623 / 3589
4H Chart: 3606
1D Chart: 3598
🔹 Key Resistance Levels
3643 / 3668–3678
🔹 Intraday Strategy
Sell on rallies, buy on pullbacks at support
Yesterday, bullish data drove gold up to around 3673 before retreating. Technically, the market is now heavily overbought, but strong fundamentals keep fueling bullish sentiment. While chasing profits, don’t overlook the risks!
Today, focus on 3643–3658 resistance. If price fails to hold above, a pullback is likely. Key supports are at 3600, then 3589–3574 / 3558.

Buy Gold @3642.00 best trade of the day🟡 XAUUSD Buy Setup – Precision Scalping Idea
Trade Parameters:
- Entry: Buy @ 3642.00
- Stop Loss: 3638.00
- Take Profit 1: 3650.00
📊 Technical Justification
- Price is rebounding off minor intraday support near 3640, showing bullish momentum.
- Tight SL below recent wick lows minimizes downside exposure.
- TP1 targets a clean resistance zone from previous hourly highs.

XAUUSD – M30 Intraday Trading Plan | MMFLOW TRADINGMarket Pulse:
The US jobs report confirmed a clear slowdown in labour market growth. According to CME FedWatch, there is now an 88% probability the Fed cuts rates by 0.25% in September, and 12% for a 0.5% cut. Lower rates reduce the opportunity cost of holding gold – fuelling demand further.
Gold has already gained 38% YTD, after rising 27% in 2024. A weaker USD, aggressive central bank accumulation (led by China, which extended purchases for the 10th consecutive month in August), loose monetary policy, and rising global uncertainty continue to build a solid base for this bullish trend.
👉 Bottom line: Macro flows + liquidity both favour the BUY side.
Technical View (M30):
Price is respecting the ascending channel, printing higher lows.
3616–3596 is the structural support; only a breakdown here shifts the trend.
Liquidity clusters sit at 3653–3655 and 3675–3677, likely to trigger short-term SELL reactions before the broader uptrend resumes.
Execution Plan (Today):
🔵 BUY ZONE: 3618 – 3616
SL: 3610
TP: 3624 → 3630 → 3635 → 3640 → 3650 → 3660 → 3670+
🔵 BUY ZONE: 3598 – 3596
SL: 3590
TP: 3602 → 3606 → 3610 → 3615 → 3620 → 3630 → 3640 → 3650+
🔴 SELL ZONE: 3653 – 3655
SL: 3660
TP: 3648 → 3644 → 3640 → 3635 → 3630 → 3620
🔴 SELL ZONE: 3675 – 3677
SL: 3681
TP: 3670 → 3665 → 3660 → 3650 → 3640
Summary:
✅ Bigger picture: Bullish trend intact – look for buys off liquidity support zones.
⚡ Short-term: take quick SELLs around liquidity resistance for intraday setups.
👉 Follow MMFLOW TRADING for precision plans: BUY with structure, SELL with liquidity.

Gold Trade Set Up Sep 2025OANDA:XAUUSD
www.tradingview.com
Gold is still making HH/HL on the 1h so i am bullish. i will look for buys when price closes above HH and pulls back into a 5m-15m FVG

Cyclic Patterns Point to 600-Pip Downside in GoldUnfortunately, gold failed to reach the expected 3620 target area during the pullback. It only touched around 3628 in the early morning hours before rebounding again. During this period, because I saw that gold could not fall below 3628, and even could not fall below 3630 at one point, I promptly closed all short positions near 3630. Although the two transactions suffered losses due to the slightly lower entry price, because we added short positions near 3636 and 3646, the overall profit was still $10K.
Gold has now rebounded again and continued its upward trend to around 3657, continuing its upward trend. However, aside from opportunities to enter the long position in the 3630-3628 area, there are virtually no other good long entry opportunities. Judging from the current trend, gold still has the potential to continue to rise to around 3665, but since I missed the opportunity to enter the long position at 3630-3628, I will never choose to chase the rise of gold now.
Although the current uptrend is strong, even if you short gold, there are always opportunities to exit safely and profit during the day. Therefore, I still plan to try to short gold in the 3655-3665 area. Of course, keep my tips from yesterday in mind when shorting. When you first try shorting gold today, try to use a small lot size. When adding positions, you can appropriately increase the number of trading lots to increase the average price and increase profit margins. From a shorting perspective, it is relatively safer!
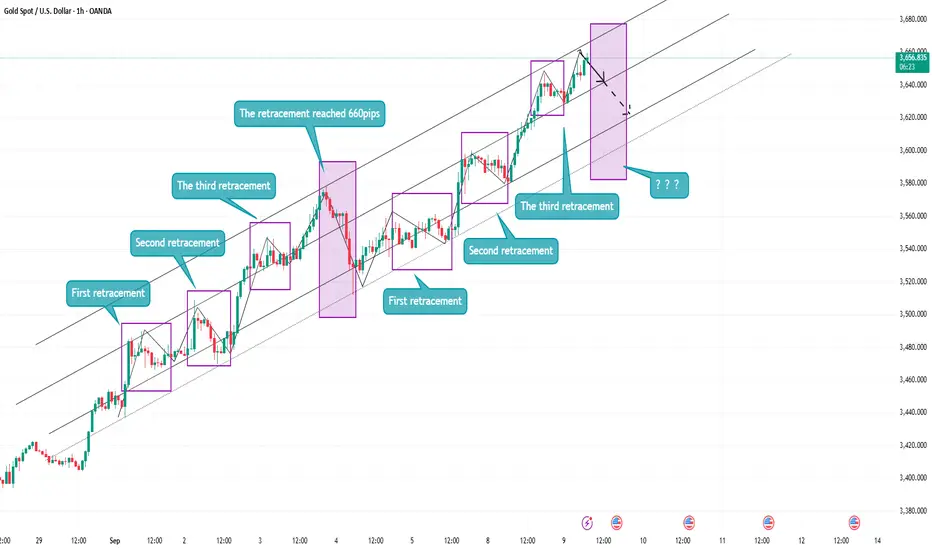
At present, I will pay close attention to the short-term support area of 3640-3630, followed by the area of 3610-3600. Don’t subjectively think that gold will not pull back to the 3610-3600 area, because in the previous band, after gold experienced three 200pips fluctuation retracements, the fourth retracement reached 660pips; and now gold has experienced three 200pips fluctuation retracements again. If it follows the cycle, gold may usher in another retracement of about 600pips, that is, reaching the 3610-3600 area.
xauusd buy now 3647 Absolutely, bontas. Here's a clean and professional breakdown of your XAUUSD buy setup for TradingView or any content platform:
🟡 XAUUSD Trade Idea – Buy Setup
- Entry: Buy @ 3647.00
- Stop Loss (SL): 3642.00
- Take Profit 1 (TP1): 3650.80
- Take Profit 2 (TP2): 3653.80
📊 Trade Rationale
- Price is reacting off a minor intraday support zone near 3645, showing bullish momentum.
- Tight SL below recent wick lows protects against false breakouts.
- TP1 aligns with short-term resistance; TP2 targets extended move toward fib extension zone.

9/9/68 : XAUUSD ( Europe / London Session )Using it from Europe Session until 7.00PM , I'll new analysis and update at 8.00PM
Resistance
3675-3680
3665-3670
3660
Support
3649
3638-3643
3628-3633

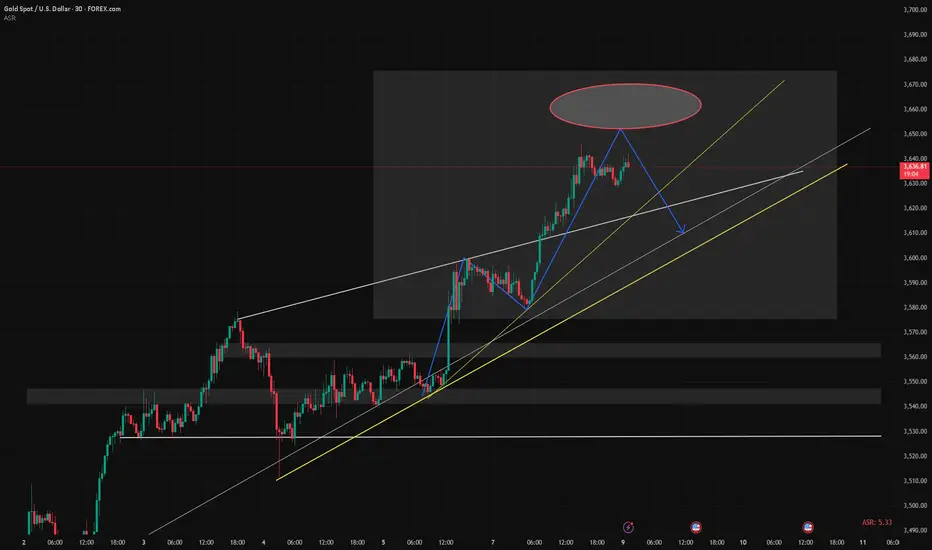
Scalping Sell Setup – Trendline Break & Pullback Confirmation📉 Scalping Sell Setup – Trendline Break & Pullback Confirmation
Posted earlier – trade progressing as planned.
As shared in the previous chart, a Sell scalp position was executed based on the trendline break followed by a pullback retest.
Three Take-Profit levels were marked and the price is moving in line with the forecast. ✅
🟢 TP1 Hit
🟢 TP2 Reached
🔵 TP3 in progress
📌 The setup remains valid, and as long as structure holds below the retested trendline, the bearish bias continues.
We will monitor price action near TP3 zone for final exit or trailing stop update.
> Analysis worked perfectly so far – let’s see if TP3 gets cleared soon. 🔍💥

Reverse Head & Shoulders Setup | Gold Spot | 15min | by Mohsen M
🔸 **Chart:** Gold Spot / USD (XAU/USD)
🔸 **Timeframe:** 15min
🔸 **Method:** Smart Money Concepts (SMC) + Pattern Recognition
🔸 **Focus:** Reverse H&S, Order Blocks, TLQ, BOS
---
## 🔍 Market Context:
- **Market Structure:** Bearish on higher TF
- **Short-Term Trend:** MSU (Market Structure Up)
- **Efficiency:** ✅ Confirmed — clean price delivery
- **Key Pattern:** Bullish **Inverse Head & Shoulders**
---
## 🧠 Technical Breakdown:
1. **Left Shoulder – Head – Right Shoulder** perfectly forming within a high-value demand zone
2. Price reacted strongly from **Order Block (OB)** + TLQ marked at the bottom wick (Head zone)
3. BOS confirms bullish attempt to shift structure
4. Anticipating neckline break at ~3345 level for further upside
5. Potential resistance and liquidity resting above 3400 (HH region)
---
## 📌 Trading Plan (Pre-London Open / Monday 1:30 AM UTC+3:30):
- **Entry Idea:**
Watch for bullish confirmation after price stabilizes above Right Shoulder zone (~3300–3320)
Or re-entry on a retest of neckline after breakout
- **Stop Loss:**
Below "Head" and OB zone (~3260)
- **Take Profits:**
- TP1: Neckline break zone (~3345)
- TP2: 3400 – Liquidity pool
- TP3: Final HH sweep (~3420+)
---
## ⚠️ Alternate Bearish Case:
> If price breaks below the "Head" zone and OB fails to hold,
> → Expect bearish continuation to the next liquidity zone near **VTA @ 3200**
---
## ✅ Summary:
This is a clean **bullish reversal setup** using SMC logic and a classic H&S pattern:
**OB + TLQ + BOS + Efficient Market + Clear Pattern ➝ High-Probability Setup**
Structure: 🟥 Bearish (macro)
Trend: 🔼 MSU (micro)
Efficiency: ✅ Efficient
Pattern: 🟩 Inverse Head & Shoulders
---
📊 Prepared by: **Mohsen Mozafari Nejad**

Gold - Intraday Long Setup (5M TF) | Smart Money + Elliott Struc# 🟢 Gold - Intraday Long Setup (5M TF) | Smart Money + Elliott Structure
**Pair:** Gold Spot / USD
**Timeframe:** 5M
**Session:** London / NY Overlap
**Type:** Intraday Long Idea
**Concepts:** Smart Money, Supply & Demand, Wave Analysis, SSL Confirmation
---
## 🔍 Market Context
The market is currently reacting inside a **key Demand Zone** on the 5-minute timeframe, following a strong bearish move during the London session. The structure suggests a corrective **ABC wave formation**, where the **(c) point** appears to be forming a potential higher low at demand.
- Point **(a)**: Marked the first impulse down
- Point **(b)**: Rejection at minor **Supply Zone**
- Point **(c)**: Retest of **POI at Demand**, showing signs of exhaustion in selling pressure
---
## 📈 Technical Confluences
- 🟦 **Demand Zone** active and respected
- 📏 Potential BOS (Break of Structure) upon break of the recent high
- 📊 **Vol %ile** = 83% → Above average participation
- ⚠️ Risk Level: High (tight structure, requires confirmation)
- 🧭 Entry Distance: Near
---
## 🔧 Indicators Status (SSL Hybrid)
| Indicator | Status |
|--------------------------|----------|
| SSL Channel | ✅ Bullish cross (supporting reversal)
| RSI (50) | ✅ Holding above midpoint
| MACD | ✅ Bullish crossover (early signal)
| BB Oscillator / HT / RQK | ❌ Still bearish (lagging)
---
## 🎯 Trade Idea
**Bias:** Long
**Trigger:** Break above **minor Supply** and formation of BOS
**Target Zones:**
1. **TP1:** 3,370
2. **TP2:** 3,378 (supply edge)
3. **TP3:** 3,385 (upper supply zone)
**SL:** Below point (c) @ **~3,357**
---
## 🧠 Notes
This setup is valid as long as price holds above the Demand Zone and confirms a bullish shift via BOS. Wait for clear confirmation before entering.
_This is an educational idea based on Smart Money + Elliott Wave principles – not financial advice._
---
#gold #smartmoney #supplydemand #elliottwave #sslhybrid #intraday #5mtf #tradingview

Gold still in bullish move Gold (XAUUSD) is trading around 3581, holding above the support trendline and new support area. Price recently reached the all-time high zone at 3611 and remains bullish while above 3531 support, with potential for further upside.

9/9: Expect a Main Pullback Today, Likely to Drop Below 3600🌅 Good morning everyone!
🔹 Key Support Levels
30M : 3632 / 3615–3598
1H : 3626 / 3614–3588
2H : 3608–3590 / 3560
4H : 3613–3598 / 3681–3664
1D : 3564 / 3507–3498
🔹 Key Resistance Levels
3650–3670
🔹 Intraday Trading Strategy
Sell on rallies, especially near 3650 and above
Buy on pullbacks at support, focus on the 1H support zones
Trade mainly in short-term swings, quick in and out, secure profits early
Yesterday, gold pulled back to around 3577 before rebounding strongly. Currently, the 30M chart shows a bullish alignment. In the short term, watch 3650 as a key resistance. If broken, price may extend to 3658–3670.
🎯 Overall Outlook: Buy the dips, sell the highs. Focus on key support and resistance levels, avoid holding positions too long.