GOLD (XAUUSD): Updated Support & Resistance Analysis
As a bull run continues on Gold,
here is my updated support and resistance analysis.
Resistance 1: 3645 - 3655 area based on 3650 psychological level
Resistance 2: 3695 - 3705 are based on 3700 psychological level
Support 1: 3559 - 3580 area
Support 2: 3511 - 3520 area
Support 3: 3489 - 3500 area
The price is now heading toward Resistance 1.
It looks like it will be reached soon.
❤️Please, support my work with like, thank you!❤️
I am part of Trade Nation's Influencer program and receive a monthly fee for using their TradingView charts in my analysis.
Xauusdsignal

Gold Trade Set Up Sep 8 2025OANDA:XAUUSD
www.tradingview.com
Price broke structure on the 15m then came down and formed MSS, came higher and formed a rejection block, tested 50% of the RB now im targeting equal lows/low range liquidity
But on the higher time frames we are still bullish so i want to see a pull back before going higher

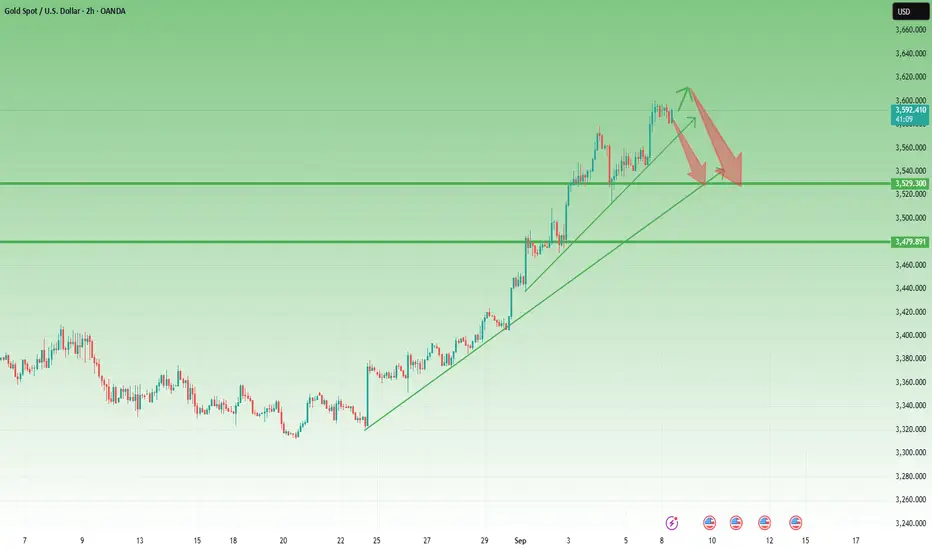
Fearless Bulls, Straight-Line Rise – But Mean Reversion CallsLast week Gold bulls were fearless – we witnessed three all-time highs within a single trading week. The market closed on Friday just below 3600, locking in an impressive 1,500 pips weekly gain. There is no doubt: the trend remains firmly bullish.
But let’s add some perspective. Even if XAUUSD were to drop 1,000 pips from current levels, that move would count as a minor correction within the dominant bullish trend. That’s how extended this rally has become.
📌 Another element supporting the correction scenario is the parabolic nature of the latest move. From the 3300 zone, the rally has been almost a straight vertical line, leaving gold strongly overextended and far away from the mean. Markets rarely sustain such deviation without at least a temporary pullback.
🔑 Trading Plan: While acknowledging the risks of counter-trend setups, I will look for short opportunities. In my view, there is more room to the downside than upside in the short term.
Target for correction: 3530 confluence support zone.
As always, the trend is still bullish, but corrections are part of the game. A disciplined trader must know when to step aside – and when to take the contrarian shot. 🚀
XAUUSD, EXPECTING SELL NOW FROM 3617XAUUSD, i am expecting sell from 3617 area, with the sl 36254. tp 3600, it can go till 3685 as well

Gold Roadmap | Short termGold ( OANDA:XAUUSD ) created a new All-Time High(ATH) almost every day this week.
How long do you think this upward trend in Gold will continue?
Reasons for Gold's upward trend this week:
Announcement of the US economic indexes.
Geopolitical issues that occurred in the world(China meeting, possible tension between Venezuela and the US, etc.)
Gold is currently moving between the Potential Reversal Zone(PRZ) and the Support zone($3,580-$3,572) .
In terms of Elliott Wave theory , Gold appears to be completing microwave 5 of the main wave 3 .
I expect Gold to start rising again from the Fibonacci levels and touch the Potential Reversal Zone(PRZ) .
Note: If Gold breaks the Support zone($3,580-$3,572) and Support lines, we can expect further declines.
Gold Analyze (XAUUSD), 15-minute time frame.
Be sure to follow the updated ideas.
Do not forget to put a Stop loss for your positions (For every position you want to open).
Please follow your strategy; this is just my idea, and I will gladly see your ideas in this post.
Please do not forget the ✅ ' like ' ✅ button 🙏😊 & Share it with your friends; thanks, and Trade safe.

XAUUSD Analysis todayHello traders, this is a complete multiple timeframe analysis of this pair. We see could find significant trading opportunities as per analysis upon price action confirmation we may take this trade. Smash the like button if you find value in this analysis and drop a comment if you have any questions or let me know which pair to cover in my next analysis.

Gold Soars 37% YTD: Fed Cuts, Jobs Woes & Trade Setups!Hello traders! Gold (XAU/USD) has surged 37% from the start of 2025, following a 27% rally in 2024 – fueled by a weakening USD, central bank buying, easing monetary policies, and broader economic/geopolitical uncertainty. With US jobs growth slowing sharply in August 2025 and unemployment rising to 4.3%, markets are heavily betting on Fed rate cuts: 90% chance of 0.25% and 10% for 0.5% in September. Let's analyze today's (08/09/2025) volatile market and spot trading opportunities! 💰
Fundamental Analysis: Why Gold's Rally Isn't Slowing Down? 🌟
Impressive Growth: Gold is thriving in a low-rate environment amid uncertainty – non-yielding assets like this shine when rates drop and risks rise! 📈
US Jobs Factor: August data confirms a cooling labor market, bolstering Fed easing expectations and safe-haven demand.
Fed Independence Drama: Trump's pressure to oust Governor Lisa Cook and push for rate cuts has triggered legal disputes, eroding USD confidence and elevating gold as a hedge against Fed interference. Standard Chartered forecasts more upside from tariff tensions and central bank concerns.
Global Demand Slowdown: Top consumers China and India saw physical gold demand ease this week due to record prices – but overall sentiment stays bullish.
Gold is the ultimate safe haven in this volatile setup – will the Fed deliver the cuts the market craves?
Technical Analysis: Breakouts & Liquidity Sweeps – Avoid FOMO! 📉
In the early Asian session today, gold dipped to the 358x zone before a quick rebound, breaking last week's ATH resistance at 3600 and advancing to 361x. No major news drove this surge, but continuous ATHs signal rapid liquidity sweeps – watch for traps! Avoid FOMO: Target broken round levels for BUY opportunities, or structure breaks at round numbers for SELL, but be cautious of fakeouts.
Key Resistance: 3614 - 3624 - 3634 - 3644
Key Support: 3597 - 3581 - 3574 - 3566 - 3560 - 3550
Trading Opportunities:
Sell Scalp: 3624 - 3626
SL: 3630
TP: 3621 - 3616 - 3611 - 3606
Sell Zone: 3634 - 3636
SL: 3644
TP: 3626 - 3616 - 3606 - 3596
Buy Scalp: 3596 - 3594
SL: 3591
TP: 3599 - 3604 - 3609 - 3614
Buy Zone: 3581 - 3579
SL: 3571
TP: 3589 - 3599 - 3609 - 3619
Gold is in breakout mode, but traps lurk – wait for confirmations at key levels! If supports hold, bulls could target new highs. 📊💡
#Gold #XAUUSD #Fed #USJobs #TradingView #MarketUpdate #Forex #Investing #TechnicalAnalysis #GoldTrading #Finance #Crypto #Trump #CentralBanks

XAUUSD Overextended: Waiting for Retrace & BoS Before LongsAt the moment, Gold is in a very strong bullish trend 🟢📈, pushing into all-time highs 🏆. However, price is now trading in an area of very thin liquidity 💧⚠️, which carries the risk of a potential pullback 🔻 as smart money 💼 looks to tap into liquidity pools from previous levels to position long.
🔎 In the video, we break down:
Price action 📊
Market structure 🧩
Some Wyckoff concepts 📚
My thoughts on trading when the market is overextended 🚀⚠️
💡 Remember: we don’t want to buy at a premium ❌💰. The better play is to wait for a meaningful pullback ⏳ and a market structure break 🔓 before looking for long opportunities.
⚠️ This analysis is educational and not financial advice. 📚

9/8: Watch Resistance at 3594–3600, Support at 3560–3556Good morning everyone!
🔹 Key Support Levels
30M Chart: 3573–3562
1H Chart: 3571 / 3563–3556
2H Chart: 3573 / 3560–3556 / 3528
1D Chart: 3564 / 3507–3498
🔹 Key Resistance Levels
3594–3600 / 3608–3621
🔹 Intraday Trading Strategy
Sell on rallies; consider buying on pullbacks to support.
Last week, gold extended its upward trend, testing the 3600 area for the first time, supported by NFP data. Overall performance was moderate. The main reason was a conservative approach — focusing more on selling at resistance while cautiously buying on dips, which resulted in missing two major rallies. The profits captured from retracements were relatively small compared to the strong upward moves.
The current rally has been driven largely by expectations of a Fed rate cut. However, this bullish factor now appears to be largely priced in, with gold technically in overbought territory. In the short term, risk management is crucial: avoid chasing prices at historical highs. A safer strategy remains buying on pullbacks, which may be less aggressive but significantly reduces downside risks. Ultimately, the choice of strategy depends on individual trading styles.

Gold Technical Analysis (XAU/USD# Gold Technical Analysis (XAU/USD)
On the 30M chart, several important factors suggest a potential correction:
1️⃣ The **Green Trendline** has been broken, with the key level at **3471**.
2️⃣ A possible **Retracement of the bullish leg** is aligned around the **3480 zone**.
3️⃣ The **Inducement structure** also confirms this corrective scenario.
🔻 With these confluences, the probability of a pullback towards the **3480 region** increases, marking it as a critical demand/retracement area.
---
📉 **Trade Idea (Educational):**
- **Entry:** 3585
- **Take Profit 1:** 3575
- **Take Profit 2:** 3555
- **Take Profit 3:** 3525
---
📊 **Key Levels to Watch:**
- 3471 (broken trendline)
- 3480 (retracement target)
- 3323 (deeper correction zone)
⚠️ This outlook and trade idea are for educational purposes only, not financial advice.

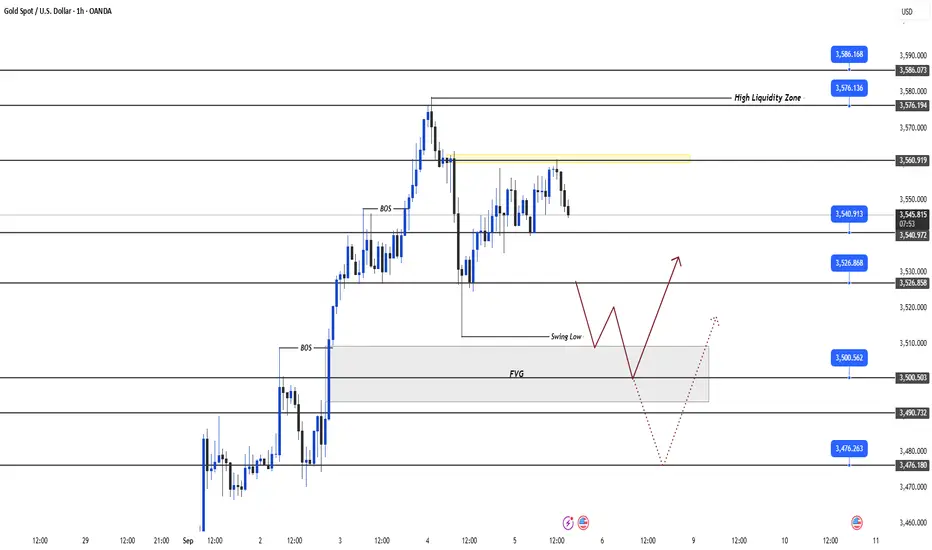
Gold hourly outlookHello, good day,
1H timeframe and personal outlook along with invalidation levels:
The structure is still bullish; we are at the liquidity high, and the 1H buyers’ TP has not yet been touched. (As long as the 1H candle does not close and confirm below 3548, the defined TP for 1H buyers will remain 3606).
Therefore, it can be assumed that from the marked breaker block zone, or with a slight hunt around the 3553 area, a buy trigger could appear for a liquidity grab at the high.
For the invalidation condition: if the 1H candle comes from any of these three support zones toward the high, it should not close above 3600–3606. If it only hunts liquidity, then we can consider the continuation of the move down to the internal liquidity hunt (internal choch). From there, one could again look for a buy trigger, with the 3503 level under the internal choch acting as support.
Personally, I’m watching the breaker block, 3553, and 3543 for buys at the beginning of next week to see how the market reacts to the high

Gold Targets $3,600 After Strong BreakoutAnalysis:
Gold (XAU/USD) continues its bullish rally after breaking above the buy zone near $3,440 and holding strong momentum. The market has recently made higher highs, with price consolidating slightly below the resistance zone.
Currently, gold is trading at $3,548, with the short-term target identified at $3,600. The chart suggests potential consolidation in the highlighted area before another upward push. The SMA (9) at $3,552 is acting as dynamic support, keeping the bullish bias intact.
If buyers maintain control, a clear breakout above $3,552 – $3,560 could confirm a move toward $3,600 – $3,604. However, if momentum weakens, support lies at $3,511 and $3,499, with a deeper pullback possible toward the $3,440 buy zone.
Overall, the sentiment remains bullish, and gold looks positioned to test the $3,600 psychological resistance in the near term.

XAUUSD Forming Ascending TriangleXAUUSD has successfully broken above the strong consolidation zone around 3440–3480, confirming a bullish breakout from the ascending triangle structure. This breakout signals strong momentum, as price has been building higher lows for months and finally cleared resistance with aggressive buying. The current level around 3596 shows bullish continuation with buyers in control.
From a fundamental perspective, gold is gaining support as US dollar strength eases and investors anticipate potential rate cuts from the Federal Reserve later this year. Increasing geopolitical tensions and rising demand for safe-haven assets are also fueling bullish sentiment. Market expectations of lower yields continue to drive capital flows into precious metals, reinforcing this breakout setup.
The technical structure highlights that as long as price sustains above the broken resistance zone, we can expect momentum to push toward 3700–3800 levels in the coming weeks. The bullish candle structure and clean breakout signal confirm strong institutional buying. Traders should monitor pullbacks to support zones as potential re-entry opportunities.
Overall, gold remains one of the most attractive assets in current market conditions. With both technical and fundamental factors aligned, this breakout on the 12H chart offers a high-probability continuation setup. Maintaining proper risk management remains essential as volatility could increase around economic releases.

XAUUSD – Gold Trading Plan Before NFP | MMFLOW TRADINGGold (XAUUSD) has been consolidating in a sideway range (355x–354x) after several days of sharp gains. Yesterday, price reacted strongly at the 357x liquidity zone, triggering a short-term correction before stabilising back into balance.
Now, the market is narrowing its range while waiting for the Non-Farm Payrolls (NFP) release later today — the key driver that will likely set the next directional move.
📊 Macro Context
If NFP comes in better than expected, Gold could extend its correction lower, filling liquidity gaps towards 352x – 350x before offering fresh long opportunities.
If NFP data disappoints, Gold may break ATH (357x) and push higher toward the next liquidity & FIBO extension levels near 3594+.
🔑 Key Resistance Levels
3560 – 3576 - 3594
🔑 Key Support Levels
3540 - 3528 – 3514 - 3502 – 3488 – 3478
📌 Trade Setups (MMFLOW Trading Plan)
🔵 BUY Zone: 3488 – 3486
🔴 SL: 3480
✔️ TP: 3492 – 3496 – 3500 – 3510 – 3520 – 3530 – 3540 – ????
🔵 BUY Scalp: 3528 – 3526
🔴 SL: 3520
✔️ TP: 3532 – 3536 – 3540 – 3550 – 3560 – ????
🔴 SELL Scalp: 3574 – 3576
🔴 SL: 3580
✔️ TP: 3570 – 3565 – 3560 – 3550 – 3540 – 3530 – ????
🔴 SELL Zone: 3593 – 3595
🔴 SL: 3600
✔️ TP: 3588 – 3584 – 3580 – 3570 – 3560 – 3550 – ????
📊 MMFLOW Trading View:
Gold is sideway ahead of NFP, and today’s breakout from the 3540–3565 range will decide the next major move. Liquidity remains key — watch how price reacts at 3515–3528 on the downside or 3576–3595 on the upside.

Gold Price Analysis (XAUUSD 4H): Bulls Eye $3,600 but ResistanceGold has continued its impressive rally, pushing higher on the 4-hour timeframe and reaching the $3,587 zone. With momentum on the bulls’ side, the big question remains: Can XAUUSD break above the $3,600 resistance, or is a pullback on the horizon?
The 4-hour chart shows a clear uptrend, with price action forming higher highs and higher lows. The recent surge took gold from the $3,250 level all the way to nearly $3,600, a gain of more than $300 within weeks.
This bullish momentum is supported by strong buying volume, indicating that traders continue to see gold as a safe-haven asset in the current global environment.
Key Technical Levels
Resistance Zone: $3,600 – $3,620
Support Zone: $3,500 – $3,520
Next Upside Target: $3,700 and $3,750 if resistance breaks
Potential Downside Target: $3,520 if price fails to sustain above $3,550
RSI Indicator
The Relative Strength Index (RSI) is trading near the 70 level, signaling that gold is approaching the overbought territory. While this confirms strong bullish momentum, it also raises the likelihood of a short-term correction or consolidation before the next big move.
Market Sentiment
Currently, gold is at a critical juncture. Buyers are attempting to break the $3,600 barrier, but selling pressure has been visible with upper candle wicks forming near this level.
A decisive breakout above $3,600 could open the path toward $3,700+.
A rejection from resistance may trigger a pullback toward $3,520–$3,500 support.
Trading Outlook
For swing traders, the strategy remains straightforward:
Bullish Bias: Stay long as long as price holds above $3,500. Watch for confirmation above $3,600 to target $3,700 – $3,750.
Bearish Bias: Short-term traders may look for pullback opportunities if price fails to hold above $3,550, aiming for $3,520 support.
Conclusion
Gold (XAUUSD) remains firmly in a bullish trend, but immediate resistance near $3,600 could determine the next move. Traders should closely monitor price action around this key level—either a breakout to new highs or a pullback to reset momentum.
✨ Gold’s next move could set the tone for September trading. Stay alert and manage risk carefully.

Gold Trade Set Up Sep 5 2025OANDA:XAUUSD
www.tradingview.com
Price has created a new ATH again due to NFP and is making HH/HL so i want to see a pullback and test of 15m FVG before a continuation higher

XAUUSD HIGH PROBABILITY SETUPS SOON!!!🚨 XAUUSD HIGH PROBABILITY SETUPS 🚨
* Here We Can See Clearly The Next Potential Moves For GOLD Coming Hours/Days.
* Keep Your Eyes Close On Your Trading Positions.
* Happy PIP Hunting Traders.
£ FXKILLA £

DeGRAM | GOLD is correcting📊 Technical Analysis
● XAU/USD failed to sustain above 3,558 after a brief breakout, with rejection confirming resistance and signaling renewed bearish pressure.
● The ascending wedge structure broke to the downside, and a retest of 3,550 could lead to a drop toward supports at 3,540 and 3,527.
💡 Fundamental Analysis
● Renewed strength in the US dollar, supported by firm Treasury yields and cautious Fed rhetoric, is weighing on gold, limiting upside momentum.
✨ Summary
Bearish below 3,558; targets 3,540 → 3,527. Invalidation on a close above 3,560.
-------------------
Share your opinion in the comments and support the idea with a like. Thanks for your support!

Gold Dips Post-Record: Trade Fed Drama & US Jobs Data!Hello traders! Gold (XAU/USD) pulled back on Thursday (04/09/2025) as investors took profits after its record-breaking rally, with focus now shifting to the upcoming US jobs report for fresh signals on the Fed’s policy path. Spot gold closed down 0.3% at $3,547.68/oz—is this a buying dip or a reversal? Let’s dive in and uncover trading setups! 💰
Fundamental Analysis: What’s Behind Gold’s Dip & Potential Rebound? 🌟
Profit-Taking Post-Record: Gold eased after hitting an all-time high of $3,578.50/oz on 03/09, driven by weak job openings data that bolstered rate cut bets and ongoing uncertainty fueling safe-haven demand. 📉
US Jobs Report Looms: Set for release tomorrow (05/09), this key report follows early-session data showing US jobless claims rising more than expected last week, signaling a softening labor market.
Fed Signals & Rate Cut Buzz: Several Fed officials on 03/09 highlighted labor market concerns, reinforcing confidence in rate cuts. Markets now see a 98% chance of a 0.25% rate cut this month, per CME FedWatch. As a non-yielding asset, gold thrives in low-rate and uncertain environments! 🏦
Fed Drama Heats Up: Trump’s attempt to fire Fed Governor Lisa Cook has sparked a serious legal challenge, raising fresh concerns about Fed independence. Coupled with tariff tensions (Trump’s appealing to the Supreme Court after two lower court losses), this is eroding USD asset confidence and boosting gold demand.
Bullish Outlook: Standard Chartered predicts further gains, citing persistent tariff uncertainty and Fed independence fears as key safe-haven drivers.
Technical Analysis: Consolidation Before Big Data—Buy Dips or Wait? 📉
Gold has been trading in an uptrend channel, with early-session accumulation. After a strong Asian session push, it hit the 356x OB zone and dropped quickly. The European session may see sideways action, awaiting tonight’s critical data. If gold holds the channel, bulls could take charge—watch for breakouts!
Key Resistance: 3560 - 3576 - 3586
Key Support: 3540 - 3526 - 3500 - 3490 - 3476
Trading Opportunities:
Sell Scalp: 3558 - 3560
SL: 3564
TP: 3555 - 3545 - 3535
Sell Zone: 3576 - 3578
SL: 3587
TP: 3568 - 3558 - 3548 - 3538
Buy Scalp: 3526 - 3524
SL: 3520
TP: 3529 - 3539 - 3549
Buy Zone: 3500 - 3498
SL: 3490
TP: 3508 - 3518 - 3518 - 3538
Gold’s in consolidation mode, but the jobs report could trigger a breakout—manage risk tightly! If it holds above supports, bulls may push for new highs post-data. 📊💡
#Gold #XAUUSD #Fed #USJobs #TradingView #MarketUpdate #Forex #Investing #TechnicalAnalysis #GoldTrading #Finance #Crypto
Gold Hits Record Highs: Trade Fed Drama & Jobs Data!Fundamental Analysis: Why Gold Keeps Rising? 🌟
New Record Highs: Gold hit an all-time high before US jobs data revealed a sharper-than-expected drop in July 2025 job openings and moderate hiring, signaling a loosening labor market. This weakness boosted gold, with the next target at $3,600/oz. 📈
Fed Rate Cut Odds Soar: Post-data, the market raised the probability of a 0.25% rate cut at the Sept 16-17 meeting from 92% to 98%, per CME FedWatch. Fed Governor Christopher Waller emphasized the need for a cut this month, with the pace depending on economic developments. 🏦
Upcoming Data in Focus: Investors are eyeing ADP employment and unemployment claims today (04/09), plus the official payrolls report on 05/09—these could shape Fed actions and gold’s trajectory.
Fed Drama Intensifies: On Sept 3, Governor Lisa Cook detailed her opposition to Trump’s attempt to fire her, while Trump has repeatedly criticized Chair Jerome Powell for not cutting rates this year. Concerns over Fed independence are eroding confidence in USD assets, driving investors to gold. Trump is set to appeal tariffs to the Supreme Court after two lower court losses. ⚖️🇺🇸
Gold’s Ideal Environment: As a non-yielding asset, gold thrives in uncertainty and low-rate settings—perfect for the current landscape!
Technical Analysis: Strong Uptrend, Prioritize BUY but Watch for Pullbacks! 📉
After the Asian open, gold dipped sharply to the 351x zone before rebounding quickly above 352x. This may reflect institutions dumping to capture retail liquidity—a common move during continuous ATHs that leave large FVGs. Prioritize BUY if gold holds above 352x, but if it fails to break 365x today, consider a SELL reversal, especially with ADP Nonfarm data looming. Stay cautious for volatility!
Key Resistance: 3545 - 3561 - 3578 - 3586 - 3596
Key Support: 3521 - 3508 - 3493 - 3475
Trading Opportunities:
Sell Scalp: 3560-3562
SL: 3566
TP: 3557 - 3552 - 3547
Sell Zone: 3594 - 3596
SL: 3604
TP: 3586 - 3576 - 3566 - 3566 - 3546
Buy Scalp: 3508 - 3506
SL: 3502
TP: 3511 - 3516 - 3521
Buy Zone: 3493 - 3491
SL: 3483
TP: 3501 - 3511 - 3521 - 3531 - Open
Gold is red-hot, but today’s data could spark volatility—manage risk tightly! If it holds above 352x, bulls could push to new highs. 📊💡
#Gold #XAUUSD #Fed #Trump #TradingView #MarketUpdate #Forex #Investing #TechnicalAnalysis #GoldTrading #Finance #Crypto

XAUUSD Analysis – Buyers Keep Stepping InIn yesterday’s analysis, I mentioned that Gold looked overstretched, with high chances of a continuation of the correction after the recent 3579 ATH.
During the day, price rejected my selling zone twice, and once more overnight. However, buyers kept stepping in, forming higher lows and pushing price back toward the 3560 resistance zone. This behavior signals upward pressure.
If this resistance finally breaks, the probability of seeing yet another ATH towards 3600 increases significantly.
For now, I’m out of the market, with but looking to buy if buying pressure persists

5/9/68 : XAUUSD ( Europe / London Session )Using it from Europe Session until 7.00PM , I'll new analysis and update at 8.00PM
Resistance
3580-3585
3570-3575
3564
Support
3554
3544-3549
3534-3539

Rebound or Trap? Why I’m Selling RalliesYesterday’s Move
After printing a fresh ATH, profit-taking started late in the New York session. This was followed by stronger selling pressure during the Asian hours, which dragged the price overnight down to 3510. Currently, we see a rebound, with price trading around 3530.
Key Question
Is this rebound the start of a recovery—or just a pause before another leg down?
Why I Expect the Correction to Continue
- The market sold off 650 pips from the new ATH, confirming a local top.
- Momentum becomes fragile after 2k pips rise in just 10 days
- Selling pressure could easily return, especially if buyers struggle to hold above 3550.
Trading Plan
I’ll be looking to sell rallies against the recent top, targeting first the 3500 psychological level, and then the 3470 technical confluence support.
