𝐌𝐓𝐗 | Buy-Side Sweet Spot in Gold’s Correction📌 From previous analysis:
• We anticipated corrective pullbacks and highlighted reversal zones.
• Focus was on 436–432 as the first critical support/resistance area.
⸻
1️⃣ Key Reversal Levels
There’s two scenarios in this rally:
A)
• 436 – 432 → First potential bullish reversal zone.
• 4H close above 435 → upside continuation toward 442 → 447 → 452.
B)
• 4H close below 432 → decline into 420.
• 420 – 415 is the strongest weekly demand zone (high-probability bullish bounce).
⸻
2️⃣ Continues Bullish Scenario
• 4H close above 454 → opens the way to 467.
• Stabilization above 467 → next major upside target 484.
✴️Plus Tip:
Daily closes above 420-415 zone supports the bullish momentum.
⸻
⚖️ Summary:
Gold is starting the month at a decisive zone (436–432). Holding above 435 favors further upside toward 452, while losing 432 puts the strong 420–415 demand zone into play. A confirmed breakout above 454 could accelerate the rally toward 484.
Xauusdsignal

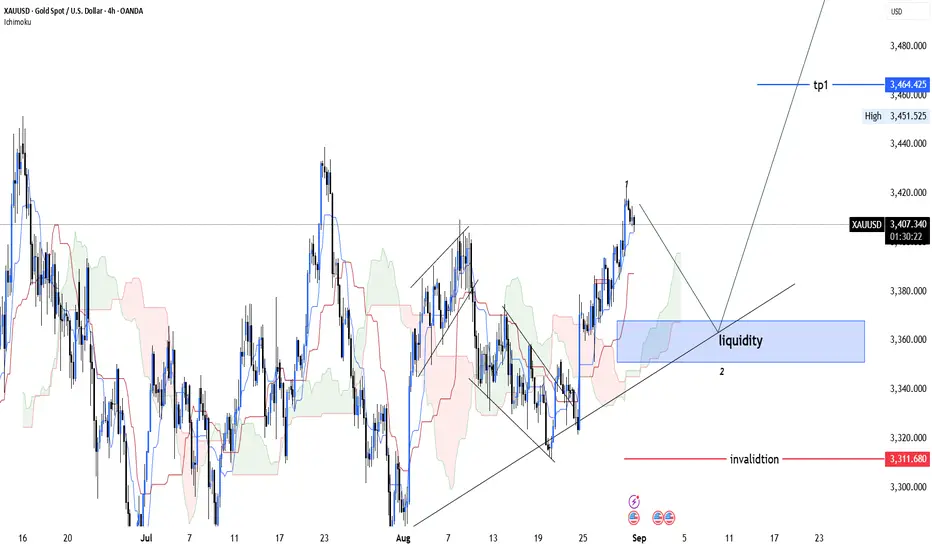
Gold (XAU/USD) – 4H AnalysisGold (XAU/USD) – 4H Analysis
🔹 Key Structure
If price respects the white line at point c, a potential Head & Shoulders formation may develop, signaling a possible bearish reversal.
However, if the orange dynamic line acts as a liquidity-driven trendline, then price could follow the red projection, pushing the market higher toward ATH (All-Time High) levels.
---
🔹 Break of Descending Trendline
On Friday, the descending resistance line was broken to the upside.
This break could be interpreted as a fake breakout if the market fails to hold above it.
For confirmation of a true breakout, we need to see continuation and acceptance above the broken trendline.
---
🔹 Bearish Scenario (Head & Shoulders Valid)
If the c-leg completes and rejects the white line:
Expect a Head & Shoulders pattern.
Price may retrace toward 3,360 → 3,344.
A close below 3,344 would strengthen bearish continuation.
---
🔹 Bullish Scenario (Liquidity Trendline Active)
If the orange liquidity trendline holds, buyers may push price higher.
Breaking above 3,420 – 3,446 with strength could target ATH extension zone above 3,500.
---
🔹 Trading Plan
Wait for confirmation: Avoid premature entries as current breakout might be fake.
Bearish bias: Valid if rejection occurs at point c with H&S pattern confirmation.
Bullish bias: Valid if orange line holds as liquidity dynamic and price sustains above 3,420.
---
✅ Bias: Neutral → Waiting for confirmation (H&S vs Liquidity Push)
🎯 Key Levels: 3,344 (bearish confirmation) / 3,420–3,446 (bullish breakout)
❌ Invalidation: Strong close above ATH zone

GOLD H4 MAPPING Hello Welcome To Our Page !
Where Gold Will Go ?
Gold Reached The New ATH Of The Month
Gold Have A Strong Resistance So Expecting Bearish Move On Gold
Then Buy From Order Block And Some FVGS
Hope You Understand Follow Is For More Trades

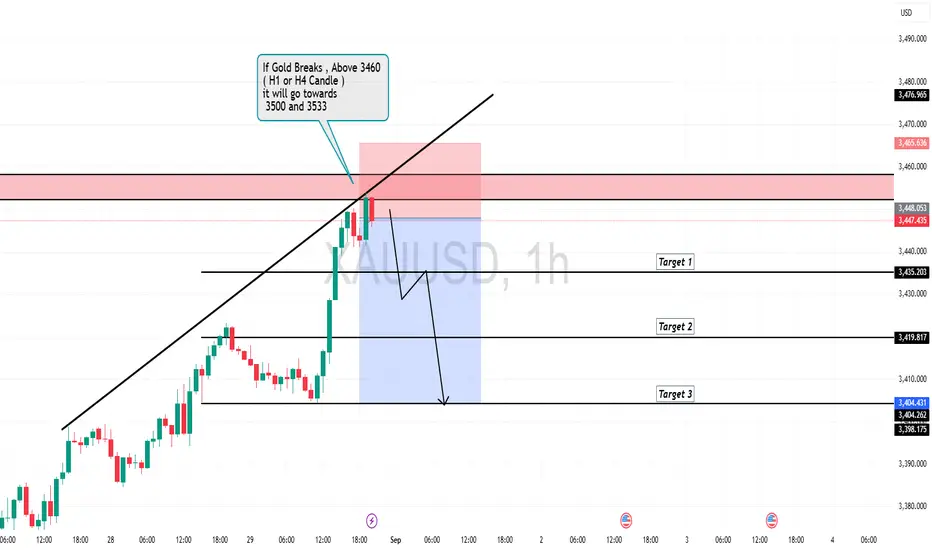
XAUUSD Analysis Today Hello traders, this is a complete multiple timeframe analysis of this pair. We see could find significant trading opportunities as per analysis upon price action confirmation we may take this trade. Smash the like button if you find value in this analysis and drop a comment if you have any questions or let me know which pair to cover in my next analysis.

Gold🔸Last week, the price continued its upward trend by hitting our first entry point and rejected the expected ranges.
🔹Now the price is at an important point on the 4-hour chart and since it could not close above the price of 3451.62, there is a possibility of a price reversal.
🔸If the 3451.62 break is confirmed, the new demand ranges are suitable for buying.
🔹If the price closes below the 3404 range, the trend is down and we can sell on pullbacks.

Gold is in the Bearish Direction after Retesting ResistanceHello Traders
In This Chart GOLD HOURLY Forex Forecast By FOREX PLANET
today Gold analysis 👆
🟢This Chart includes_ (GOLD market update)
🟢What is The Next Opportunity on GOLD Market
🟢how to Enter to the Valid Entry With Assurance Profit
This CHART is For Trader's that Want to Improve Their Technical Analysis Skills and Their Trading By Understanding How To Analyze The Market Using Multiple Timeframes and Understanding The Bigger Picture on the Charts
GOLD XAUUSD - Pullback Expected before the Next Leg UpGold (XAUUSD) has been on a solid bullish run, consistently pushing higher after each minor retracement. Now, we’re eyeing a potential pullback toward a key support zone at 3420–3400, where buying interest is likely to resurface.
If price action confirms a bounce from this zone, we could see a continuation of the uptrend toward 3450, and if momentum holds, possibly stretching to 3490–3500.
🔻 Trade Setup – Long Opportunity on Pullback
Entry: Buy Gold (XAUUSD) at 3420
Add-on Dip: 3400
Targets: 3450, then 3490–3500 (marked on chart)
Invalidation: Daily close below 3385
📌 Risk/Reward Outlook
This setup presents a tight risk with attractive upside potential. As always, stick to solid risk management and size your positions based on your personal trading plan.
👍 Agree with this view?
Drop a like, leave your comments, and let’s discuss this setup together!
Your feedback keeps the community sharp and growing. 🔥
Happy Trading,
– The InvestPro Team

8/29: Sell in the 3446–3458 ZoneGood evening, everyone!
After testing the 3419–3427 resistance zone, gold pulled back briefly, then found support and broke higher, keeping the 1D uptrend intact. However, after such a sharp short-term rally, a pullback is likely.
📌 Key Supports: 3433–3428–3423
📌 Trading Plan: Short first, then buy
Main sell zone: 3446–3463
Look for short-term buys near support retests
Watch resistance reaction at 3438–3448
Heading into the weekend, news-driven uncertainty may increase — risk management is essential.

From Rally to Reversal: Gold Near PRZ, Bears Prepare!As I expected in the previous idea , Gold started to rise with the help of Powell's words and reached my targets(Full Target) .
Gold is currently entering the Potential Reversal Zone(PRZ) and is also moving near the Resistance zone($3,451-$3,406) and Resistance line .
In terms of Elliott Wave theory , Gold appears to be completing microwave 5 of the main wave C . The wave structure is a Zigzag Correction(ABC/5-3-5) .
I expect Gold to drop to at least $3,363 after entering the Potential Reversal Zone(PRZ) .
Second Target: $3,351
Third Target: Support lines
Note: Stop Loss (SL) = $3,416(Worst)
Gold Analyze (XAUUSD), 2-hour time frame.
Be sure to follow the updated ideas.
Do not forget to put a Stop loss for your positions (For every position you want to open).
Please follow your strategy; this is just my idea, and I will gladly see your ideas in this post.
Please do not forget the ✅ ' like ' ✅ button 🙏😊 & Share it with your friends; thanks, and Trade safe.

Gold 150 Pips SecuredOANDA:XAUUSD
www.tradingview.com
perfect play, swept SSL on the 15m, closed above high, target BSL/PDH

Gold Trade Set UpOANDA:XAUUSD
www.tradingview.com
Price has been making HH/HL so im overall bullish above this 15m high. I want to see a close above, and retest to target PDH/HH

xauusd daily📊 XAU/USD – Wave Analysis
Gold is likely finishing Wave 1 and could correct down to 3352–3370 to complete Wave 2.
🔎 Analysis based on Fundamentals + Ichimoku + Elliott Wave
Gold Sets Up for potential Upside Expansion as Buyers Step InGold (XAUUSD) is showing renewed bullish momentum after defending the mid-range support and reclaiming ground above the $3,410 zone. The structure suggests potential continuation higher with multiple bullish confluences aligning.
✅ Bullish Confluences:
Fibonacci Alignment: Price holding above the 38.2% retracement ($3,405) signals strength and potential for a higher retracement swing.
Volatility Band Support: Bounce from mid-band confirms buy-side defense and continuation potential.
Higher Low Structure: Recent consolidation maintained bullish structure, avoiding breakdown and favoring upside expansion.
🎯 Fibonacci-Based Targets:
TP1 – $3,429 (38.2%): First resistance target for partial profit-taking.
TP2 – $3,436 (61.8%): Next upside extension aligning with volatility resistance.
TP3 – $3,448 (100%): Full measured move completion toward upper band.
SL: Below $3,407 to invalidate the bullish thesis in case of breakdown.

XAUUSD – 1H | OB / CCH map Green = Buy OB, Red = Sell OB. Current price ~ 3410.7.
Key zones I’m tracking:
CCH / 1H supply: 3415–3422
HTF HIGH supply: 3435–3448
1H OB (near): 3382–3372
1H OB (deeper): 3334–3320
Scenario 1 – Rejection from supply (sell):
If price sweeps into 3415–3422 (CCH) or pushes into 3435–3448 (HTF HIGH) and 3–5m closes fall back below 3420, I’ll look for shorts targeting 3382–3372 first, then the 3334–3320 OB. Invalidation for the idea is sustained acceptance above 3450.
Scenario 2 – Mitigation then continuation (buy):
If price pulls back to 3382–3372 (1H OB) and prints a bullish shift (3–5m BOS/CHoCH), I’ll look for buys back to 3415/3422, and, if accepted above 3420, continuation into 3435–3448. If the first OB fails, the next buy zone is 3334–3320 (reaction-only with confirmation).
Execution: entries on 3–5m, always require a clear shift; no blind orders.

Gold Rejection at Key Fib Resistance: Pullback Setups in PlayPrice is showing rejection near the upper boundary of its volatility bands after stalling below the $3,423–$3,425 zone, hinting at a potential pullback. The setup aligns with multiple bearish confluences, favoring a downside move toward lower support levels.
✅ Bearish Confluences:
Fibonacci Resistance: Price rejected around the 38.2% retracement zone ($3,423.5), signaling supply pressure.
Overextended Move: Strong rally into upper volatility bands increases probability of mean reversion.
Risk/Reward Setup: Favorable downside structure with stop tightly above recent highs, targeting a deeper retracement.
🎯 Fibonacci-Based Targets:
TP1 – $3,415.9 (61.8%): First retracement support, short-term target.
TP2 – $3,403.9 (100%): Full retracement, aligning with prior liquidity zone.
TP3 – $3,366.8: Lower volatility band support for extended bearish continuation.
SL: Above $3,430 to invalidate the short thesis in case of breakout continuation.

XAU/USD – End-of-Month Liquidity Sweep SetupGold is currently in a short-term corrective phase at the end of the month. Based on historical data, the past 4 months show that Gold tends to make a deep liquidity sweep towards the downside before resuming its bullish leg. This could once again be the case today.
📊 Key Observations:
Gold has shown repeated end-of-month wicks from 343x down to 335x zones.
Today’s focus: market may sweep liquidity below 3395 into the lower support zones before resuming higher.
Upcoming Core PCE data could trigger intraday volatility. If results align with the previous reading → short-term bearish pressure is expected before the larger bullish continuation.
📌 Key Levels & Zones
🔹 Resistance Zones
Supply Zone (3434 – 3436) → Ideal for short-term SELL setups.
Upper Resistance (3424 – 3435) → Breakout above this could open path to new ATH levels.
🔹 Support Zones
Key Support 1 (3395 – 3390) → First intraday liquidity area.
VPOC Zone (3376 – 3374) → Strong BUY zone, expect sharp reaction if price sweeps here.
Deep Liquidity Zone (3363 – 3355) → Extreme support; unlikely unless a major unexpected event occurs.
📌 Trading Plan
✅ BUY Zone
Entry: 3376 – 3374
SL: 3369
TP: 3380 – 3385 – 3390 – 3400 – 3410 – 3420 – ???
🎯 Best area to build long positions – aligned with VPOC & liquidity sweep expectations.
✅ SELL Zone
Entry: 3434 – 3436
SL: 3440
TP: 3430 – 3425 – 3420 – 3410 – 3400
⚠️ Short-term setup only – focus on Asian & London session corrections.
📍 Conclusion:
Expect liquidity sweep lower first before a bullish leg continues.
Watch 3395 – 3375 zones for BUY confirmations.
If price holds above 3375, Gold remains bullish heading into September.

Gold Price Update: Trading Opportunities Amid Fed Drama and PCE!Fundamental Analysis: What’s Driving Gold’s Surge? 🌟
Gold Prices Surge: Spot gold closed the August 28 session up 0.6% at $3,416.14/oz, the highest since July 23. Gold futures settled at $3,466.10/oz, showcasing strong bullish momentum.
USD Index Drops 0.5%: A weaker dollar makes gold more appealing to foreign buyers, fueling the rally. 📉
Fed Uncertainty Grows: Tai Wong, an independent metals trader, notes, “Gold has been steadily climbing for over a week, partly due to concerns about the Fed’s independence. Pressure from Trump is raising fears that the FOMC may cut rates faster and keep them low longer—a bullish setup for gold.” The market now estimates an over 87% probability of a 0.25% rate cut at the Fed’s September 2025 meeting, per CME FedWatch. 🔥
Lisa Cook’s Legal Battle: Fed Governor Lisa Cook has filed a lawsuit, asserting that Trump lacks the authority to fire her. This unprecedented legal fight could reshape norms around the Fed’s independence, boosting gold’s safe-haven appeal. 🇺🇸⚖️
PCE Data in Focus: Investors are eagerly awaiting the Personal Consumption Expenditures (PCE) data today (29/08), the Fed’s preferred inflation gauge. A softer-than-expected report could signal deeper rate cuts, propelling gold higher. Gold thrives in low-interest-rate environments and during economic uncertainty! 📊
Technical Analysis: Bullish Trend Persists, But Watch for a Reversal! 📉
Gold’s uptrend remains strong with no clear signs of reversal. Following yesterday’s data, gold saw a slight pullback to the 339x zone before resuming its rally, swiftly breaking through order blocks (OB) and approaching last month’s highs. However, with prices lingering near these peaks, a potential pullback looms. Here are the key levels and trading strategies:
Key Resistance: 3415 - 3428
Key Support: 3406 - 3397 - 3388 - 3374
Scalping Opportunities:
Sell Scalp: 3415 - 3417
SL: 3420
TP: 3411 - 3406 - 3398
Buy Scalp: 3398 - 3396
SL: 3393
TP: 3401 - 3406 - 3416
Swing Trading Opportunities:
Sell Zone: 3427 - 3429
SL: 3437
TP: 3421 - 3415 - 3406 - 3398
Buy Zone: 3389 - 3387
SL: 3379
TP: 3398 - 3406 - 3415
Gold is red-hot, but the 3415-3428 resistance zone could trigger a reversal if momentum fades. Scalpers can capitalize on quick trades at these levels for attractive risk-reward ratios. Swing traders should wait for confirmation at the buy or sell zones to maximize profits. Always manage risk tightly and stay alert for PCE-driven volatility today! 📉💡

Will Gold Drop for Liquidity Before a Big September Rally?Gold has been consolidating at high levels, repeatedly testing resistance while waiting for end-of-month US data (Prelim GDP q/q & Unemployment Claims). These releases could act as the perfect trigger: a sharp liquidity grab before September’s rally – when USD weakness and Fed rate cuts are back in focus.
🔑 Key Levels to Watch
Resistance 3400 → a clean break could send price quickly into 342x – 343x, retesting the old ATH.
Support 3370 → if broken, gold may dip into the 335x BUY zone for a strong setup.
📌 MMFLOW Trading Plan
✅ BUY ZONE
3356 – 3354
SL: 3349
TP: 3360 → 3365 → 3370 → 3375 → 3380 → 3390 → 3400+
❌ SELL ZONE
3424 – 3426
SL: 3430
TP: 3420 → 3395 → 3390 → 3385 → 3380 → 3370
🎯 MMFLOW View
End of month often brings sharp swings & liquidity hunts. Be prepared for a potential flush into 335x before the next leg higher.
👉 Stick to discipline, trade only around Key Levels, and avoid chasing price.
🔥 What’s your view – will Gold smash through 3400 first, or dip into 335x before the rally?
👇 Share your thoughts in the comments – let’s trade smart together!

Gold Price Analysis August 29✨ Gold Analysis Today
In the Asian session this morning, the Gold price reached 3320 and there was a slight profit-taking pressure from investors. Recent market developments show a familiar repeating scenario: Asia - Europe reduced and adjusted, while the US is often the place to trigger the rebound wave.
With the current picture, the intraday trading strategy still prioritizes buying when adjusting instead of chasing prices. Today's target is expected to be around 3328. Note, if the price breaks out, absolutely do not rush to sell, unless there is clear confirmation from the H4 candle showing that the downward pressure has returned.
🔑 Trading strategy:
Only wait for BUY at support zones when there is a signal confirming buying pressure.
Support zones to pay attention to: 3402 - 3390 - 3375.

Gold (XAU/USD) Technical Outlook - 29 August 2025Gold remains in a highly reactive zone, with price currently consolidating near the $3410 handle. Institutional order flow shows a battle between bulls defending discount demand zones and bears attempting to exploit premium supply levels. By combining Daily, 4H, and 1H confluences, today’s analysis outlines the most execution-ready buy and sell zones with defined entries, stop-loss levels, and profit targets.
🔹 Primary Buy Zone – $3388 to $3396
This is the highest-probability demand area for today. On the Daily timeframe, the zone sits within a deep discount region of the last bullish leg, aligning with the broader macro bias. The 4H chart reveals a fresh, unmitigated bullish order block, while the 1H structure confirms a BOS (Break of Structure) and liquidity sweep beneath equal lows.
Momentum indicators support this view — RSI is approaching oversold levels, and MACD momentum is shifting bullish. Volume also highlights absorption, suggesting institutional accumulation.
Entry: $3392
SL: $3384
TP1: $3415
TP2: $3428
🔹 Secondary Buy Zone – $3365 to $3372
If the primary demand fails, the next strong support sits around $3365–$3372. This zone overlaps with a Daily breaker block and coincides with the 50% retracement of the previous swing leg. On 4H, liquidity is pooled just below $3370, while 1H imbalance (FVG) aligns with demand.
RSI divergence also strengthens the bullish probability here.
Entry: $3368
SL: $3358
TP1: $3390
TP2: $3410
🔹 Primary Sell Zone – $3425 to $3435
This is the strongest intraday supply zone. On the Daily timeframe, price approaches a premium level of the current retracement, while 4H charts show a fresh supply zone formed from institutional distribution. The 1H chart reveals liquidity buildup above $3428, creating an engineered high.
RSI is flashing bearish divergence at this level, with volume showing prior rejection and imbalance — confirming potential sell-side pressure.
Entry: $3430
SL: $3438
TP1: $3410
TP2: $3395
🔹 Secondary Sell Zone – $3448 to $3458
This zone sits higher, acting as a fallback supply level. It overlaps with a Weekly supply zone, while 4H structure confirms old consolidation highs resting here. If tapped, price is likely to engineer liquidity before displacement. ATR also shows exhaustion at this level, making it a potential reversal point.
Entry: $3453
SL: $3463
TP1: $3430
TP2: $3410
🏆 Executive Summary – Golden Zone
The Primary Buy Zone ($3388–$3396) is nominated as today’s Golden Zone. This area aligns with Daily discount, 4H unmitigated demand, and 1H structural confirmation. With multiple confluences (order block, BOS, liquidity sweep, RSI, MACD), it presents the highest reward-to-risk opportunity.
Golden Execution Idea:
Buy $3392 → SL $3384 → TP $3428 (≈1:4 RR)
Final Thoughts
Gold is currently positioned at a critical juncture, with well-defined buy and sell zones framing today’s opportunities. Traders should stay disciplined, execute only on confirmed setups, and remain aware of liquidity manipulation around key levels. The $3388–$3396 Golden Zone offers the most institutionally aligned trade for today, but alternative supply and demand levels provide structured backup scenarios.

XAUUSD M5 BEARISH STRUCTURE QML LATE RETEST PATTERN NO 02Yes, this is the same market structure where we previously identified a buy setup on the M5 timeframe. Once again, the last Higher High (HH) has been formed, and immediately after that, an Order Block (OB) appeared on M5.
If this OB or “engineer candle” had been formed in isolation, it would hold no real value. However, its authenticity becomes valid because price first created the last HH before forming this structure.
This setup aligns perfectly as a QML (Quasimodo Level) with a late retest, according to both the M5 and M15 timeframes.

GOLD MONTHLY OPENING UPDATESTrade at your own risk. I wait again below, but we are approaching september openning. we go down 3300 again.?
Goodluck.
this is only my idea and prediction, Congrats to my new investors.
you can message me here how I trade.
I only need another 1 who can join this coming september . I trade you wait only.
This is not a financial advice.
Trading is risky, beat the market or have patience on it.
Swing trader always win.

Gold (XAU/USD) – 2H – Inducement & HTM OBGold (XAU/USD) – 2H – Inducement & HTM OB
🔹 Market Structure
The chart shows a potential inducement pattern above liquidity levels, designed to trap early buyers before the real move.
Price has created a fake bullish impulse (a–b–c–d–e), suggesting exhaustion and a setup for downside liquidity grab.
The liquidity above 3,416 has been taken, aligning with inducement theory.
---
🔹 Inducement & Liquidity
After inducement, price is expected to sweep liquidity resting around the 3,400 – 3,390 area.
This liquidity grab could provide momentum toward the HTM Order Block (OB) zone around 3,370 – 3,365.
That zone is the higher-probability demand area where smart money may step in.
---
🔹 HTM Order Block (OB)
The HTM OB aligns with strong confluence:
Previous demand zone
Overlapping liquidity pool
Technical retracement structure
Once price taps this level, a bullish reversal toward higher levels becomes probable.
---
🔹 Outlook & Trading Plan
Bearish short-term: Expect continuation to the downside after inducement, targeting 3,390 → 3,370.
Bullish mid-term: From HTM OB (3,370 – 3,365), potential rebound upward toward 3,416+.
Invalidation: If price closes strong above 3,430, the bearish inducement setup is invalid.
---
✅ Bias: Bearish into HTM OB → Bullish from demand zone
🎯 Targets: 3,390 → 3,370 → 3,416+
❌ Invalidation: Close above 3,430
